
Australia and Critical Minerals in 2026: From Quarry to Strategic Supplier, and the Value Still Left on the Table

Australia and Critical Minerals in 2026: From Quarry to Strategic Supplier, and the Value Still Left on the Table
Driss EFFINA, PhD Independent Researcher, Global Strategy Files Reading time: about 27 minutes
Key takeaways
- Australia is the world's largest lithium miner, with about 32 percent of world output in 2025, and the third largest rare earth miner, with about 7 percent.
- Critical minerals account for only about 4 percent of resources and energy export earnings in 2025-26, rising to about 6 percent in 2026-27.
- Converting spodumene concentrate into lithium hydroxide raises the value of the same lithium by about 54 percent at late 2025 prices.
- Lithium export earnings could range from about A$10 billion to A$24 billion in 2030-31 depending on prices.
Abstract
Critical minerals have become a central element of economic security policy in the major economies, and Australia, which holds large deposits of lithium, rare earths and many other strategic minerals, has positioned itself as an alternative supplier to China. This article assesses Australia’s position in 2026 using the September 2026 Resources and Energy Quarterly of the Department of Industry, Science and Resources, the United States Geological Survey’s Mineral Commodity Summaries 2026, the International Energy Agency’s Global Critical Minerals Outlook 2026 and official information on the United States and Australia critical minerals framework of October 2025. The author builds five indicators: the weight of critical minerals in resources and energy export earnings, Australia’s shares of world lithium and rare earth production and reserves, the value uplift from processing spodumene into lithium hydroxide, the concentration of refining, and three scenarios for lithium export earnings to 2030-31 calibrated on official forecasts. The results show that Australia is the world’s largest lithium miner, with about 32 percent of world output in 2025, and the third largest rare earth miner, with about 7 percent, but that critical minerals still account for only about 4 percent of resources and energy export earnings in 2025-26, rising to about 6 percent in 2026-27. Australia captures little of the value added in processing: converting spodumene concentrate into lithium hydroxide raises the value of the same lithium by about 54 percent at late 2025 prices. Refining remains highly concentrated in China, and the IEA projects that the leading supplier will still control about 70 percent of rare earth refining in 2035. Lithium export earnings could range from about A$10 billion to A$24 billion in 2030-31 depending on prices. The article concludes that Australia’s strategic opportunity lies less in mining, where its position is already strong, than in building refining capacity with allied financing and price support, and that this requires a sustained policy commitment through the price cycle.
Keywords: Australia, critical minerals, lithium, rare earths, refining, supply chains, economic security, resource exports, industrial policy
JEL codes: Q32, F14, F52, L72, O13
1. Introduction
For most of its modern history, Australia’s resources sector has been built on a few large bulk commodities: iron ore, coal, natural gas and, more recently, gold. These commodities have made Australia one of the richest economies in the world and have financed a large share of its public spending. In the 2020s, a new category of minerals has moved to the centre of policy attention: critical minerals, such as lithium, rare earth elements, cobalt, nickel, graphite and gallium, which are essential to batteries, electric vehicles, wind turbines, electronics and defence systems.
What makes these minerals “critical” is not their quantity or their value, which are small compared with iron ore, but the combination of their importance to strategic industries and the concentration of their supply chains. China dominates the refining and processing of most of them, and since 2023 it has imposed export controls on several, including gallium, germanium, graphite and, from April 2025, a range of rare earth elements. In October 2025, it announced a broader set of rare earth controls, before suspending them for one year in November 2025. These measures have shown that control of processing capacity can be used as an instrument of economic and political pressure.
Australia has responded by positioning itself as a reliable alternative supplier for its allies. It adopted a Critical Minerals Strategy in 2023, announced a production tax incentive for processing and a strategic reserve, and in October 2025 signed a framework with the United States to finance critical minerals projects in both countries. This article assesses where Australia stands in 2026, how much these minerals contribute to its economy, how much of the value it captures, and what could change by 2030.
Section 2 sets out the context. Section 3 reviews the literature. Section 4 describes the data and methods. Section 5 presents the results. Section 6 discusses them. Section 7 presents scenarios. Section 8 concludes.
2. Context
2.1 Australia’s resources economy in 2026
According to the September 2026 Resources and Energy Quarterly (REQ), Australia’s resources and energy export earnings reached about A$403 billion in 2025-26 and are forecast to rise to A$422 billion in 2026-27, before falling to A$391 billion in 2027-28. The 2026-27 forecast was revised up by A$6 billion from the June edition. The main reason is the conflict in the Middle East, which, according to the REQ, has disrupted energy supply chains and lifted energy prices: LNG earnings are forecast to rise from about A$57 billion to A$70 billion. Earnings are then expected to decline as prices normalise, supply recovers and shipping disruptions ease, to about A$379 billion in nominal terms in 2030-31.
Iron ore remains the largest export, at about A$123 billion in 2025-26, but its earnings are expected to fall to about A$107 billion in 2026-27 as prices ease. Gold, at about A$72 billion, has become the second largest resources export after a sustained rise in prices. Critical minerals earnings are expected to rise from about A$17 billion in 2025-26 to about A$26 billion in 2026-27, with lithium accounting for more than half.
2.2 The policy framework
Australia’s Critical Minerals Strategy 2023 to 2030, published in June 2023, set the objective of making Australia a globally significant producer of raw and processed critical minerals. The Critical Minerals List identifies minerals considered essential to modern technologies and exposed to supply risk, and a separate list of strategic materials was added in 2024 to cover minerals such as copper and aluminium that are important to the energy transition.
The main instruments of policy are:
- the Critical Minerals Facility and other financing through Export Finance Australia;
- the Critical Minerals Production Tax Incentive, announced as part of the Future Made in Australia agenda in 2024, which provides a refundable tax offset of 10 percent of eligible processing and refining costs for production from 2027-28;
- the Critical Minerals Strategic Reserve, announced in April 2025 with initial funding of A$1.2 billion, intended to secure offtake of critical minerals and support supply to partners;
- bilateral agreements with major partners, notably the United States, Japan, Korea, India and the European Union.
2.3 The United States and Australia framework
On 20 October 2025, the Australian Prime Minister and the President of the United States signed a framework for securing the supply of critical minerals and rare earths. Under the framework, each government undertook to provide at least US$1 billion in financing within six months, and the two governments identified a pipeline of priority projects worth about US$8.5 billion. The US Export-Import Bank announced letters of interest of more than US$2.2 billion for Australian projects. Among the projects named were the Alcoa and Sojitz gallium recovery project at Wagerup in Western Australia, for which Australia would provide up to US$200 million in concessional equity and which is expected to supply up to 10 percent of the world’s gallium, and Arafura’s Nolans rare earths project in the Northern Territory, for which Australia announced an equity investment of US$100 million and which is expected to produce about 5 percent of the world’s rare earths once operating. The framework also refers to potential price floors and standards-based trading systems to counter non-market practices.
2.4 The Chinese export controls
China’s controls on rare earth exports have been the main catalyst for this policy activity. The controls of April 2025 covered several medium and heavy rare earths, including samarium, gadolinium, terbium, dysprosium and yttrium, and led some automobile manufacturers outside China to cut production temporarily. The October 2025 expansion, which would have added further elements and extended controls to products made with Chinese technology, was suspended for one year in November 2025, but the April controls remain in force. According to the IEA, about US$6.5 trillion of annual downstream production outside China could be put at risk if the broadest measures were fully applied.
3. Literature review
The analysis draws on three strands of literature.
The first concerns the economics of resource dependence. Corden and Neary (1982) formalised the “Dutch disease”, in which a resource boom raises the real exchange rate and squeezes other tradable sectors. Sachs and Warner (2001) found that resource-rich countries tended to grow more slowly, a result that has been widely debated. Australia is often cited as a counter-example, a resource-rich country with strong institutions, but its dependence on a few commodities and a few buyers remains a vulnerability.
The second concerns diversification and the value of what a country exports. Hausmann, Hwang and Rodrik (2007) showed that the composition of a country’s exports matters for its growth: countries that export goods typically produced by richer countries tend to grow faster. In the minerals context, this suggests that moving from the export of concentrates to the export of refined products and components could raise the economic return from the same resources. Garnaut (2019), in an influential book, argued that Australia’s abundant renewable energy and minerals could make it a “superpower” in the processing of energy-intensive products in a low carbon world.
The third concerns the geopolitics of critical minerals. Gulley, Nassar and Xun (2018) documented China’s growing control of the supply of minerals essential to emerging technologies and the competition with the United States for these resources. The IEA (2021) report on the role of critical minerals in clean energy transitions highlighted the concentration of processing and the risks it creates. The IEA’s annual Global Critical Minerals Outlook, the latest edition of which was released in July 2026, tracks supply, demand and concentration.
This article contributes to this literature by quantifying, with current data, the weight of critical minerals in Australian exports, Australia’s global market shares, the value uplift from processing and the sensitivity of earnings to prices.
4. Data and methodology
4.1 Data
- Export earnings and forecasts: Department of Industry, Science and Resources, Resources and Energy Quarterly, September 2026, as published and reported.
- Production and reserves: USGS Mineral Commodity Summaries 2026, chapters on lithium and rare earths.
- Prices: USGS (lithium prices in 2025) and the REQ (spodumene price history and forecasts).
- Refining concentration and investment: IEA Global Critical Minerals Outlook 2026, released on 16 July 2026.
- Policy information: official statements on the United States and Australia framework of October 2025 and on Australian policy instruments.
4.2 Methods
1. Export shares. The share of each commodity group in total resources and energy export earnings is calculated for 2025-26 and 2026-27. 2. Global market shares. Australia’s shares of world mine production and reserves are calculated from the USGS tables. 3. Value uplift from processing. The value of lithium as spodumene concentrate (SC6, about 6 percent lithium oxide) is compared with its value as lithium hydroxide. A conversion ratio of 7.5 tonnes of spodumene concentrate per tonne of lithium hydroxide is assumed, consistent with the lithium content of the two products and typical recovery rates. Prices are those reported by the USGS for November 2025: about US$970 a tonne for spodumene (Australia, free on board) and about US$11,200 a tonne for lithium hydroxide (China, free on board). 4. Scenarios. Lithium export earnings to 2030-31 are projected by combining the REQ forecast for 2026-27 (about A$17 billion), the REQ forecast of mine output growth of 8.8 percent a year, and three price paths. The base path is calibrated to reproduce the REQ forecast of about A$15 billion in 2030-31.
4.3 Limitations
The REQ figures are forecasts and are subject to large uncertainty. The USGS production figures for 2025 are estimates, and Chinese rare earth production is an official quota that excludes undocumented output. The value uplift calculation is approximate: it ignores processing costs, which are significant, and it compares prices in different locations. It measures the gross value added available to be captured, not the profit. The scenarios do not include exchange rate effects.
5. Results
5.1 The weight of critical minerals in exports
Figure 1 shows the composition of resources and energy export earnings in 2025-26 and 2026-27.
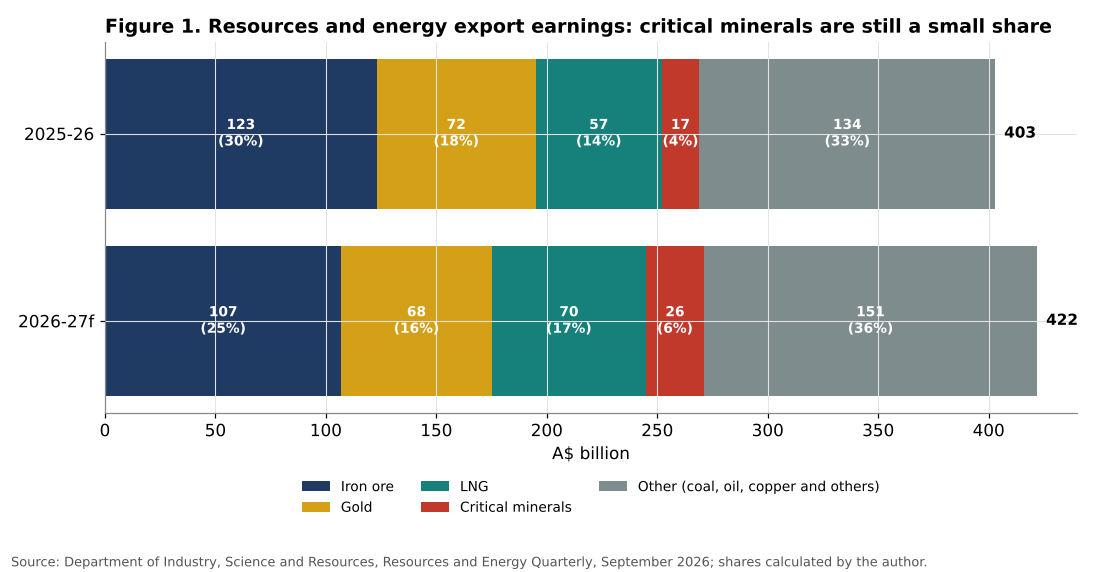
In 2025-26, iron ore accounted for about 30.5 percent of resources and energy export earnings, gold for about 17.9 percent, LNG for about 14.1 percent, and critical minerals for only about 4.2 percent. Other commodities, including coal, oil and copper, accounted for the remaining third.
In 2026-27, the REQ forecasts point to a significant change in composition. The share of iron ore falls to about 25.4 percent, while the share of LNG rises to about 16.6 percent because of higher energy prices, and the share of critical minerals rises to about 6.2 percent, as lithium earnings jump from about A$10 billion to about A$17 billion with the recovery of prices.
| Commodity | 2025-26 (A$ bn) | Share | 2026-27f (A$ bn) | Share |
|---|---|---|---|---|
| Iron ore | 123 | 30.5% | 107 | 25.4% |
| Gold | 72 | 17.9% | 68 | 16.1% |
| LNG | 57 | 14.1% | 70 | 16.6% |
| Critical minerals | 17 | 4.2% | 26 | 6.2% |
| of which lithium | 10 | 2.5% | 17 | 4.0% |
| Other | 134 | 33.3% | 151 | 35.8% |
| Total | 403 | 100% | 422 | 100% |
Table 1. Resources and energy export earnings. Source: Resources and Energy Quarterly, September 2026; shares calculated by the author.
Two conclusions can be drawn. First, despite the policy attention they receive, critical minerals remain a small part of Australia’s resources economy. Even in 2026-27, their export earnings will be about a quarter of iron ore’s. Second, their contribution is highly volatile, driven above all by the price of lithium, which can double or halve within a year.
5.2 Australia in world lithium
Figure 2 shows world lithium mine production by country in 2025.
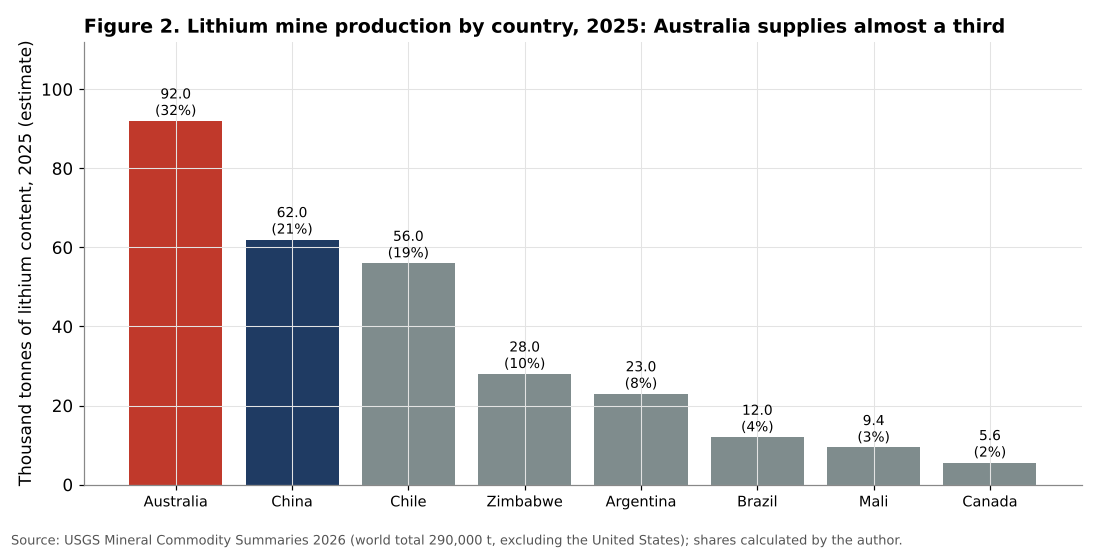
According to the USGS, Australia produced about 92,000 tonnes of lithium content in 2025, about 31.7 percent of world production (excluding the United States, whose output is not disclosed). It is by far the largest producer, ahead of China (62,000 tonnes), Chile (56,000 tonnes), Zimbabwe (28,000 tonnes) and Argentina (23,000 tonnes). Australian production rose by about 11 percent from 82,700 tonnes in 2024.
However, Australia’s share of world production has fallen, from about 37.3 percent in 2024 to about 31.7 percent in 2025, because world production grew much faster (by about 31 percent, to 290,000 tonnes) than Australian production. The fastest growth came from China, Zimbabwe and Mali, where new hard rock mines, often financed by Chinese companies, have come into production. This illustrates a key feature of the lithium market: supply can expand rapidly when prices are high, which then pushes prices down.
Most Australian lithium is mined as spodumene, a hard rock mineral, in Western Australia, and exported as concentrate, mainly to China, where it is refined into lithium carbonate or hydroxide for battery manufacture. Australia’s position is therefore that of a dominant miner but a marginal refiner.
5.3 Australia in world rare earths
Figure 3 shows world rare earth mine production and reserves.
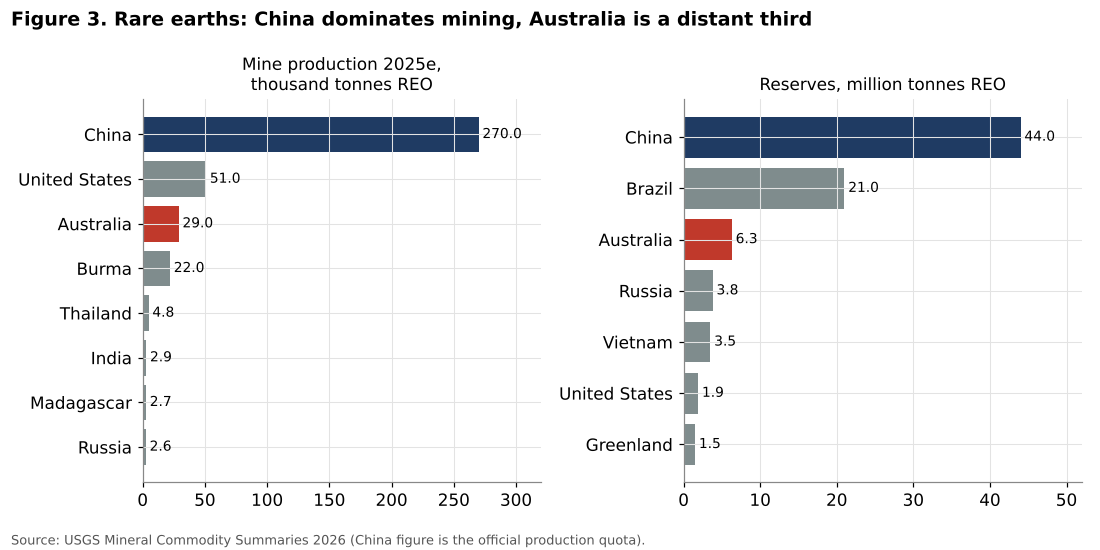
In rare earths, China’s dominance is much greater. According to the USGS, China’s production quota was 270,000 tonnes of rare earth oxide equivalent in 2025, about 69 percent of the world total of 390,000 tonnes, and this figure excludes undocumented production. The United States produced about 51,000 tonnes and Australia about 29,000 tonnes, or about 7.4 percent of world production. Burma (Myanmar) produced about 22,000 tonnes.
Australia’s reserves, at about 6.3 million tonnes, are the third largest identified by the USGS after China (44 million tonnes) and Brazil (21 million tonnes), representing about 7 percent of a world total of more than 85 million tonnes. Of these, about 3.3 million tonnes are classified as reserves under the Australian JORC code.
The more important point concerns processing. Mining represents only the first stage of the rare earth supply chain. The ores must then be cracked, separated into individual elements, converted into metals and alloys, and made into permanent magnets. China dominates each of these stages to a greater extent than mining. Australia’s main producer, Lynas Rare Earths, is the largest producer of separated rare earths outside China, with separation operations in Malaysia and processing in Western Australia, and projects such as Arafura’s Nolans and Iluka’s Eneabba refinery aim to add capacity in Australia.
5.4 The value left on the table
Figure 4 illustrates the value uplift from processing lithium and the volatility of prices.
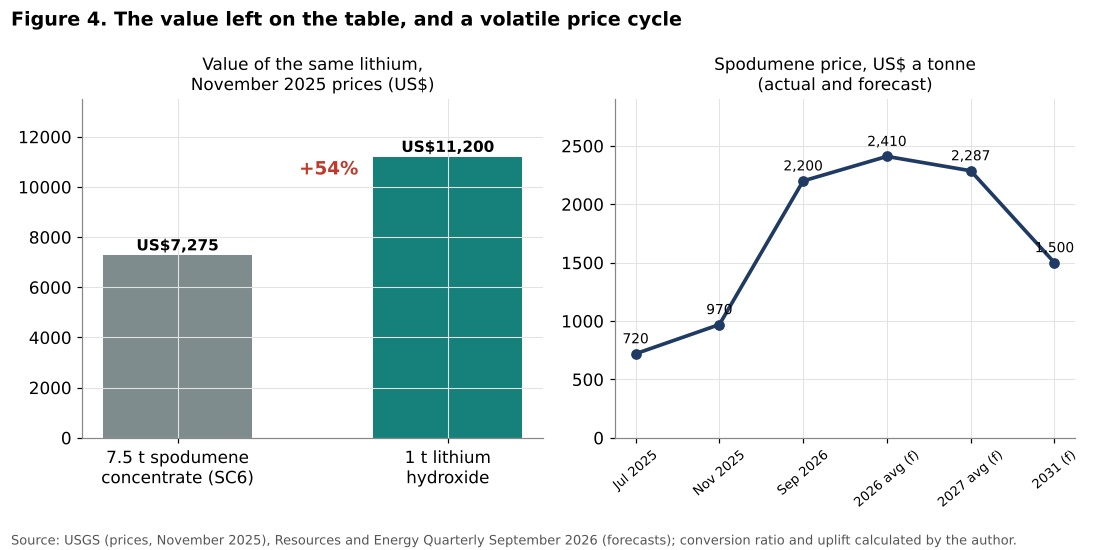
The left panel compares the value of the same quantity of lithium sold as concentrate and as hydroxide. At November 2025 prices reported by the USGS, 7.5 tonnes of spodumene concentrate, enough to produce about one tonne of lithium hydroxide, were worth about US$7,275, while one tonne of lithium hydroxide was worth about US$11,200. Processing therefore raised the value of the same lithium by about US$3,925, or 54 percent.
This uplift is a gross measure: it must cover the costs of processing, which include energy, chemicals, labour and capital. In practice, refining margins have been very volatile and at times negative outside China. Both of Australia’s lithium hydroxide plants, at Kwinana and Kemerton in Western Australia, suffered from technical difficulties and cost overruns, and their operations were scaled back during the price slump of 2024 and 2025. Nevertheless, the calculation shows the order of magnitude of the value that Australia does not capture by exporting concentrate.
The right panel shows the extreme volatility of lithium prices. The price of spodumene concentrate fell to about US$720 a tonne in July 2025, then recovered to about US$970 in November 2025 and to more than US$2,200 in early September 2026. The REQ forecasts an average of about US$2,410 in 2026 and US$2,287 in 2027, before a decline to about US$1,500 by 2031 as new supply comes on stream. Within little more than a year, the price has tripled. Such volatility makes investment in processing very risky, because a refinery takes several years to build and must remain profitable through the cycle.
5.5 The refining bottleneck
Figure 5 shows the concentration of rare earth refining according to the IEA.
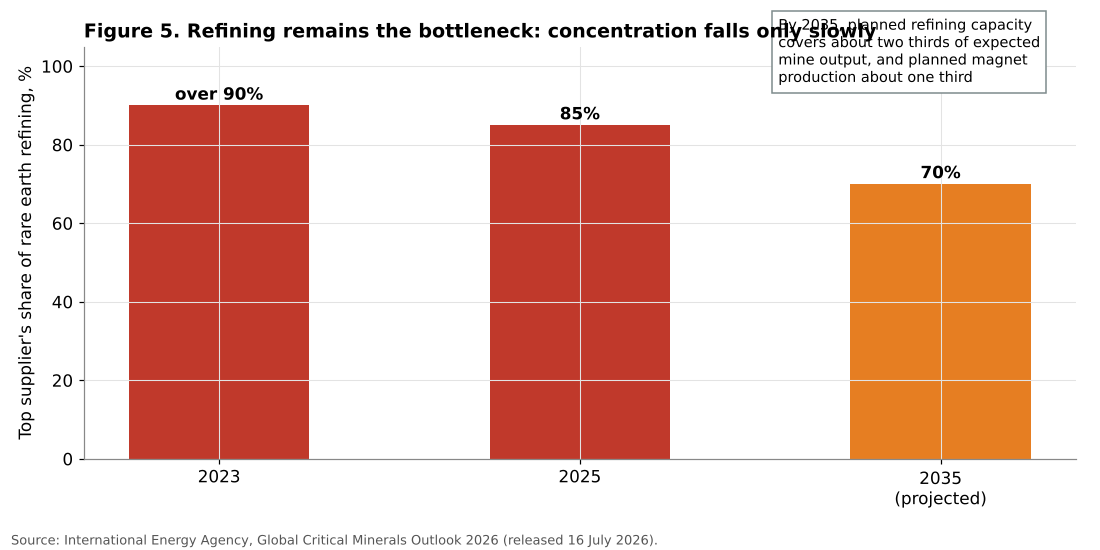
The IEA’s Global Critical Minerals Outlook 2026, released in July 2026, finds that refining remains highly concentrated. The share of the leading supplier in rare earth refining fell from more than 90 percent in 2023 to about 85 percent in 2025, and is projected to fall to about 70 percent by 2035 if planned projects proceed on schedule. More broadly, the top refiners (Indonesia for nickel and China for most other energy minerals) accounted for more than three quarters of the growth in refined supply over the past two years, and in manganese, nickel and graphite, virtually all supply growth came from the dominant supplier.
The IEA also identifies a gap between stages of the rare earth supply chain outside China. By 2035, planned refining capacity would only be able to process about two thirds of expected mine output, and planned magnet production would cover only about one third. In other words, even if new mines open in Australia and elsewhere, a large part of their output may still have to be processed in China unless more refining and magnet capacity is built.
The IEA also noted that investment in critical minerals fell by 9 percent in 2025, ending several years of growth, while public finance commitments more than quadrupled between 2023 and 2025, to about US$65 billion. This contrast shows that governments are increasingly stepping in where private investors hesitate, because of low prices and the risks associated with competing against Chinese producers.
5.6 What the framework with the United States changes
The October 2025 framework with the United States is significant less for its size than for its instruments. The combined commitment of at least US$2 billion within six months, and a pipeline of about US$8.5 billion, is small relative to the scale of the challenge. But the framework introduces three elements that address the specific obstacles to building non-Chinese supply chains:
- equity investment by governments, as in the Alcoa and Sojitz gallium project and Arafura’s Nolans project, which reduces the cost of capital for projects that private markets consider too risky;
- offtake rights, which guarantee a buyer for the output;
- potential price floors, which would protect producers against the price collapses that have repeatedly made non-Chinese projects unprofitable.
The last element is the most important. The main reason why non-Chinese refining capacity has not developed is not a lack of resources or technology, but the inability of projects to survive periods of low prices, which have been frequent and, according to many observers, sometimes reinforced by Chinese overcapacity. A credible price floor, financed by governments or by a group of allied buyers, would change the economics of investment. Its design, however, raises difficult questions about cost, duration and the risk of subsidising inefficient projects.
5.7 Gallium: a case study
The Alcoa and Sojitz gallium project illustrates the potential of by-product recovery. Gallium is produced as a by-product of alumina refining, and Australia is one of the world’s largest producers of alumina. China has dominated gallium production and imposed export controls on it in 2023. By recovering gallium from its existing Wagerup alumina refinery, Alcoa could supply up to 10 percent of world gallium, according to the project announcement. This type of project, which adds value to existing industrial operations, may offer better returns and lower risks than new standalone mines.
5.8 Concentration of buyers and destinations
A further dimension of risk concerns buyers rather than suppliers. Because most of the world’s lithium refining capacity is located in China, the large majority of Australian spodumene concentrate is sold to Chinese refiners. The same is true, to a lesser degree, for other concentrates. This means that Australia’s critical minerals exports are concentrated not only by product, with lithium accounting for more than half of earnings, but also by destination. In periods of low prices, Chinese refiners can reduce purchases or renegotiate contracts, and Australian mines are among the first to suspend production, as several did during the slump of 2024 and 2025.
This double concentration, by product and by buyer, is the mirror image of the concentration of refining highlighted by the IEA. Diversifying buyers requires refining capacity outside China, in Australia or in partner countries such as Japan, Korea, the United States and the European Union. The value of the framework with the United States and of similar agreements lies partly in the creation of alternative buyers for Australian output, which would strengthen the bargaining position of Australian producers even when they continue to sell to China.
6. Discussion
6.1 A strong mining position, a weak processing position
The results confirm that Australia’s position in critical minerals is strong at the mining stage and weak at the processing stage. It is the world’s leading lithium miner and an important rare earth miner, with large reserves of many other critical minerals. But it exports most of its output as concentrate and captures only a small share of the value added further along the supply chain.
This configuration has several disadvantages. It leaves Australia exposed to price volatility at the most volatile stage of the chain, makes it dependent on Chinese refiners as buyers, and limits its contribution to the supply chain security of its allies, since concentrate exported to China does not reduce their dependence on Chinese processing.
6.2 Why processing is hard
The obstacles to processing in Australia are well known. Processing is energy and chemical intensive, and Australian energy prices and labour costs are higher than in China. Chinese refiners benefit from scale, experience, integrated supply chains and, in many cases, state support. The technology of refining specific minerals, especially rare earths and lithium hydroxide, is complex, and the experience of the Kwinana and Kemerton lithium hydroxide plants shows that commissioning can take years and cost much more than planned.
Most importantly, the price volatility shown in Figure 4 makes it very difficult to finance processing plants on commercial terms. A plant built when prices are high may face years of losses when prices fall. Chinese competitors, with lower costs and access to state finance, are better able to survive these periods.
6.3 The role of public policy
These obstacles justify public intervention, if the objective is supply chain security rather than pure economic return. The Production Tax Incentive, which will provide a 10 percent offset on processing costs from 2027-28, reduces the cost disadvantage. The Strategic Reserve and the framework with the United States address the risks of price volatility and the lack of buyers outside China.
But the scale of these interventions remains modest relative to the problem. The value uplift calculation suggests that converting a significant share of Australian lithium into hydroxide would add a few billion dollars a year to export earnings, but only if plants can operate profitably through the price cycle. The policy challenge is to design support that is sufficient to sustain investment through low price periods without creating permanent subsidies for uncompetitive plants.
6.4 Macroeconomic implications
From a macroeconomic perspective, the critical minerals sector is too small to change Australia’s economic trajectory in the short term. In 2026-27, critical minerals earnings of about A$26 billion would represent about 6 percent of resources and energy exports and roughly 1 percent of GDP. Iron ore, LNG and gold will continue to dominate Australia’s terms of trade.
However, the sector has strategic value beyond its economic weight. It strengthens Australia’s relationships with its main allies, provides an alternative to Chinese supply for strategic industries, and creates a potential base for future industrial development in processing, battery materials and possibly components. It may also partly offset the expected decline of coal exports as the world decarbonises.
6.5 Relationship with China
Australia’s critical minerals strategy has an inherent tension. China is by far the largest buyer of Australian lithium concentrate and of many other resources, including iron ore. A strategy aimed at building supply chains that exclude China could, if pursued too aggressively, damage Australia’s trade relationship with its largest customer. The experience of 2020 to 2022, when China imposed informal restrictions on several Australian exports, shows that this risk is real.
The approach taken so far has been to build alternative capacity alongside existing trade, rather than to restrict exports to China. This approach seems appropriate, but it means that Australian concentrate will continue to flow largely to Chinese refiners for the foreseeable future.
6.6 Links with productivity and the labour market
The development of processing also raises questions linked to the other articles in this series on Australia. Processing plants require skilled workers, engineers and construction capacity, which are scarce in an economy with weak productivity growth and a tight labour market in construction. The productivity problems discussed in the previous article apply directly: projects take longer and cost more in Australia than in many competitor countries. Conversely, a successful processing industry could raise productivity by moving Australian resources further up the value chain.
7. Scenarios for lithium export earnings to 2030-31
7.1 Assumptions
Figure 6 presents three scenarios for lithium export earnings from 2026-27 to 2030-31. All three start from the REQ forecast of about A$17 billion in 2026-27 and assume that export volumes grow by 8.8 percent a year, in line with the REQ forecast for mine output. They differ only in the path of prices.
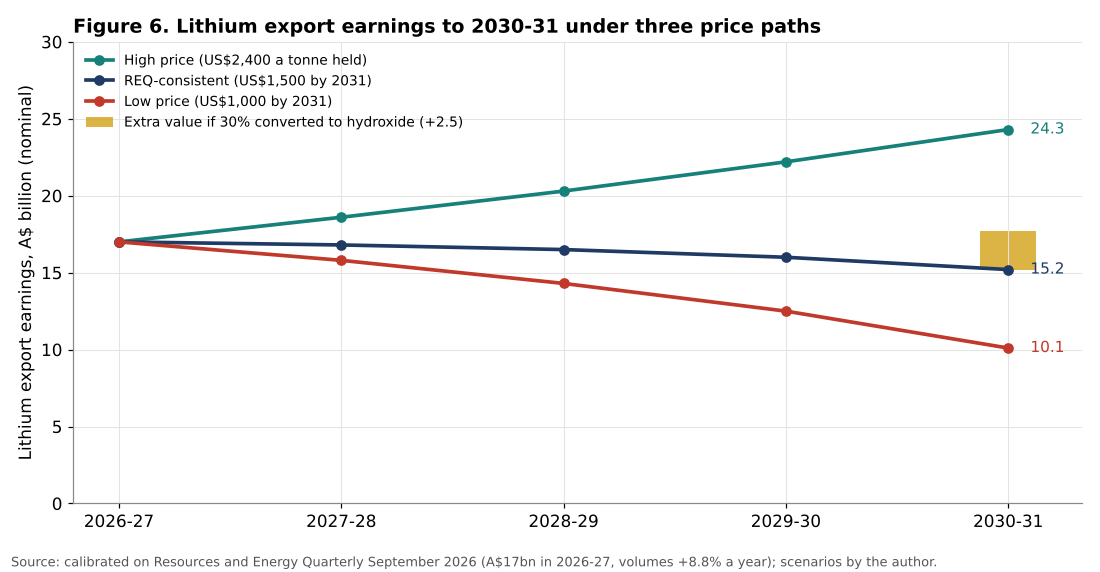
High price scenario. The spodumene price remains around US$2,400 a tonne until 2030-31, because demand for batteries for electric vehicles and energy storage grows faster than expected and new supply is delayed. Lithium export earnings rise to about A$24.3 billion in 2030-31.
REQ-consistent scenario. The price declines gradually to about US$1,500 a tonne by 2030-31, as forecast by the REQ. Rising volumes roughly offset falling prices, and earnings fall slightly to about A$15.2 billion in 2030-31, consistent with the REQ forecast of about A$15 billion.
Low price scenario. A new wave of supply from Africa, China and South America, combined with slower growth of electric vehicle sales, pushes the price down to about US$1,000 a tonne by 2030-31. Earnings fall to about A$10.1 billion.
In addition, the author estimates the effect of converting 30 percent of Australian lithium output into lithium hydroxide domestically, using the 54 percent uplift calculated above. In the REQ-consistent scenario, this would add about A$2.5 billion to export earnings in 2030-31, before processing costs.
7.2 Interpretation
The range of outcomes, from about A$10 billion to about A$24 billion, shows that price is the dominant driver of lithium earnings, more important than volumes or processing. The difference between the high and low scenarios is more than five times the additional value that domestic processing of 30 percent of output would generate.
This has two implications. First, Australia’s lithium earnings will remain volatile, whatever its processing strategy, unless price stabilisation mechanisms are developed. Second, domestic processing would add value, but it would not by itself transform the economics of the sector. Its main justification is strategic: to provide non-Chinese refined supply for allies and to capture a larger share of the chain over time.
7.3 Rare earths
For rare earths, no quantitative scenario is presented because official forecasts of export earnings are not available in comparable detail. Qualitatively, the outlook depends on three factors: the evolution of Chinese export controls, which have increased the willingness of buyers outside China to pay a premium for non-Chinese supply; the completion of refining projects in Australia and allied countries; and the development of magnet production outside China, which the IEA identifies as the most severe bottleneck.
7.4 Indicators to monitor
The author suggests monitoring:
1. the quarterly Resources and Energy Quarterly forecasts of critical minerals earnings; 2. spodumene and lithium hydroxide prices; 3. the progress of refining projects, especially rare earths separation and lithium hydroxide in Western Australia and the Northern Territory; 4. the implementation of the United States and Australia framework, including any price floor mechanism; 5. the evolution of Chinese export controls on rare earths and other critical minerals.
8. Conclusion
This article has assessed Australia’s position in critical minerals in 2026. Its main findings are:
1. Critical minerals account for only about 4 percent of Australia’s resources and energy export earnings in 2025-26, rising to about 6 percent in 2026-27, compared with about 25 to 30 percent for iron ore. 2. Australia is the world’s largest lithium miner, with about 32 percent of world output in 2025, although its share has fallen as supply from other countries has grown rapidly. It is the third largest rare earth miner, with about 7 percent of world output and reserves. 3. Australia captures little of the value added in processing. At late 2025 prices, converting spodumene concentrate into lithium hydroxide raised the value of the same lithium by about 54 percent. 4. Refining remains highly concentrated. The leading supplier still controlled about 85 percent of rare earth refining in 2025, and the IEA projects about 70 percent in 2035. 5. Lithium export earnings could range from about A$10 billion to about A$24 billion in 2030-31 depending on prices; the official forecast implies about A$15 billion.
The overall conclusion is that Australia has already secured a strong position at the mining stage, but that its strategic contribution to allied supply chains, and its share of the value created, depend on its ability to build processing capacity. This requires financing, offtake arrangements and, above all, mechanisms to sustain investment through the extreme price cycles that characterise these markets. The framework signed with the United States in October 2025 introduces the right instruments, notably equity, offtake rights and potential price floors, but at a scale that remains modest. Turning Australia from a quarry into a strategic supplier will require a sustained commitment over many years, through periods of low prices as well as high ones.
Need this analysis for your organisation?
We prepare confidential briefings, executive talks and studies on countries, markets and policies, built on the same method as this article.
Request a briefingSupport independent analysis
Our studies are free to read and carry no advertising. If this one was useful, a small contribution helps us publish the next.
Support our workGo further: books by Global Strategy Files

Frequently asked questions
How important is Australia in world lithium production?
Australia is the world’s largest lithium miner, with about 32 percent of world output in 2025, although its share has fallen as supply from other countries grew. It is also the third largest rare earth miner, with about 7 percent of world output.
How much do critical minerals contribute to Australia’s exports?
Still little. Critical minerals account for only about 4 percent of Australia’s resources and energy export earnings in 2025-26, rising to about 6 percent in 2026-27, compared with about 25 to 30 percent for iron ore.
Why does Australia want to refine lithium at home?
Because most of the value lies in processing. At late 2025 prices, converting spodumene concentrate into lithium hydroxide raises the value of the same lithium by about 54 percent, and refining remains highly concentrated in China, which raises supply security concerns for importers.
What could Australia earn from lithium exports by 2030?
Australia’s lithium export earnings could range from about A$10 billion to A$24 billion in 2030-31, depending mainly on prices, according to scenarios calibrated on official forecasts. Building refining capacity would raise the value captured from the same volumes.
Methodological note
All shares, ratios, value uplift calculations and scenarios in this article were calculated by the author. Export earnings and forecasts come from the September 2026 Resources and Energy Quarterly of the Department of Industry, Science and Resources, as published and reported; the critical minerals category follows the REQ definition. Production, reserves and 2025 prices come from the USGS Mineral Commodity Summaries 2026. Refining concentration and investment data come from the IEA Global Critical Minerals Outlook 2026. The conversion ratio of 7.5 tonnes of spodumene concentrate per tonne of lithium hydroxide is an approximation. The lithium earnings scenarios combine the REQ forecast for 2026-27, volume growth of 8.8 percent a year and linear price paths; they are illustrative and do not constitute investment advice.
References
Corden, W. M. and Neary, J. P. (1982). Booming Sector and De-industrialisation in a Small Open Economy. Economic Journal, 92(368), 825 to 848.
Department of Industry, Science and Resources (2023). Critical Minerals Strategy 2023 to 2030. Australian Government, Canberra.
Department of Industry, Science and Resources (2026). Resources and Energy Quarterly, September 2026. Australian Government, Canberra.
Garnaut, R. (2019). Superpower: Australia’s Low-Carbon Opportunity. La Trobe University Press, Melbourne.
Gulley, A. L., Nassar, N. T. and Xun, S. (2018). China, the United States, and Competition for Resources that Enable Emerging Technologies. Proceedings of the National Academy of Sciences, 115(16), 4111 to 4115.
Hausmann, R., Hwang, J. and Rodrik, D. (2007). What You Export Matters. Journal of Economic Growth, 12(1), 1 to 25.
International Energy Agency (2021). The Role of Critical Minerals in Clean Energy Transitions. IEA, Paris.
International Energy Agency (2026). Global Critical Minerals Outlook 2026. IEA, Paris.
Sachs, J. D. and Warner, A. M. (2001). The Curse of Natural Resources. European Economic Review, 45(4 to 6), 827 to 838.
United States and Australia (2025). United States and Australia Framework for Securing of Supply in the Mining and Processing of Critical Minerals and Rare Earths. Washington, DC, 20 October 2025.
United States Geological Survey (2026). Mineral Commodity Summaries 2026: Lithium; Rare Earths. Reston, Virginia.
