
American Tariffs in 2026: Industrial Gains, Consumer Costs and the Trade-offs of Protection

American Tariffs in 2026: Industrial Gains, Consumer Costs and the Trade-offs of Protection
Driss EFFINA, PhD Independent Researcher, Global Strategy Files Reading time: about 26 minutes
Key takeaways
- The average US tariff rate rose from about 2.5 percent before 2025 to about 11 percent in August 2026, according to the Yale Budget Lab.
- Estimates of tariff pass-through to imported core goods prices ranged from 46 to 86 percent by January 2026.
- The current tariff regime costs the average US household about 1,100 dollars a year, about 145 billion dollars in total.
- Manufacturing output recovered by about 1.1 to 1.3 percent a year, but manufacturing employment fell by about 70,000 in 2025.
Abstract
Since 2025, the United States has applied its highest tariffs in decades. The average tariff rate, which was about 2.5 percent before 2025, exceeded 10 percent by the end of 2025 and stood at about 11 percent in August 2026, according to the Yale Budget Lab. In February 2026, the Supreme Court ruled that the International Emergency Economic Powers Act did not authorise the President to impose tariffs, invalidating a large part of the 2025 measures; they were replaced first by a temporary global tariff under Section 122 and, from July 2026, by new tariffs under Section 301, while the Section 232 tariffs on steel, aluminium and automobiles remained in force. In its speech of 1 October 2026 on the economy and monetary policy, the Federal Reserve noted that tariff-affected products had seen higher prices but no broad spillover into persistent inflation. This article evaluates the trade-off between the protection of domestic production and the costs borne by consumers and user industries. Using data from the Yale Budget Lab, the Congressional Budget Office, the Federal Reserve’s industrial production statistics, the Bureau of Economic Analysis trade data, the Bureau of Labor Statistics and the US Geological Survey, the author measures the level of protection, the fiscal revenue it has raised, the pass-through of tariffs to consumer prices, the response of manufacturing output and employment, the case of steel, and the costs and revenues of three tariff paths. The main results are as follows. Most of the tariff cost has been passed on to consumers: by January 2026, estimates of pass-through to the prices of imported core goods ranged from 46 to 86 percent, and core goods prices were 3.4 percent above their pre-2025 trend. The current-law tariff regime costs the average household about 1,100 dollars a year, or about 145 billion dollars in total. In return, manufacturing output has recovered modestly, by about 1.1 to 1.3 percent a year, led by durable goods, and the protected steel industry has increased production; but manufacturing employment fell by about 70,000 in 2025 and has only recovered by about 72,000 since its low point of December 2025. The article concludes that the industrial gains of protection are real but narrow and slow, while its costs are broad and immediate, and that the balance depends heavily on what the tariffs are meant to achieve.
Keywords: United States, tariffs, trade policy, protectionism, pass-through, manufacturing, steel, consumer prices, industrial policy
JEL codes: F13, F14, F16, E31, L60
1. Introduction
Tariffs have returned to the centre of American economic policy. For most of the period after the Second World War, the United States pursued trade liberalisation, and by the early 2020s the average tariff on imported goods was about 2 to 3 percent. The first wave of tariffs in 2018 and 2019, on steel, aluminium and imports from China, raised this average modestly. The second wave, from 2025, raised it to levels not seen since the first half of the twentieth century.
The justifications given for tariffs are varied: protecting industries considered strategic for national security, such as steel and aluminium; bringing manufacturing and manufacturing jobs back to the United States; responding to trade practices considered unfair; reducing the trade deficit; raising revenue; and providing leverage in negotiations with trading partners. Critics argue that tariffs are taxes paid largely by domestic consumers and firms, that they raise the cost of inputs for American manufacturers, that they provoke retaliation, and that the jobs they protect are few relative to their cost.
The question set for this article is precisely this trade-off: what industrial gains and what costs for consumers? The aim is not to take a position on the political merits of tariffs, which depend on objectives and values that economics alone cannot settle, but to measure the gains and the costs as precisely as the available data allow.
The context of 2026 makes this measurement both more interesting and more difficult. The Supreme Court decision of 20 February 2026 in Learning Resources, Inc. v. Trump invalidated a large part of the 2025 tariffs, the administration replaced them with other legal instruments, and importers began to receive refunds. At the same time, the energy shock of 2026 pushed inflation up for reasons unrelated to trade, which complicates the identification of tariff effects.
Section 2 sets out the context. Section 3 reviews the literature. Section 4 describes the data and methods. Section 5 presents the results. Section 6 discusses them. Section 7 presents scenarios. Section 8 concludes.
2. Context
2.1 The 2025 tariffs
In 2025, the United States introduced several layers of tariffs. Under Section 232 of the Trade Expansion Act of 1962, which allows tariffs on national security grounds, tariffs on steel and aluminium were raised to 25 percent for all countries in March 2025 and to 50 percent in June 2025, and new Section 232 tariffs were applied to automobiles and certain parts. Under the International Emergency Economic Powers Act (IEEPA), the administration imposed tariffs of 25 percent on goods from Canada and Mexico that did not comply with the rules of origin of the United States, Mexico and Canada Agreement, justified as a response to fentanyl trafficking; a tariff of 10 percent, later raised, on imports from China; and a baseline tariff of at least 10 percent on imports from most countries, with higher “reciprocal” rates for some.
2.2 The Supreme Court ruling
On 20 February 2026, the Supreme Court ruled by six votes to three that IEEPA does not authorise the President to impose tariffs. The majority reasoned that tariffs are a form of taxation, a power that the Constitution assigns to Congress, and that Congress had not clearly delegated it through IEEPA. The ruling invalidated the fentanyl-related tariffs on Canada and Mexico, the IEEPA tariffs on China and the baseline and reciprocal tariffs. It did not affect tariffs imposed under Section 232 or Section 301.
The administration responded the same day by signing a 10 percent global tariff under Section 122 of the Trade Act of 1974, which allows temporary tariffs of up to 15 percent for up to 150 days, with exemptions for some products and for goods from Canada and Mexico that comply with the rules of origin. When the Section 122 tariffs expired on 24 July 2026, they were replaced by new tariffs under Section 301, following an investigation by the United States Trade Representative, with additional rates of 10 or 12.5 percent depending on the country.
2.3 Refunds
The Court did not order automatic refunds, but importers that had paid IEEPA tariffs became entitled to claim them. According to the Congressional Budget Office, refunds began to be paid in May 2026, and about 100 billion dollars had been refunded by July. In July 2026, refunds of about 36 billion dollars exceeded gross customs collections of about 26 billion dollars, so that net customs receipts were negative for the month. The Yale Budget Lab had estimated the total refunds owed at about 165 billion dollars.
2.4 The Federal Reserve’s assessment
In his speech of 1 October 2026 on the economy and monetary policy, Vice Chair Philip Jefferson listed changes in trade policy among the shocks that the economy has absorbed. He noted that tariff-affected products had seen higher prices, but that the Fed did not see a broad spillover into persistent inflation. President John Williams of the New York Fed said on 29 September that tariffs were no longer adding to goods price inflation, although this could change if new tariffs were introduced. Core goods prices in the CPI rose by only 0.7 percent over the year to September 2026.
3. Literature review
The economic literature on tariffs is extensive. Five strands are relevant here.
The first concerns the incidence of tariffs, that is, who ultimately pays them. Studies of the 2018 and 2019 tariffs found near complete pass-through to import prices. Amiti, Redding and Weinstein (2019) and Fajgelbaum, Goldberg, Kennedy and Khandelwal (2020) showed that the prices paid by American importers rose by almost the full amount of the tariff, meaning that foreign exporters did not absorb the cost by lowering their prices. Cavallo, Gopinath, Neiman and Tang (2021) found that pass-through at the border was high but that pass-through to retail prices was lower and slower, as retailers absorbed part of the cost in their margins.
The second concerns the effects on manufacturing. Flaaen and Pierce (2019), economists at the Federal Reserve Board, studied the 2018 and 2019 tariffs and found that the positive effect on employment in protected industries was more than offset by the negative effects of higher input costs and foreign retaliation, so that the net effect on manufacturing employment was slightly negative. This result is important because about half of American imports consist of intermediate inputs and capital goods used by domestic producers.
The third concerns the cost per job saved. Hufbauer and Lowry (2012), studying the tariffs on Chinese tyres in 2009, estimated a cost to consumers of about 900,000 dollars per job saved in the tyre industry. Similar calculations for steel tariffs have produced high figures. These estimates are sensitive to assumptions but they illustrate a general pattern: the benefits of protection are concentrated on a few producers, while the costs are spread across many consumers and user industries.
The fourth concerns the case for protection. The literature on the “China shock”, initiated by Autor, Dorn and Hanson (2013), showed that the rapid growth of imports from China after 2001 caused large and persistent job losses in exposed American communities, which helps explain the political demand for protection. The recent literature on industrial policy, reviewed by Juhász, Lane and Rodrik (2024), argues that targeted interventions can be justified to develop strategic industries, especially when there are national security considerations or learning externalities, although it generally favours subsidies and public investment over broad tariffs. Former United States Trade Representative Robert Lighthizer (2023) made the case that the trade deficit and the loss of manufacturing capacity are strategic vulnerabilities that justify tariffs.
The fifth concerns the macroeconomic effects. Tariffs act like a tax that raises the price level once, but they can also reduce investment through uncertainty and reduce productivity through the protection of less efficient producers. The measurement of trade policy uncertainty, which reached record levels in 2025, has become an important tool in this literature.
4. Data and methodology
4.1 Data
The analysis uses:
- Yale Budget Lab estimates of average tariff rates (customs duties divided by imports, and statutory import-weighted rates), price effects, household costs and revenue, from its publications of April, July and August 2026;
- Yale Budget Lab estimates of pass-through of tariffs to consumer prices and of the deviation of prices from their pre-2025 trend, from its April 2026 tracking report;
- Congressional Budget Office Monthly Budget Reviews for customs receipts and refunds;
- the Federal Reserve’s Industrial Production and Capacity Utilization release of 16 October 2026;
- the BEA and Census trade release for August 2026;
- BLS employment data and summaries by Manufacturing Dive and the Cato Institute;
- USGS Mineral Commodity Summaries 2026 and AISI weekly data for steel.
4.2 Indicators
The author computes or assembles:
1. the evolution of the average tariff rate, distinguishing measures based on customs duties actually collected from statutory rates; 2. customs revenue and refunds; 3. pass-through rates and price deviations from trend; 4. manufacturing output and capacity utilisation; 5. a case study of steel, the industry most directly protected; 6. the aggregate consumer cost, calculated as the Yale Budget Lab estimate of the cost per household (about 1,100 dollars) multiplied by the number of households (about 132 million); 7. three tariff scenarios.
4.3 Scenarios
The scenarios scale the Yale Budget Lab current-law estimates (average rate of 11.8 percent at the end of 2026, price level effect of 0.7 percent, cost per household of 1,100 dollars, revenue of about 1.9 trillion dollars over ten years, or about 190 billion a year) linearly to alternative tariff rates of 7 percent and 15 percent. The price and household effects are proportional to the increase in the rate above a pre-2025 baseline assumed at 2.4 percent; revenue is proportional to the rate. This linear scaling is a simplification: at higher rates, imports fall more, so that revenue rises less than proportionally and the economic costs rise more than proportionally.
4.4 Limitations
Different measures of the tariff rate are not directly comparable. The identification of tariff effects is complicated by other shocks, notably the 2025 front-loading of imports before tariffs took effect and the 2026 energy shock. The aggregate consumer cost is an approximation. The steel case study uses data that combine the effects of tariffs with other factors, including demand from construction and data centres.
5. Results
5.1 The level of protection
Figure 1 shows the evolution of the average tariff rate.
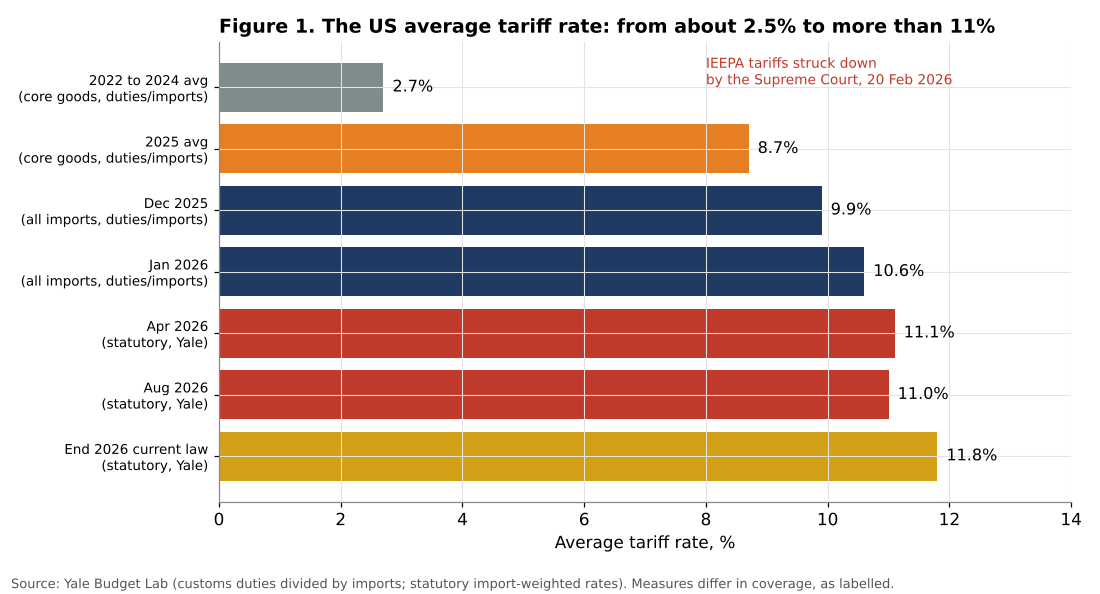
Before 2025, customs duties represented about 2.5 percent of the value of imports on average; for core goods, the figure was 2.7 percent between 2022 and 2024. In 2025, the average for core goods rose to 8.7 percent. By December 2025, customs duties represented 9.9 percent of all imports, and by January 2026, 10.6 percent. After the Supreme Court ruling, the statutory import-weighted rate calculated by the Yale Budget Lab was 11.1 percent in April 2026 and 11.0 percent in August 2026, and is expected to rise to 11.8 percent by the end of 2026 under current law.
The striking feature of this chart is that the Supreme Court ruling did not significantly reduce the level of protection. The invalidated IEEPA tariffs were replaced almost immediately by other measures, first under Section 122 and then under Section 301, and the Section 232 tariffs on steel, aluminium and automobiles, which are among the highest, were unaffected. The legal basis of American tariffs has changed, but their level has remained at about four times its pre-2025 value.
5.2 Revenue and refunds
Figure 2 shows customs revenue.
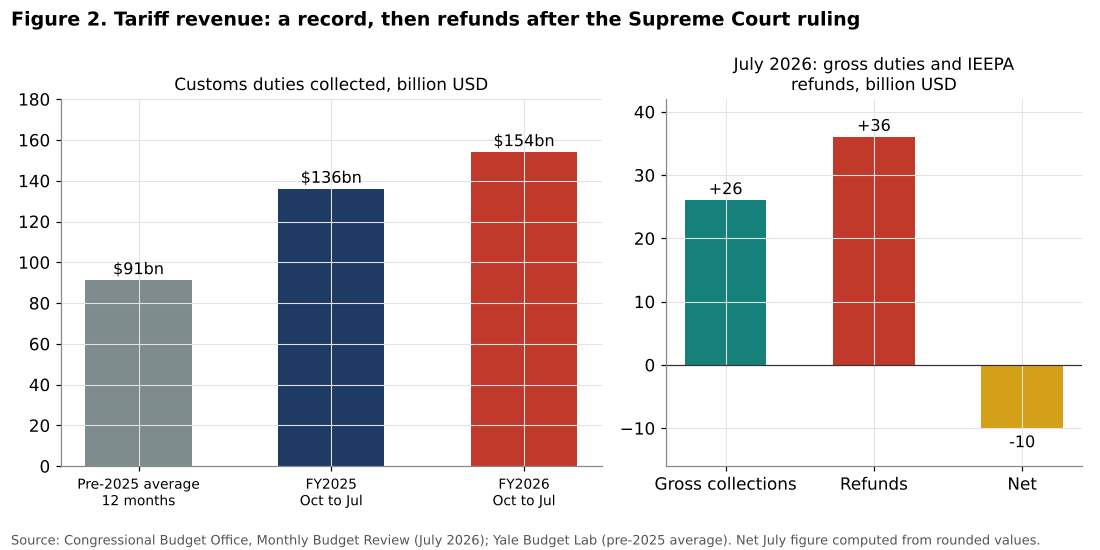
Before 2025, customs duties averaged about 7.6 billion dollars a month, or about 91 billion dollars a year. In the first ten months of fiscal year 2025 (October 2024 to July 2025), they amounted to 136 billion dollars, and in the same period of fiscal year 2026, to 154 billion dollars, according to the CBO. In 2025, tariffs became the fourth largest source of federal revenue, after individual income taxes withheld and not withheld and corporate taxes.
The refunds that followed the Supreme Court ruling have significantly reduced net revenue. In July 2026, refunds of about 36 billion dollars exceeded gross collections of about 26 billion dollars. About 100 billion dollars had been refunded by July, out of an estimated total of about 165 billion dollars. Part of the revenue raised in 2025 is therefore being returned to importers in 2026.
The Yale Budget Lab estimates that current-law tariffs will raise about 1.9 trillion dollars over ten years, somewhat less once their negative effect on GDP is taken into account. This is a significant sum, equivalent to a little over 0.5 percent of GDP a year. From a fiscal point of view, tariffs have become a meaningful source of revenue, although they are an inefficient one compared with broad-based taxes, because they distort the choice between domestic and imported goods.
5.3 Who paid?
Figure 3 shows the evidence on the incidence of tariffs.
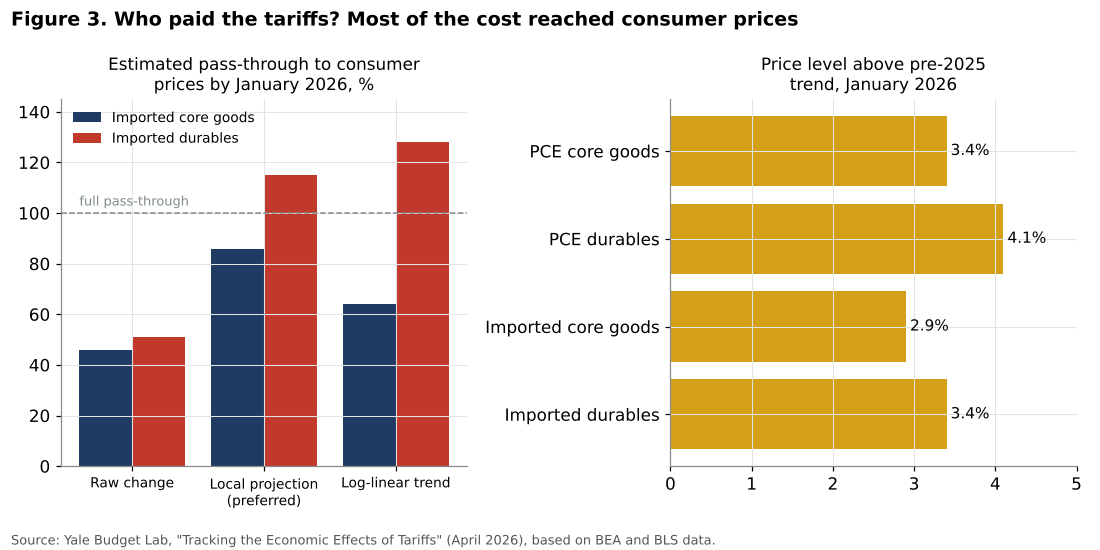
The left panel shows the estimated pass-through of tariffs to consumer prices of imported goods by January 2026, according to three methods used by the Yale Budget Lab. For imported core goods, pass-through was 46 percent with the simplest method, 86 percent with the preferred local projection method and 64 percent with a log-linear trend. For imported durable goods, the estimates were 51, 115 and 128 percent. Estimates above 100 percent suggest that some domestic producers of competing goods also raised their prices, taking advantage of the protection.
The right panel shows the deviation of prices from their pre-2025 trend in January 2026: 3.4 percent for PCE core goods, 4.1 percent for PCE durable goods, 2.9 percent for imported core goods and 3.4 percent for imported durables. In 2025, the PCE price index for core goods rose by 2.3 percent through January 2026, against a decline of 0.1 percent over the same period starting in 2023.
These results confirm the conclusion of the literature on the 2018 and 2019 tariffs: most of the cost of tariffs has been borne by American buyers, not by foreign exporters. Pass-through was slower than at the border, because retailers absorbed part of the cost at first, as Cavallo and co-authors had found for the earlier episode; a study by Cavallo, Llamas and Vazquez (2026), cited by the Yale Budget Lab, estimated retail pass-through of 24 percent in October 2025. But by early 2026, the pass-through had largely taken place.
The good news for inflation is that this is a one-off increase in the price level, not a permanent increase in the inflation rate. As tariffs stabilised and some were removed after the Supreme Court ruling, core goods inflation slowed: it was only 0.7 percent over the year to September 2026 in the CPI. This is consistent with the Fed’s assessment that tariffs are no longer adding to goods price inflation.
5.4 The cost for households
The Yale Budget Lab estimates that current-law tariffs raise the price level by about 0.7 percent in the long run, which represents a cost of about 1,100 dollars per household per year. Multiplying this figure by about 132 million households gives an aggregate cost of about 145 billion dollars a year.
This cost is not evenly distributed. Lower-income households spend a larger share of their income on goods, especially imported goods such as clothing, footwear, household appliances and electronics, which carry relatively high tariffs. The cost of tariffs as a share of income is therefore higher for lower-income households, which makes tariffs a regressive tax. This point is developed in the next article in this series on the two-speed American economy.
5.5 Manufacturing output
Figure 4 shows the evolution of manufacturing output.
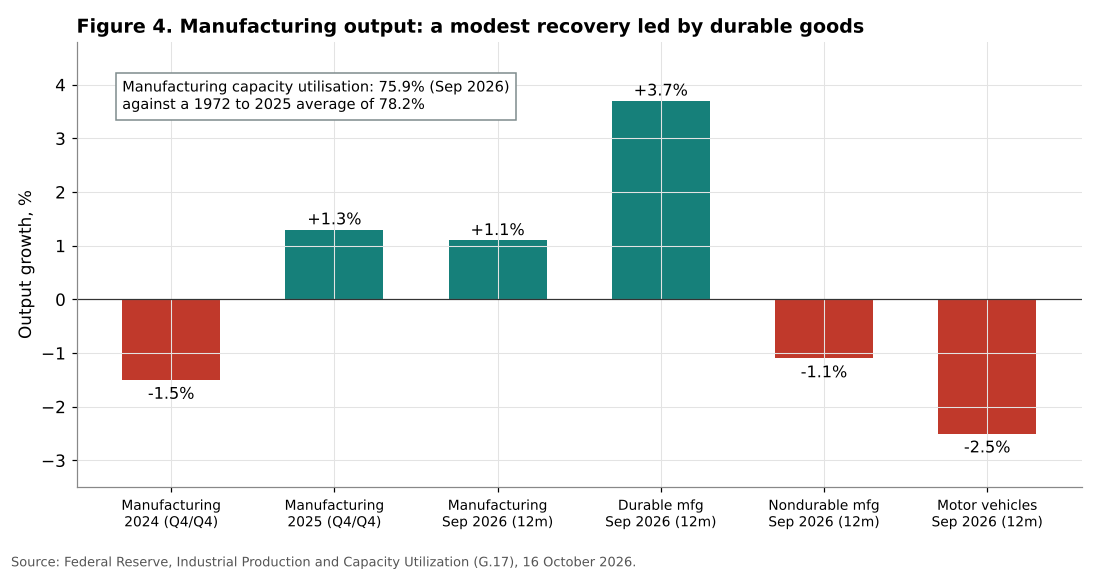
Manufacturing output, as measured by the Federal Reserve’s industrial production index, fell by 1.5 percent in 2024 (fourth quarter to fourth quarter), then rose by 1.3 percent in 2025. Over the twelve months to September 2026, it rose by 1.1 percent. The recovery has been led by durable goods, whose output rose by 3.7 percent over the year to September 2026, while nondurable goods output fell by 1.1 percent and motor vehicle output fell by 2.5 percent.
Manufacturing capacity utilisation was 75.9 percent in September 2026, below its 1972 to 2025 average of 78.2 percent. Manufacturing capacity rose by about 1.0 percent over the year. These figures show a modest recovery, not a manufacturing renaissance. Part of the growth in durable goods is linked to the investment boom in data centres and electrical equipment, examined in the previous article in this series, rather than to tariffs. The Yale Budget Lab cautioned that the 2.2 percent increase in manufacturing output in 2025 through February 2026 may reflect mean reversion after the decline of 2024.
The decline in motor vehicle output is notable because automobiles are among the products most heavily protected by Section 232 tariffs. The automobile industry depends heavily on imported parts and on integrated supply chains with Canada and Mexico, so that tariffs raise its costs as much as they protect it.
5.6 Manufacturing employment
Employment is the measure of manufacturing success most often cited in political debate. According to the BLS data summarised by the Cato Institute, manufacturing lost about 105,000 jobs in 2024 and about 70,000 in 2025, with net losses in each of the last eight months of 2025. The ISM manufacturing index was in contraction for ten consecutive months to December 2025. Since its low point in December 2025, manufacturing employment has recovered by about 72,000 jobs, according to the BLS Employment Situation for September 2026, with gains of 20,000 in July, 15,000 in August and 9,000 in September. The ISM employment index was 52.7 in September 2026, indicating expansion. Manufacturing job openings were 522,000 in August 2026, 26 percent more than a year earlier.
Taken together, these figures suggest that manufacturing employment in September 2026 was roughly back to its level of late 2024. The tariffs have not produced a significant net increase in manufacturing jobs so far, although the recent recovery is a positive sign. This result is consistent with the findings of Flaaen and Pierce (2019) on the 2018 and 2019 tariffs: gains in protected industries are offset by losses in industries that use protected inputs.
5.7 The case of steel
Figure 5 examines steel, the industry that has received the most protection, with a tariff of 50 percent since June 2025.
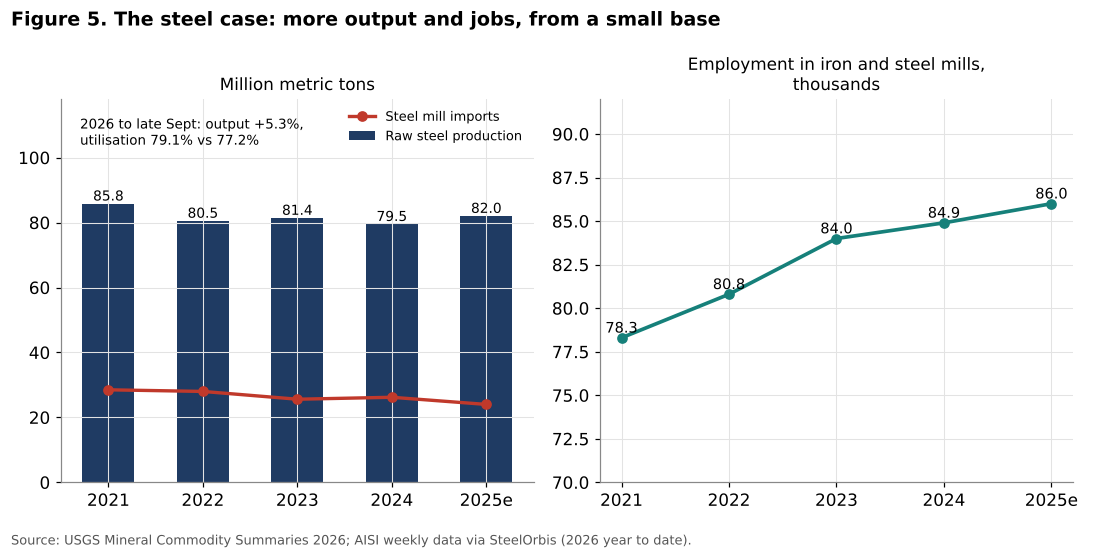
American raw steel production fell from 85.8 million metric tons in 2021 to 79.5 million in 2024, then rose to about 82 million in 2025, according to the USGS. In 2026, production through late September was 5.3 percent higher than in the same period of 2025, with capacity utilisation of 79.1 percent against 77.2 percent. Imports of steel mill products fell from 26.2 million tons in 2024 to about 24 million in 2025, and net import reliance fell from 14 to 13 percent of apparent consumption.
Employment in iron and steel mills rose from 84,900 in 2024 to about 86,000 in 2025, an increase of about 1,100 jobs. Employment has been rising since 2021, so not all of this increase can be attributed to tariffs.
The steel case illustrates both the logic and the limits of protection. The tariffs have succeeded in raising domestic production and capacity utilisation, which supporters see as essential for national security. But the scale of the gain in employment is small: the steel industry employs fewer than 90,000 people in mills, while steel-using industries, such as machinery, automobiles, construction and appliances, employ several million. According to the Cato Institute, machinery, computers and transportation equipment were among the manufacturing sectors with the steepest job losses in 2025. Higher steel prices raise costs for all these industries.
5.8 The trade balance
One of the stated objectives of the tariffs is to reduce the trade deficit. The data for 2026 show a reduction, but its interpretation is complicated. In the first eight months of 2026, the deficit on goods and services was 138.2 billion dollars, or 19.9 percent, lower than in the same period of 2025, as exports rose by 11.8 percent and imports by 4.4 percent. But the 2025 comparison base was inflated by massive front-loading of imports in the first months of 2025, before tariffs took effect: according to the Yale Budget Lab, real imports were 22 percent above trend in March 2025. And in August 2026, the monthly deficit rose to 105.6 billion dollars, partly because of higher imports of semiconductors and crude oil. Most economists consider that the trade balance is determined primarily by macroeconomic factors, such as the gap between national saving and investment, rather than by tariffs.
5.9 A simple balance sheet of protection
Bringing these results together allows a rough balance sheet of the 2025 and 2026 tariffs, with the caveat that each item is measured with considerable uncertainty.
On the cost side, the main item is the increase in prices paid by households and firms. Using the Yale Budget Lab estimate of about 1,100 dollars per household per year, the aggregate cost is about 145 billion dollars a year. To this must be added costs that are harder to quantify: the higher input costs of user industries, the effect of uncertainty on investment, the administrative costs of compliance, and the losses of exporters facing retaliation.
On the gain side, the first item is fiscal revenue, which under current law is about 190 billion dollars a year in the Yale Budget Lab projections. This is not a net gain for the economy as a whole, since it is largely a transfer from domestic buyers to the federal government, but it reduces the deficit and could finance other policies. The second item is the increase in output and employment in protected industries, of which steel is the clearest example: about 1,100 additional jobs in iron and steel mills in 2025, and a 5.3 percent increase in raw steel output in 2026 to late September. The third item, which supporters of tariffs emphasise, is strategic: greater domestic capacity in industries considered critical, and greater bargaining power in trade negotiations.
The comparison shows why the debate is difficult to settle with economic data alone. If tariffs are judged as a tax, they raise substantial revenue at a significant cost in efficiency and with a regressive distribution. If they are judged as a jobs programme, the evidence so far shows a very high cost per job. If they are judged as a national security instrument, their value depends on an assessment of strategic risks that economics cannot provide by itself, and the relevant comparison is with alternative instruments such as subsidies, stockpiles or alliances with trusted suppliers.
6. Discussion
6.1 Narrow gains, broad costs
The central conclusion of this analysis is that the gains of protection have been real but narrow, while its costs have been broad. The gains are concentrated in protected industries, such as steel, where production and capacity utilisation have risen. The costs are spread across all consumers, through a higher price level, and across user industries, through higher input costs.
This asymmetry is the main reason why economists have generally been sceptical of tariffs as a tool for industrial development. A cost of about 145 billion dollars a year for consumers, set against a net change in manufacturing employment close to zero since the end of 2024, implies that the cost per manufacturing job created is very high, in line with the findings of earlier studies.
6.2 The arguments for protection
The arguments for tariffs deserve to be taken seriously, however, because they are not only economic. Supporters argue that a country that cannot produce its own steel, semiconductors or pharmaceuticals is vulnerable in a crisis, a concern that the supply disruptions of the pandemic and the energy shock of 2026 have made more concrete. They argue that the costs of protection should be compared not with a hypothetical world of free trade but with the costs of strategic dependence. They also argue that the China shock caused lasting damage to American communities that the gains from trade did not compensate in practice.
From this perspective, the relevant question is not whether tariffs raise consumer prices, which they clearly do, but whether the protection of strategic capacity is worth the price, and whether tariffs are the best instrument to achieve it. The literature on industrial policy suggests that targeted subsidies and public investment, as in the CHIPS and Science Act, may achieve the same strategic objectives at a lower cost to consumers, because they do not raise the prices of all imported goods.
6.3 Uncertainty and investment
An important cost of tariffs is uncertainty. The frequent changes in tariff rates in 2025, the legal uncertainty before the Supreme Court ruling, the replacement of IEEPA tariffs by Section 122 and then Section 301 tariffs, and the uncertainty about refunds have made it difficult for firms to plan investments. Trade policy uncertainty reached record levels in 2025. Manufacturers that might relocate production to the United States need confidence that the protection will last; manufacturers that depend on imported inputs need confidence about their costs. Uncertainty discourages both.
6.4 Interaction with monetary policy
Tariffs raised the price level in 2025 and early 2026 at a time when inflation was already above target. The Federal Reserve chose to treat the tariff effect as a one-off increase in the price level and paused its rate cuts for most of 2025. In 2026, the energy shock replaced tariffs as the main source of inflation. The fact that core goods inflation has slowed to 0.7 percent suggests that the Fed was right to look through the tariff effect, but the combination of tariffs and energy prices has kept inflation above 2 percent for longer, contributing to the Fed’s decision to raise rates in September 2026.
6.5 International dimension
Tariffs also affect trading partners and the international trading system. Canada and Mexico, whose economies are closely integrated with the United States, have been particularly affected, as discussed in a later article in this series on Canada’s dependence on the American market. The use of national security justifications under Section 232 and of unfair trade practice investigations under Section 301 has raised concerns about the consistency of American tariffs with the rules of the World Trade Organization, and has encouraged other countries to adopt similar measures.
7. Scenarios
7.1 Three tariff paths
Figure 6 presents three illustrative tariff paths and their effects on household costs and revenue.
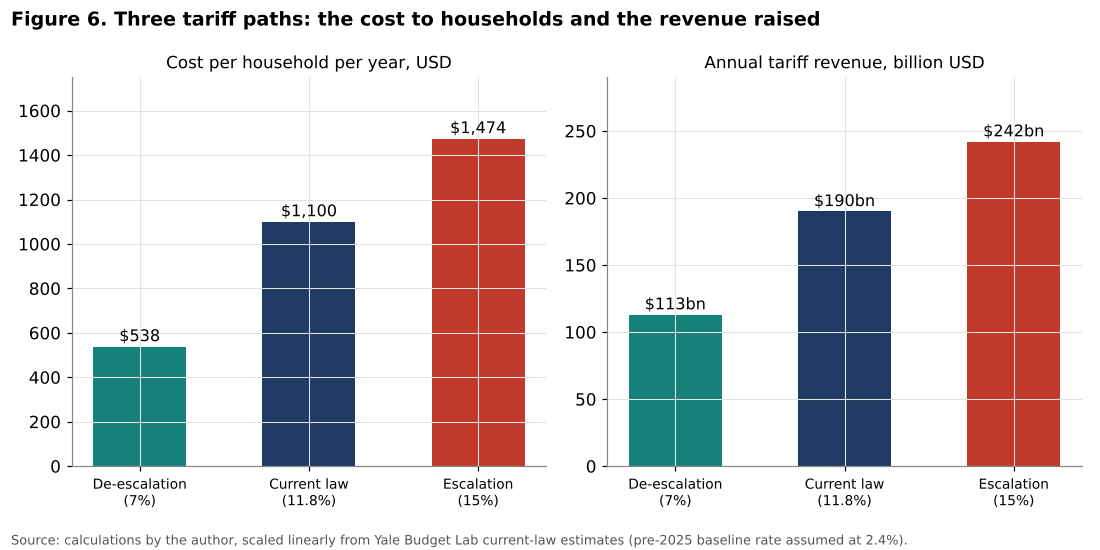
De-escalation. Negotiated agreements with major partners and the expiry or reduction of some tariffs bring the average rate down to about 7 percent. The cost per household falls to about 540 dollars a year, the long-run price level effect to about 0.34 percent, and annual revenue to about 113 billion dollars.
Current law. The average rate reaches 11.8 percent at the end of 2026 and remains there. The cost per household is about 1,100 dollars a year, the price level effect about 0.7 percent, and revenue about 190 billion dollars a year.
Escalation. New tariffs, for example on semiconductors, pharmaceuticals or additional countries, raise the average rate to about 15 percent. The cost per household rises to about 1,470 dollars a year, the price level effect to about 0.94 percent, and revenue to about 240 billion dollars a year, although in practice revenue would probably be lower because imports would fall more.
7.2 Interpretation
The scenarios illustrate the basic trade-off. Each percentage point of average tariff rate costs the average household about 117 dollars a year and raises about 16 billion dollars of revenue. The revenue is a transfer from consumers to the government, but the cost to consumers is larger than the revenue, because consumers also pay higher prices for domestic goods that compete with imports, and because tariffs reduce efficiency.
None of the scenarios produces a large change in manufacturing employment in the short term. Manufacturing employment depends much more on demand, productivity, technology and the exchange rate than on tariffs. Over the longer term, sustained protection could encourage some investment in domestic capacity in specific industries, but the evidence so far suggests that this effect is modest.
7.3 Indicators to monitor
The author suggests monitoring:
1. the average effective tariff rate and changes in legal authorities (Sections 232, 301 and 122); 2. core goods prices in the CPI and PCE indexes; 3. manufacturing output and employment, distinguishing protected industries from user industries; 4. customs revenue net of refunds; 5. manufacturing construction spending and announced investment projects in protected sectors.
8. Conclusion
This article has evaluated the trade-off between the industrial gains and the consumer costs of American tariffs in 2025 and 2026. The main conclusions are:
1. The average tariff rate has risen from about 2.5 percent before 2025 to about 11 percent in 2026, and the Supreme Court ruling of February 2026 changed the legal basis of the tariffs but not their level. 2. Most of the cost of tariffs has been passed on to American buyers: pass-through estimates for imported core goods ranged from 46 to 86 percent by January 2026, and core goods prices were about 3.4 percent above their pre-2025 trend. 3. The current-law tariff regime costs the average household about 1,100 dollars a year, or about 145 billion dollars in total, and the burden falls disproportionately on lower-income households. 4. Manufacturing output has recovered modestly, by about 1.1 to 1.3 percent a year, led by durable goods, but capacity utilisation remains below its historical average and motor vehicle output has fallen. 5. Manufacturing employment fell by about 70,000 in 2025 and has recovered by about 72,000 since December 2025, leaving it close to its late 2024 level. 6. The protected steel industry has increased production and employment, but the number of jobs involved is small relative to the industries that use steel.
The industrial gains of the tariffs are therefore real but narrow and slow, while their costs are broad and immediate. Whether this balance is acceptable depends on the objectives assigned to trade policy. If the objective is to strengthen strategic production capacity, tariffs have had some success in specific industries, although targeted subsidies might achieve the same goal at lower cost. If the objective is to bring back manufacturing employment on a large scale, the evidence so far does not support the view that tariffs can achieve it. And if the objective is to raise revenue, tariffs are an effective but regressive and distortionary source of income for the federal government.
Need this analysis for your organisation?
We prepare confidential briefings, executive talks and studies on countries, markets and policies, built on the same method as this article.
Request a briefingSupport independent analysis
Our studies are free to read and carry no advertising. If this one was useful, a small contribution helps us publish the next.
Support our workGo further: books by Global Strategy Files


The political forecast published five months before the 2024 US election
Get the bookFrequently asked questions
How high are US tariffs in 2026?
The average US tariff rate was about 11 percent in August 2026, according to the Yale Budget Lab, against about 2.5 percent before 2025. After the Supreme Court ruling of February 2026, tariffs were rebuilt under Sections 122 and 301, while Section 232 duties remained.
Who pays for US tariffs?
Mostly American consumers and user industries. By January 2026, estimates of pass-through to the prices of imported core goods ranged from 46 to 86 percent, and the current regime costs the average household about 1,100 dollars a year, or about 145 billion dollars in total.
Have tariffs revived US manufacturing?
Only modestly. Manufacturing output has recovered by about 1.1 to 1.3 percent a year, led by durable goods, and steel production increased, but manufacturing employment fell by about 70,000 in 2025 and has recovered only about 72,000 jobs since December 2025.
Did the Supreme Court strike down Trump’s tariffs?
In February 2026 the Supreme Court ruled that the International Emergency Economic Powers Act did not authorise the President to impose tariffs, invalidating much of the 2025 measures. They were replaced by a temporary global tariff under Section 122, then by Section 301 tariffs from July 2026.
Methodological note
All calculations and figures were prepared by the author from the sources cited. Tariff rates, pass-through estimates and household cost estimates are from the Yale Budget Lab. Customs receipts and refunds are from CBO Monthly Budget Reviews. Industrial production data are from the Federal Reserve’s G.17 release of 16 October 2026. Steel data are from the USGS Mineral Commodity Summaries 2026 and AISI weekly statistics. The aggregate household cost and the scenarios are author calculations based on linear scaling of published estimates and should be read as orders of magnitude.
References
Amiti, M., Redding, S. J. and Weinstein, D. E. (2019). The Impact of the 2018 Tariffs on Prices and Welfare. Journal of Economic Perspectives, 33(4), 187 to 210.
Autor, D. H., Dorn, D. and Hanson, G. H. (2013). The China Syndrome: Local Labor Market Effects of Import Competition in the United States. American Economic Review, 103(6), 2121 to 2168.
Bureau of Economic Analysis and Census Bureau (2026). U.S. International Trade in Goods and Services, August 2026. News release, October 2026.
Cavallo, A., Gopinath, G., Neiman, B. and Tang, J. (2021). Tariff Pass-Through at the Border and at the Store: Evidence from US Trade Policy. American Economic Review: Insights, 3(1), 19 to 34.
Congressional Budget Office (2026). Monthly Budget Review: July 2026. Washington, DC.
Fajgelbaum, P. D., Goldberg, P. K., Kennedy, P. J. and Khandelwal, A. K. (2020). The Return to Protectionism. Quarterly Journal of Economics, 135(1), 1 to 55.
Federal Reserve Board (2026). Industrial Production and Capacity Utilization, G.17. Release of 16 October 2026.
Flaaen, A. and Pierce, J. R. (2019). Disentangling the Effects of the 2018 to 2019 Tariffs on a Globally Connected U.S. Manufacturing Sector. Finance and Economics Discussion Series 2019-086. Board of Governors of the Federal Reserve System.
Hufbauer, G. C. and Lowry, S. (2012). US Tire Tariffs: Saving Few Jobs at High Cost. Peterson Institute for International Economics, Policy Brief 12-9.
Jefferson, P. N. (2026). The U.S. Economy and Monetary Policy. Speech at the Darden School of Business, University of Virginia, 1 October 2026.
Juhász, R., Lane, N. and Rodrik, D. (2024). The New Economics of Industrial Policy. Annual Review of Economics, 16, 213 to 242.
Lighthizer, R. E. (2023). No Trade Is Free: Changing Course, Taking on China, and Helping America’s Workers. Broadside Books.
Supreme Court of the United States (2026). Learning Resources, Inc. v. Trump. Decided 20 February 2026.
US Geological Survey (2026). Mineral Commodity Summaries 2026: Iron and Steel. Reston, VA.
Yale Budget Lab (2026). Tracking the Economic Effects of Tariffs. April 2026.
Yale Budget Lab (2026). The State of U.S. Tariffs. Updates of July and August 2026.
