
China’s Property Contraction in 2026: Measuring a Five-Year Adjustment and Its Macroeconomic Cost

China’s Property Contraction in 2026: Measuring a Five-Year Adjustment and Its Macroeconomic Cost
Driss EFFINA, PhD Independent Researcher, Global Strategy Files Reading time: about 26 minutes
Key takeaways
- By 2026 new construction starts in China are running at about 22 percent of their 2021 level, the deepest fall of any property indicator.
- Sales revenue collapsed mainly through volume: the average price per square metre is only about 6 percent below its 2021 level.
- Floor space under construction equals about seven and a quarter years of current sales, against about five and a half years in 2021.
- Property development investment fell from about 12.8 percent of GDP in 2021 to an estimated 4.5 percent in 2026.
Abstract
This article measures the scale, composition and macroeconomic cost of the contraction of China’s real estate sector between the 2021 peak and the first eight months of 2026. It relies exclusively on official releases of the National Bureau of Statistics of China (NBS) and on calculations carried out by the author: rebased indices, a log decomposition of sales revenue into volume and price effects, pipeline and inventory ratios, a funding structure analysis, an estimate of the direct contribution of property investment to GDP, and a simple model of underlying urban housing demand used to frame scenarios to 2030. Five results stand out. First, by 2026 new construction starts are running at roughly 22 percent of their 2021 level, the deepest fall of any indicator, while sales, investment and completions have each fallen to between 40 and 45 percent of the peak. Second, the collapse of sales revenue has been driven overwhelmingly by volume rather than by the average price per square metre, which is only about 6 percent below its 2021 level in the national aggregate. Third, the stock of floor space under construction equals about seven and a quarter years of current sales, against about five and a half years in 2021, which means the industry is still carrying a pipeline that demand cannot absorb. Fourth, the funding squeeze has changed in nature: in 2026 domestic bank loans to developers are falling faster than any other source of funds, at 33.3 percent year on year. Fifth, property development investment has shrunk from about 12.8 percent of GDP in 2021 to an estimated 4.5 percent in 2026, and its direct drag on growth is still above one percentage point of GDP per year. The article concludes that the contraction is entering a late phase in which the main risk is no longer the speed of decline but the length of the period during which the sector stays below its long-run equilibrium.
Keywords: China, real estate, housing starts, property investment, developer funding, house prices, deleveraging, economic growth, scenarios
JEL codes: E22, E32, R21, R31, O53
1. Introduction
For two decades, real estate was the single largest engine of Chinese economic growth. It absorbed household savings, financed local governments through land sales, sustained steel, cement, glass and appliance industries, and gave tens of millions of rural migrants a reason to move to cities. In the years leading up to 2021, China was starting construction on more than two billion square metres of commercial floor space every year, an amount without precedent in economic history. The reversal that began in the second half of 2021, when the authorities imposed balance sheet limits on developers known as the “three red lines”, has since become the longest and deepest real estate adjustment of any major economy in the post-war period.
The purpose of this article is not to repeat the general narrative of the property crisis, which has been told many times. It is to measure it. Commentary on Chinese real estate often moves from one monthly figure to the next without placing them in a consistent framework, and it frequently mixes indicators that do not measure the same thing: prices with volumes, sales with starts, nominal with real values, completed homes with homes still being built. This makes it difficult to answer simple questions. How far has the sector actually fallen? Is the adjustment mainly about prices or about quantities? How much construction is still in the pipeline? Is the decline slowing or accelerating? What does it cost the economy each year, and where might it stop?
To answer these questions, the article builds a small set of indicators from official NBS data covering 2019 to August 2026. All the derived figures, ratios and charts are the author’s own calculations, and the method is explained so that the reader can reproduce them. The analysis focuses on the national aggregate for commercial buildings and residential buildings, supplemented by the NBS seventy-city price survey.
The article is organised as follows. Section 2 sets out the context of the adjustment and the policy response. Section 3 reviews the academic and institutional literature on the Chinese housing market. Section 4 describes the data and the methodology. Section 5 presents the results in six parts. Section 6 discusses their interpretation and their implications for growth, finance and policy. Section 7 presents three scenarios for residential sales to 2030. Section 8 concludes.
2. Context
2.1 The boom and its financing model
The Chinese housing boom rested on three pillars. The first was demand: urbanisation brought roughly 20 million people into cities each year during the 2000s and much of the 2010s, while rising incomes increased the space each urban household wanted. The second was the presale system, under which developers sell apartments before they are built and use the deposits and mortgage proceeds of buyers to finance construction. The third was the fiscal role of land: local governments, which own urban land, financed a large share of their spending by selling land use rights to developers.
This model generated extraordinary growth in construction, but it also built in a structural dependence on continuous expansion. A developer financed by presales needs new sales to complete old projects. A local government financed by land sales needs developers to keep buying land. A household that buys a home before it is built needs confidence that the developer will survive long enough to deliver it. When one link weakens, the others weaken too.
2.2 The turn of 2021
In August 2020 the authorities introduced the “three red lines” policy, which limited the growth of debt of developers that breached thresholds for the ratio of liabilities to assets, net gearing and the ratio of cash to short-term debt. At the same time, banks were made subject to limits on the share of their loan books going to property developers and to mortgages. The aim was to reduce financial risk in a sector that had become highly leveraged.
The policy worked in the sense that it stopped the accumulation of developer debt, but it also exposed the fragility of the presale model. Several large developers, starting with Evergrande in 2021 and then Country Garden in 2023, defaulted on their obligations. Unfinished projects multiplied. Households, worried about paying for apartments that might never be delivered, began to avoid new homes. Sales fell, which reduced the cash flow of developers, which in turn led to more unfinished projects. The adjustment became self-reinforcing.
2.3 The policy response
From 2022 onward, the authorities gradually reversed course. Mortgage rates and minimum down payments were reduced, purchase restrictions in most cities were lifted, a “white list” mechanism was created to channel bank loans to viable projects, and local governments were encouraged to buy unsold homes and convert them into affordable housing. In 2024 the central bank announced a relending facility for the purchase of housing inventory. In 2026 the government added a mortgage interest subsidy of one percentage point for first-time buyers, applicable from 1 October 2026 for up to five years.
These measures have stabilised specific segments, especially the delivery of presold units, but as the results below show, they have not reversed the national trend. The contraction continued in 2025 and accelerated on several measures in 2026.
2.4 The structural backdrop
Two long-term forces make the current adjustment different from a cyclical downturn. China’s population has been declining since 2022, and the cohort aged 25 to 39, which accounts for most first home purchases, is shrinking faster than the population as a whole. Meanwhile, urbanisation has reached about two thirds of the population, which means that future increases in the urban population will be smaller than in the past. The demand that justified two billion square metres of starts a year no longer exists, and the question is not whether the sector must shrink but how far and how fast.
3. Literature review
The academic literature on the Chinese housing market can be grouped into four strands.
The first strand explains the boom. Fang, Gu, Xiong and Zhou (2016), using a large database of mortgage loans, show that house prices in Chinese cities grew very rapidly between 2003 and 2013, especially in second and third tier cities, but that this was largely matched by income growth, so that buyers in the major cities were betting on continued rapid income growth. Glaeser, Huang, Ma and Shleifer (2017) argue that the Chinese boom had specific features: very high levels of construction, high vacancy rates and prices that were high relative to construction costs. They warned that if growth slowed, the value of the housing stock could fall sharply. Chivakul and co-authors at the IMF (2015) analysed the dispersion of the market across cities and the risk of overbuilding in smaller cities.
The second strand measures the macroeconomic weight of the sector. Rogoff and Yang (2021) estimate that real estate and related activities, taking into account input-output linkages, accounted for about 29 percent of Chinese GDP before the downturn, a share much higher than in the United States or Spain before their respective crises. In a later paper, Rogoff and Yang (2022) argue that China’s housing production probably peaked around 2021 and that a sustained decline in real estate activity could reduce GDP growth by several percentage points over several years.
The third strand deals with the link between real estate and local public finance. Liu and Xiong (2020) describe how land sales and local government financing vehicles created a loop between land prices, infrastructure investment and local debt. A drop in land sales therefore has direct consequences for local government budgets, a theme the next article in this series examines in detail.
The fourth strand is institutional and policy oriented. The IMF Article IV reports on China have repeatedly recommended a faster and more decisive restructuring of non-viable developers, central government financing to complete unfinished housing, and greater flexibility of prices to clear the market. The World Bank’s China Economic Updates have focused on the effects of the contraction on investment and household confidence.
This literature leaves a gap that the present article tries to fill. Most studies were written either before the downturn or in its early stages. Few measure the full five years of adjustment with a consistent set of indicators, and few separate the volume and price components of the decline, which matter a great deal for the interpretation of household wealth effects and for the design of policy.
4. Data and methodology
4.1 Sources
All primary data come from the National Bureau of Statistics of China:
- the annual releases on investment in real estate development for 2019 to 2025;
- the release for January to August 2026, published in September 2026;
- the monthly releases on sales prices of residential buildings in 70 large and medium-sized cities, up to August 2026;
- the national accounts for nominal GDP.
The indicators used are investment in real estate development, floor space started, floor space under construction, floor space completed, floor space sold, value of sales, floor space for sale (inventory) and funds available to developers by source.
4.2 Comparability
NBS releases its growth rates on a comparable basis, which means that the published growth rate for a given year is not always equal to the change between the published levels of two consecutive years, because the sample of enterprises and some statistical corrections change. In this article, levels are taken as published and indices are computed from levels. Where the computed change between two levels differs slightly from the official growth rate, the official growth rate is mentioned in the text. These differences do not affect the conclusions.
4.3 Estimating 2026
Since full-year data for 2026 are not yet available, an estimate for 2026 (marked “2026e”) is constructed by applying the year-on-year growth rate observed for January to August 2026 to the full-year 2025 level. This assumes that the last four months of 2026 follow the same trend as the first eight. Given that the base for the end of 2025 was itself weak, this is a reasonable central assumption. For floor space under construction, which is a stock at a point in time, the August 2026 level is used directly.
4.4 Derived indicators
The following indicators are computed by the author:
1. Index relative to the peak. Each series is rebased to 2021 = 100, which is the year of peak or near peak activity for most indicators. 2. Volume and price decomposition. The log change of sales value is split into the log change of floor space sold (volume effect) and the residual, which is the log change of the average value per square metre (price effect). The average value per square metre is a unit value, which includes composition effects between cities, types of buildings and quality. 3. Pipeline ratio. Floor space under construction divided by annual floor space sold, expressed in years. This measures how many years of sales at the current pace would be needed to absorb the construction already under way. 4. Starts to sales ratio. New starts divided by floor space sold. A ratio above 1 means that the industry is adding to its future supply faster than it sells; a ratio below 1 means it is shrinking its pipeline. 5. Inventory in months. Floor space for sale (completed but unsold) divided by average monthly sales. 6. Presale funding share. Deposits and advance receipts plus individual mortgages as a share of total funds available to developers. 7. Share of GDP and direct drag. Real estate development investment as a percentage of nominal GDP, and the change in investment divided by previous year GDP, which gives the direct arithmetic contribution to nominal GDP growth. 8. Underlying demand. A simple model of new urban housing demand, set out in Section 7.
4.5 Limitations
Real estate development investment includes land purchase costs, which are not part of GDP in the national accounts. The share of GDP indicator therefore overstates the weight of construction activity proper, and the direct drag should be read as an order of magnitude rather than as an exact contribution. The unit value per square metre is not a quality adjusted price index. The demand model is deliberately simple and its parameters are assumptions, which is why a range is shown rather than a point estimate.
5. Results
5.1 The scale of the contraction
Figure 1 shows the five main activity indicators rebased to 2021 = 100.
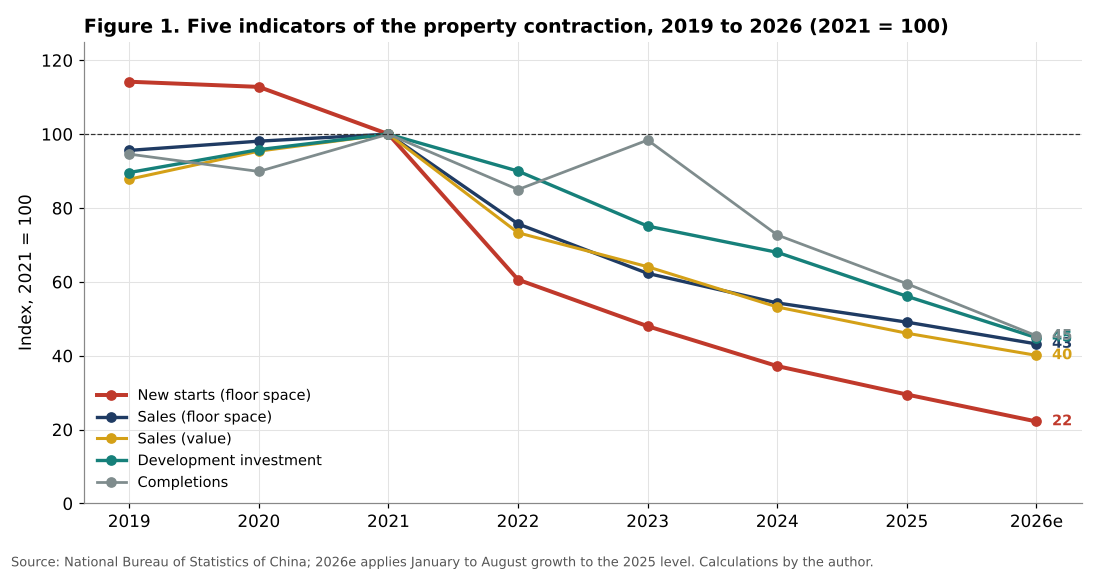
The first result is the depth of the decline. Between 2021 and 2025, floor space started fell by 70.5 percent, from 1,989 million square metres to 588 million. Floor space sold fell by 50.9 percent, from 1,794 million to 881 million. The value of sales fell by 53.9 percent, from 18.2 trillion yuan to 8.4 trillion. Development investment fell by 43.9 percent, from 14.8 trillion yuan to 8.3 trillion. Completions fell by 40.5 percent.
The 2026 data show that the decline did not stop in 2025. In the first eight months of 2026, compared with the same period of 2025:
| Indicator | Jan to Aug 2026 | Year-on-year change |
|---|---|---|
| Development investment | 4,797.9 bn yuan | -19.9% |
| of which residential | 3,701.7 bn yuan | -19.7% |
| Floor space started | 298.9 mn m² | -24.8% |
| Floor space under construction | 5,607.7 mn m² | -12.8% |
| Floor space completed | 211.0 mn m² | -23.7% |
| Floor space sold | 498.8 mn m² | -12.1% |
| Value of sales | 4,747.0 bn yuan | -13.0% |
| Floor space for sale (end August) | 753.5 mn m² | -1.1% |
| Funds available to developers | 5,089.3 bn yuan | -21.0% |
Table 1. Real estate indicators, January to August 2026. Source: NBS.
Applying these growth rates to the 2025 levels gives the 2026 estimates shown in Figure 1. On this basis, by the end of 2026 the main indicators will stand at the following percentages of their 2021 level: new starts 22, sales value 40, floor space sold 43, investment 45, completions 45.
In other words, the Chinese real estate industry is now starting less than a quarter of the floor space it started at the peak. Measured from the 2019 level, which was even higher for starts, the fall is about 80 percent. This is an adjustment of a size comparable to the collapse of housing starts in the United States between 2006 and 2009, which fell by about three quarters, or in Spain after 2007, where they fell by about 90 percent. The difference is that in China the decline has been spread over five years rather than three, and it has not yet reached a clear floor.
A second observation from Figure 1 is the ordering of the indicators. Starts fell first and fastest, followed by sales and investment, while completions held up until 2023. This sequencing is consistent with the presale model. When sales fall, developers stop starting new projects in order to preserve cash. Investment, which includes ongoing construction and land purchases, falls more slowly because projects already under way continue. Completions were supported in 2023 by the policy drive to deliver presold homes, then fell sharply in 2024 and 2025 as the stock of projects started in the boom years was exhausted.
A third observation is that the decline in investment accelerated rather than slowed: -10.6 percent in 2024 on the published comparable basis, -17.2 percent in 2025 and -19.9 percent in the first eight months of 2026. This contradicts the idea, frequently expressed in 2024, that the adjustment was entering a stabilisation phase.
5.2 Volume or price? A decomposition of sales revenue
A central question for interpreting the adjustment is whether it has taken place mainly through prices or through quantities. This matters because household wealth in China is concentrated in housing, so a price adjustment has direct effects on consumption, while a quantity adjustment affects mainly construction, employment and local government revenue.
Figure 2 decomposes the annual change in sales value into a floor space effect and an average price effect.
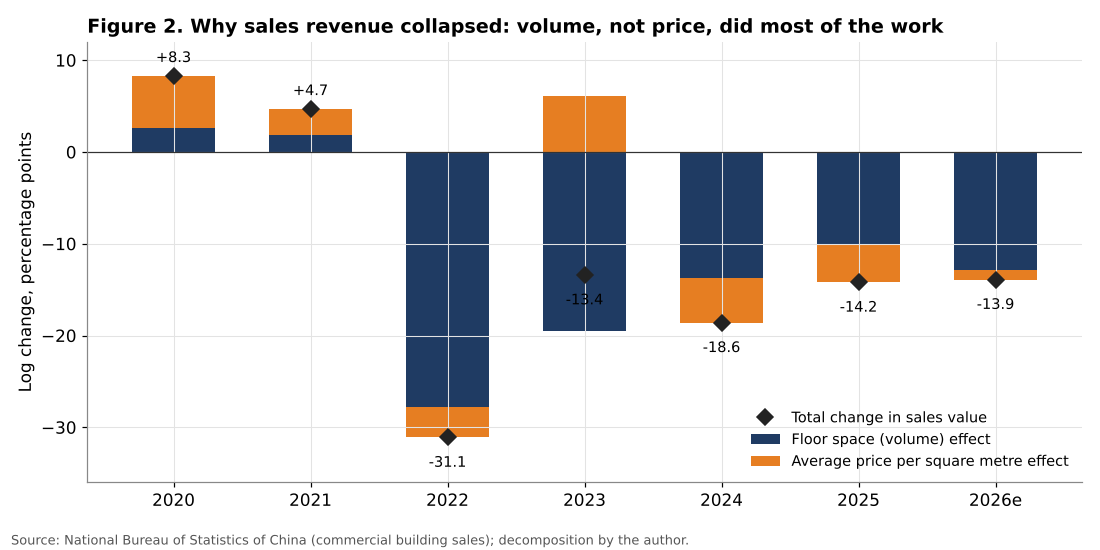
The results are striking. Over 2022 to 2026, the cumulative log decline of sales value is about 91 log points, equivalent to the 60 percent fall in value between 2021 and 2026. Of this, about 84 log points come from the fall in floor space sold and only about 7 log points from the fall in the average value per square metre. In other words, more than nine tenths of the collapse of revenue is explained by volume.
The average value per square metre of commercial buildings sold was 10,137 yuan in 2021. It fell to 9,813 yuan in 2022, rose to 10,435 yuan in 2023, then fell back to 9,935 yuan in 2024, 9,528 yuan in 2025 and about 9,517 yuan in the first eight months of 2026. The cumulative decline from 2021 is only 6.1 percent.
This unit value must be interpreted carefully. It is affected by composition. In 2023 the share of sales in the large first tier cities, where prices are highest, increased because demand held up better there, which raised the national average. More generally, the average is a measure of what buyers paid on average, not of what a given home is worth. A constant quality price index would probably show a larger fall.
The seventy-city survey confirms this. In August 2026, new home prices in the 70 cities were 3.0 percent lower than a year earlier and 0.1 percent lower than in July. This was the 38th consecutive month of year-on-year decline. The pace of the annual decline has slowed slightly in recent months, from -3.5 percent in May to -3.3 percent in June, -3.2 percent in July and -3.0 percent in August. Among the large cities, the picture is mixed:
| City | New home prices, Aug 2026, y/y |
|---|---|
| Shanghai | +3.0% |
| Guangzhou | -1.9% |
| Beijing | -2.3% |
| Shenzhen | -2.3% |
| Chongqing | -3.1% |
| Tianjin | -4.1% |
| 70-city average | -3.0% |
Table 2. New home price changes in selected cities. Source: NBS 70-city survey.
Shanghai is the only major city where new home prices are higher than a year ago. The other first tier cities are below the national average decline, while second and third tier cities generally record larger declines.
Two conclusions can be drawn. First, the official price data show a gradual and moderate decline, much smaller than the fall in volumes. Second, this relative price rigidity is itself part of the problem. In a market where prices do not fall enough to attract buyers, the adjustment takes place through quantities, which means fewer transactions, less construction and a longer adjustment period. Several factors contribute to this rigidity: local governments have at times discouraged developers from cutting list prices; developers prefer to offer hidden discounts rather than cut official prices, which would anger previous buyers; and buyers, anticipating further declines, postpone purchases, which keeps volumes low without forcing prices down quickly.
The secondary market tells a different story. Although this article does not use secondary market data in its calculations, the NBS 70-city survey has consistently shown larger price declines for existing homes than for new homes, and transaction volumes in the existing home market have held up better than new home sales. This suggests that households who do buy increasingly prefer completed homes, which eliminates the risk of non-delivery, over presold units.
5.3 The construction pipeline
Figure 3 shows two indicators of the construction pipeline.
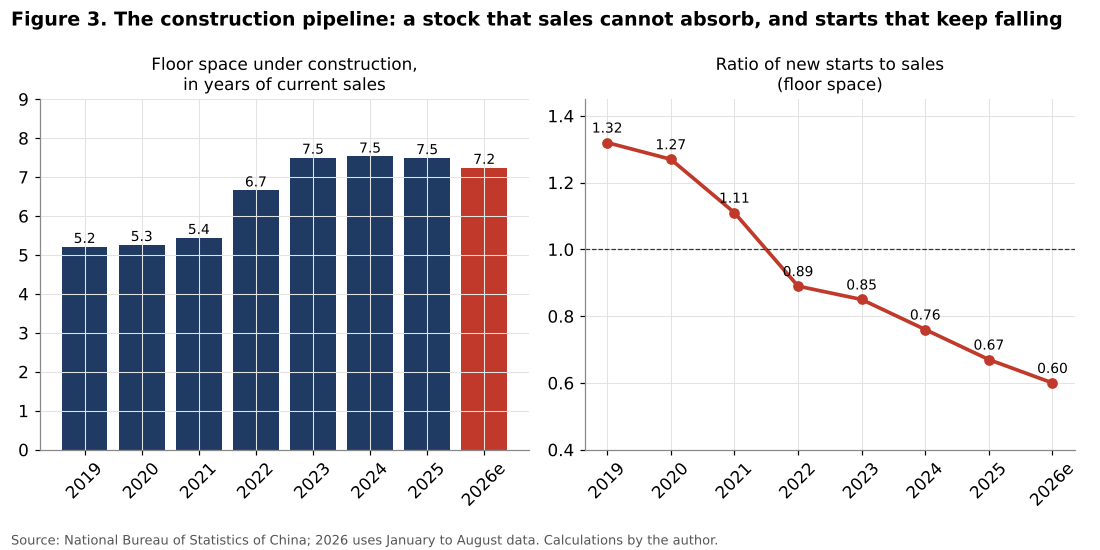
The left panel shows the floor space under construction expressed in years of current sales. In 2019 to 2021, this ratio was between 5.2 and 5.4 years. It then rose to 6.7 years in 2022 and to about 7.5 years in 2023, 2024 and 2025. In 2026 it fell slightly to about 7.2 years. Floor space under construction is a gross measure that includes projects at all stages, including those started many years ago and stalled. Its very high level relative to sales means that a large stock of unfinished or slow-moving projects remains on the books of developers.
This indicator has an important implication. Even if starts were zero, the industry would already have years of work in progress relative to current demand. The fact that the ratio has stopped rising and begun to decline slightly in 2026 suggests that the pipeline is finally being reduced, but only very slowly, and mainly because the stock of projects under construction is falling (by 12.8 percent year on year in August 2026), not because sales are recovering.
The right panel shows the ratio of starts to sales. Before the downturn, this ratio was well above 1: in 2019 the industry started 1.32 square metres for every square metre sold. In 2021 the ratio was 1.11. It fell below 1 in 2022 and has continued to fall each year, reaching 0.67 in 2025 and 0.60 in the first eight months of 2026. The industry now starts only six square metres for every ten it sells.
This is the clearest evidence that the sector is in a phase of active destocking. A ratio below 1 is a necessary condition for the pipeline to shrink. But the fact that it is falling further in 2026, rather than stabilising, indicates that developers are still reducing their commitments, either because they lack funding, or because they do not see sufficient future demand, or both.
The inventory of completed but unsold floor space provides a third angle. At the end of August 2026, floor space for sale was 753.5 million square metres, of which 400.8 million were residential. At the average monthly sales pace of the first eight months, this represents about 12.1 months of sales, against 10.4 months at the end of 2025. The level of inventory is roughly stable, down 1.1 percent year on year, but because sales are falling, the number of months of sales it represents is rising. In other words, the completed inventory is not being absorbed.
These indicators together show that the supply side of the market is still out of balance with demand, and that the excess is concentrated in two places: projects under construction, which include a significant number of stalled sites, and completed unsold homes, which are concentrated in smaller cities.
5.4 The funding structure of developers
Figure 4 compares the change in funds available to developers by source in 2025 and in the first eight months of 2026.
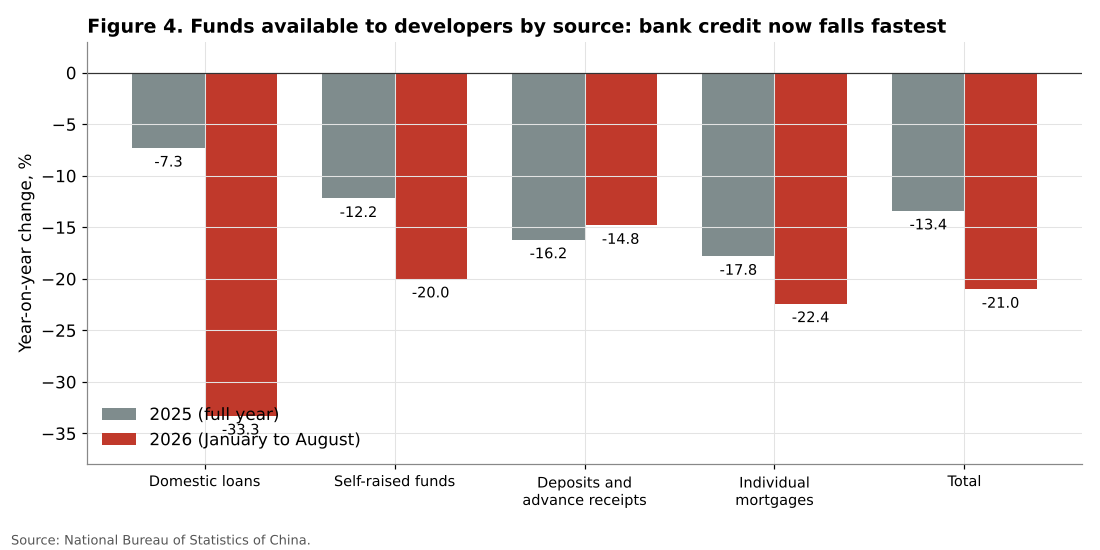
Total funds available to developers fell by 13.4 percent in 2025 and by 21.0 percent in the first eight months of 2026. The structure of the decline has changed significantly between the two periods.
In 2025, the sources that fell most were those linked to sales: deposits and advance receipts (-16.2 percent) and individual mortgages (-17.8 percent). Domestic bank loans fell less (-7.3 percent), which reflects the white list mechanism, under which banks were encouraged to lend to projects judged viable.
In 2026, the ranking reversed. Domestic loans are now the source falling fastest, by 33.3 percent, more than four times the rate of 2025. Individual mortgages fell by 22.4 percent, self-raised funds by 20.0 percent, and deposits and advance receipts by 14.8 percent. In absolute terms, domestic loans to developers amounted to only 688 billion yuan in the first eight months of 2026, against 1,409 billion for the whole of 2025.
There are two possible interpretations, which are not mutually exclusive. The first is that the white list mechanism has reached its limits: the projects that banks considered viable have been financed, and the remaining projects are not considered bankable. The second is that demand for credit from developers is falling, because they are starting fewer new projects. The simultaneous sharp drop in new starts (-24.8 percent) supports the second interpretation, but the size of the drop in loans suggests that supply constraints also play a role.
The share of presale funding, measured as deposits and advance receipts plus individual mortgages in total funds, was 44.0 percent in 2025 and 45.0 percent in the first eight months of 2026. The presale model therefore remains the main source of funding for developers, even after five years of crisis. This is an important finding, because it means that the financial health of the industry still depends primarily on the willingness of households to buy homes that are not yet built. As long as households prefer completed homes, developers will struggle to fund new projects.
5.5 The macroeconomic weight of the adjustment
Figure 5 shows real estate development investment as a share of nominal GDP.
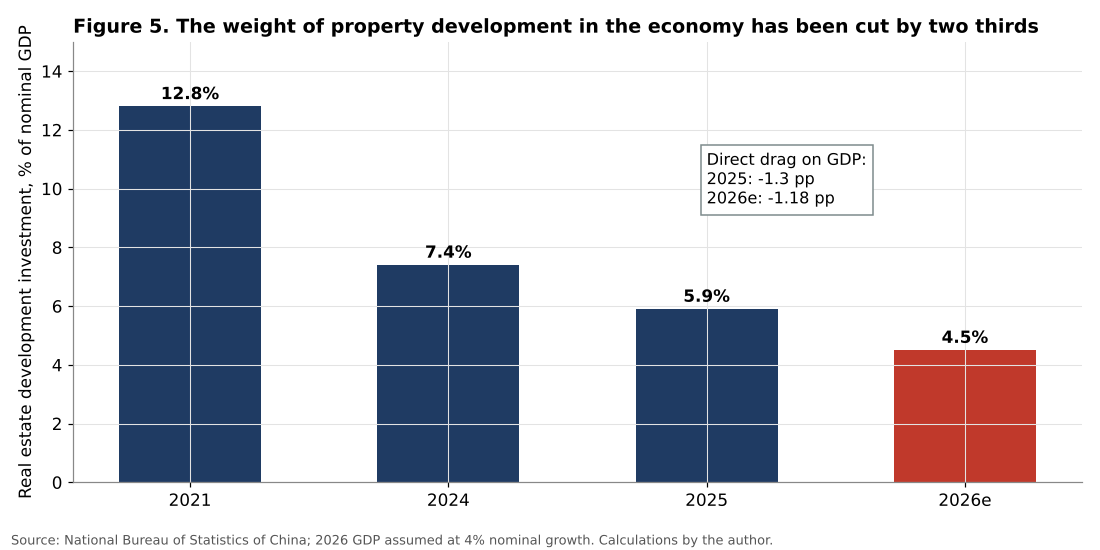
In 2021, real estate development investment amounted to about 14.8 trillion yuan, or 12.8 percent of nominal GDP. By 2024 it had fallen to 7.4 percent, by 2025 to 5.9 percent, and the 2026 estimate is about 4.5 percent, assuming nominal GDP growth of 4 percent in 2026. The weight of property development in the economy has therefore been cut by roughly two thirds in five years.
As noted in the methodology section, development investment includes land purchases, which are not part of GDP. The share of construction activity proper in GDP is therefore lower than these figures suggest. But the order of magnitude of the adjustment is not affected.
The direct drag on GDP is calculated as the change in development investment divided by the previous year’s nominal GDP. It was about -1.3 percentage points in 2025 and is estimated at about -1.2 percentage points in 2026. These are direct effects only. Taking into account the indirect effects on upstream industries (steel, cement, glass, building machinery) and downstream industries (furniture, appliances, decoration), the total effect is significantly larger. Rogoff and Yang (2021) estimate that the sector’s total footprint, including these linkages, is about two and a half times its direct footprint. Applying a multiplier of this order would imply that the total drag of the property sector on nominal GDP growth is still about two to three percentage points per year in 2026.
Retail sales data for related goods confirm the downstream effects. In the first eight months of 2026, retail sales of building and decoration materials fell by 9.8 percent and retail sales of furniture by 4.9 percent year on year. Total fixed asset investment fell by 7.2 percent over the same period, a decline in which real estate played a major role.
The fact that the Chinese economy has continued to grow at rates officially reported between 4 and 5 percent per year despite such a drag means that other sectors, notably manufacturing and exports, have offset a large part of the decline. This is the macroeconomic link with the other articles in this series, which examine China’s export surplus and its efforts to support consumption: the growth model has shifted from property to industrial production and exports, with the trade tensions that this implies.
5.6 The depth of the adjustment compared with the peak in starts
To put the scale of the decline in starts into perspective, it is useful to compare starts with completions. In a stable market, starts and completions should be broadly equal over a period of several years. During the boom, starts were much higher than completions: in 2019, 2,272 million square metres were started and 959 million completed, a ratio of 2.4. This gap was the source of the accumulation of the pipeline.
By 2025, starts (588 million square metres) were slightly below completions (603 million), and in the first eight months of 2026 starts (299 million) are again above completions (211 million), but both are much lower. The convergence of the two series at a low level means that the pipeline is no longer growing, but the stock accumulated during the boom has not yet been absorbed.
5.7 Residential and non-residential
Residential buildings account for about three quarters of development investment and about four fifths of the floor space sold. In the first eight months of 2026, residential investment fell by 19.7 percent, close to the total. Residential starts fell by 25.4 percent, slightly more than total starts. Residential sales value fell by 13.1 percent.
The non-residential segment, which includes offices and commercial premises, has been in an even more difficult situation for several years, with very high vacancy rates in offices in the major cities and a stock of commercial premises that exceeds demand in most cities. This segment is not the focus of this article, but it adds to the burden of developers and of the banks that lend to them.
6. Discussion
6.1 A quantity adjustment with sticky prices
The main finding of this analysis is that the adjustment has been overwhelmingly a quantity adjustment. Volumes have fallen by more than half, while official prices have fallen by only a few percent per year. This differs from the experience of the United States after 2006, where house prices fell by about a third at the national level over five years, and from Japan after 1991, where land prices fell by more than half over a decade.
A quantity adjustment has advantages and disadvantages. Its main advantage is that it limits the direct loss of household wealth and therefore the immediate shock to consumption and bank balance sheets. Households who own homes have not seen their wealth wiped out on paper, and banks have not faced a wave of mortgages exceeding the value of the homes that secure them.
Its main disadvantage is that it prolongs the adjustment. When prices do not fall enough to clear the market, buyers wait, sales remain low, inventory is not absorbed, and developers cannot fund new projects. The adjustment then takes the form of a long period of low activity rather than a short period of falling prices followed by a recovery. The data for 2026, which show a further fall in sales despite five years of decline, are consistent with this pattern.
There is also a question about the reliability of the price signal. If official prices understate the real decline, because of hidden discounts or composition effects, households who observe actual transaction prices may conclude that the market has not yet reached its floor and continue to postpone purchases. A more transparent price adjustment could, paradoxically, accelerate the return of buyers.
6.2 The funding trap
The analysis of funding shows that the presale model remains at the heart of developer financing. This creates a trap. Households are reluctant to buy presold homes because they fear non-delivery. Developers cannot fund new projects without presales. Banks are reluctant to lend to developers without presales. The result is that new starts continue to fall, even where underlying demand exists.
The policy implication is that restoring household confidence in the delivery of presold homes is a precondition for stabilisation. The measures already taken, notably the white list and escrow requirements for presale funds, go in this direction. A broader shift toward the sale of completed homes, which some cities have begun to encourage, would reduce the risk to households but would require developers to have access to other sources of funding during construction, which in turn requires a healthier banking relationship. The sharp drop in bank loans in 2026 shows that this transition has not yet happened.
6.3 The fiscal channel
The contraction of real estate has a direct impact on local public finances through land sales. Although this article does not analyse land sale revenue in detail, the fall in starts implies a corresponding fall in land purchases by developers. Local governments, which relied on these revenues to finance infrastructure and to service the debt of local government financing vehicles, have lost a major source of income. This is examined in the next article in this series, on local government debt and infrastructure.
6.4 The household channel
For households, the adjustment has three effects. First, a wealth effect: even moderate price declines, applied to a stock of housing that represents most of household wealth, reduce perceived wealth and encourage saving. Second, a confidence effect: the experience of unfinished projects and defaulting developers has reduced trust in the housing market as a store of value. Third, an income effect: the decline of construction and related industries has reduced employment and incomes in these sectors, particularly for migrant workers.
These effects help explain why household consumption has remained weak despite policy support, as discussed in the previous article in this series. The property contraction and the weakness of consumption are two sides of the same adjustment.
6.5 The policy dilemma
The authorities face a genuine dilemma. Supporting the market too strongly, for example through massive purchases of unsold homes by the state, would slow the adjustment of supply and risk recreating the imbalances of the boom. Not supporting it enough risks a deeper and longer decline, with further developer defaults, unfinished homes and a continued drag on growth.
The approach taken so far has been incremental: a series of targeted measures, each of moderate size. The 2026 mortgage interest subsidy is an example: a one percentage point reduction in the effective mortgage rate for first-time buyers is significant for each household that benefits, but it does not address the problem of confidence in presold homes, nor the oversupply in smaller cities.
The IMF and other observers have argued for a more decisive approach, including the use of central government resources to complete unfinished homes, faster restructuring of non-viable developers, and allowing prices to adjust more freely. The evidence presented in this article, notably the persistence of the quantity adjustment and the sharp drop in bank lending to developers in 2026, is consistent with the view that the incremental approach has not been sufficient to stabilise the sector.
6.6 Comparison with other episodes
International experience suggests that housing adjustments of this scale typically last between five and ten years. In the United States, housing starts fell from a peak of about 2.1 million units in 2006 to about 0.55 million in 2009, and did not return to 1.5 million until 2019. In Spain, starts fell by about 90 percent between 2006 and 2013 and remained at very low levels for several years. In Japan, the adjustment after 1991 lasted more than a decade, with a prolonged decline in land prices.
China differs from these cases in several respects. The share of real estate in the economy was much larger at the peak. The adjustment has been driven by policy rather than by a market crash. The banking system has been largely protected by the state. And the demographic backdrop is less favourable, with a declining population and slowing urbanisation. These factors suggest that the Chinese adjustment could be longer than the American one, and that the level of activity at which it stabilises could be permanently lower than in the boom years.
7. Scenarios
7.1 Estimating underlying demand
To frame scenarios, it is useful to estimate the level of new residential construction that would be needed in a stable market. The author uses a simple model with three components of new urban housing demand:
1. Growth of the urban population. Each new urban resident requires housing. The urban population was about 943 million in 2025. In recent years it has increased by about 10 million per year, but this increase is slowing. The model uses 6, 8 and 10 million per year for the low, central and high cases. 2. Increase in floor space per person. The average urban living space per person was about 36.5 square metres at the 2020 census. As incomes rise, households want more space. The model assumes an increase of 0.3, 0.5 or 0.7 square metres per person per year. 3. Replacement of old housing. Part of the existing stock is demolished or becomes obsolete each year. With an estimated urban stock of about 34 billion square metres, the model assumes a replacement rate of 0.5, 0.75 or 1 percent per year.
The result is an estimate of underlying urban housing demand of about 674 million square metres per year in the low case, 1,022 million in the central case and 1,370 million in the high case.
This estimate must be interpreted carefully. It measures demand for new housing in a stable market, without taking into account the existing excess of vacant and unfinished homes. During the boom, sales far exceeded this level, which led to the accumulation of vacant homes. Now that sales have fallen below the central estimate, part of the gap is being filled by the existing stock of vacant homes and the completion of unfinished projects.
7.2 Three scenarios to 2030
Figure 6 presents three scenarios for residential floor space sold between 2026 and 2030.
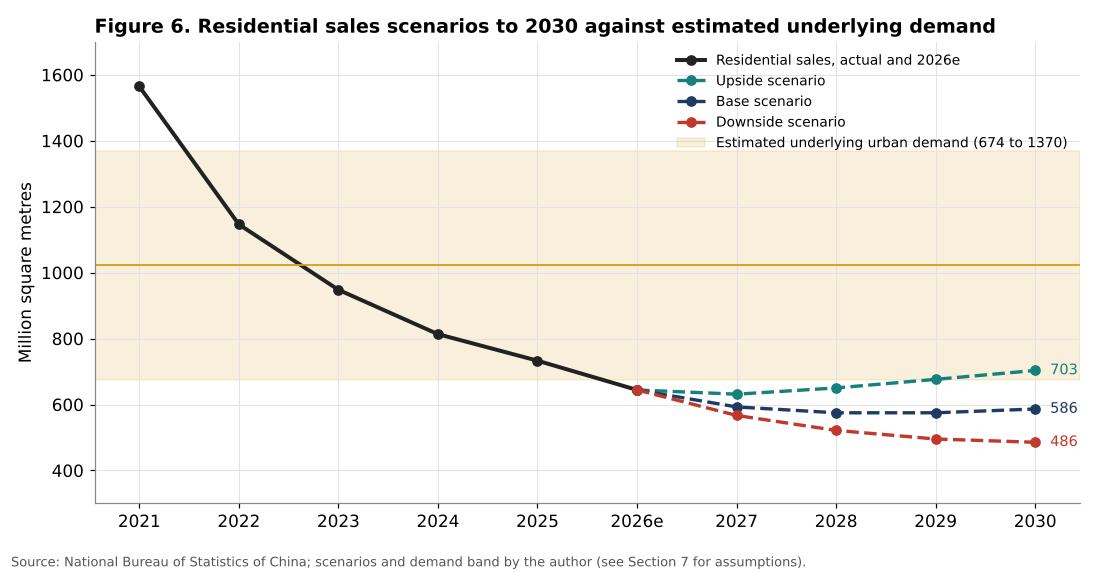
The starting point is the estimate for 2026 of residential floor space sold, about 644 million square metres, derived by applying the 12.1 percent decline in total floor space sold in the first eight months of 2026 to the 733 million square metres of residential floor space sold in 2025. For reference, residential floor space sold was about 1,565 million square metres in 2021.
Base scenario. The decline continues in 2027 (-8 percent) and slows in 2028 (-3 percent), then the market stabilises in 2029 and grows slightly in 2030 (+2 percent). Residential sales reach a floor of about 575 million square metres, roughly 37 percent of the 2021 level, and are about 587 million in 2030. This scenario assumes that policy support remains incremental and that confidence recovers only slowly.
Downside scenario. The decline continues at a sustained pace for four more years (-12, -8, -5 and -2 percent). Residential sales fall to about 486 million square metres in 2030, less than a third of the 2021 level. This scenario corresponds to a situation in which further developer defaults and continued price declines maintain uncertainty, and in which the declining population of young adults reduces first home purchases more than expected.
Upside scenario. A more decisive policy response, including the completion of unfinished homes with central government funds and a clearer price adjustment, restores confidence. Sales decline slightly in 2027 (-2 percent), then grow by 3 to 4 percent per year. Residential sales reach about 703 million square metres in 2030, which would bring them back within the lower part of the estimated demand band.
7.3 Interpretation
In all three scenarios, residential sales remain below the central estimate of underlying demand until 2030. This is not a contradiction. The gap between sales and underlying demand is filled by the absorption of the existing stock of vacant and unfinished homes. The length of time it takes to absorb this stock determines when new construction can recover.
The scenarios also show that even in the upside case, the level of activity in 2030 would remain less than half of the 2021 peak. A return to the volumes of the boom years is not plausible. The real question for the Chinese economy is not when the property market will recover to its previous level, but how quickly it will stabilise at a new, much lower level, and how quickly other sectors can replace it as sources of growth and employment.
For new construction starts, the implications are even more significant. If residential sales stabilise around 575 million square metres, and if the ratio of starts to sales returns gradually toward 1 as the pipeline is absorbed, starts could stabilise at between 450 and 600 million square metres per year, compared with about 1,989 million in 2021. This would imply a permanent reduction of construction activity of about 70 to 75 percent from the peak.
7.4 Indicators to monitor
To determine which scenario is unfolding, the author suggests monitoring five indicators, all available from NBS on a monthly basis:
1. The year-on-year change in floor space sold: a move toward zero would signal stabilisation. 2. The ratio of starts to sales: a stabilisation followed by a gradual rise toward 1 would signal that developers are regaining confidence. 3. Domestic loans to developers: a slowdown in the rate of decline would indicate that the funding trap is easing. 4. Inventory in months of sales: a decline would signal absorption of the completed stock. 5. The seventy-city price index: a month-on-month increase in a majority of cities would signal that the price adjustment is ending.
As of August 2026, none of these five indicators signals a clear stabilisation. Floor space sold is still falling by more than 12 percent, the ratio of starts to sales is still falling, domestic loans are falling sharply, inventory measured in months is rising, and prices are still declining month on month, although at a slower rate.
8. Conclusion
This article has measured the contraction of China’s real estate sector between 2021 and 2026 using official NBS data and a consistent set of indicators calculated by the author. The main conclusions are as follows.
First, the adjustment is of exceptional magnitude. By 2026, new construction starts will be about 22 percent of their 2021 level, while floor space sold, sales value, investment and completions will be at 40 to 45 percent. The decline did not stop in 2025 and accelerated on several measures in the first eight months of 2026.
Second, the adjustment has been overwhelmingly a quantity adjustment. More than nine tenths of the fall in sales revenue is explained by the fall in floor space sold, while the average value per square metre is only about 6 percent below its 2021 level. The relative rigidity of official prices limits the immediate shock to household wealth but prolongs the period of low activity.
Third, the construction pipeline is still oversized relative to demand. Floor space under construction represents more than seven years of current sales, and completed unsold inventory represents about twelve months of sales and is not being absorbed.
Fourth, the funding structure of developers remains dependent on presales, which account for about 45 percent of total funds, while bank loans to developers fell by a third in 2026. This combination creates a funding trap that limits new starts even where demand exists.
Fifth, the macroeconomic weight of property development has fallen from about 12.8 percent of GDP in 2021 to an estimated 4.5 percent in 2026, and its direct drag on GDP remains above one percentage point per year.
The scenarios suggest that residential sales are likely to stabilise between about 490 and 700 million square metres per year by 2030, far below the peak of about 1,565 million in 2021. The Chinese economy is therefore not in a temporary property downturn but in a permanent transition to a model in which real estate plays a much smaller role. The success of this transition depends less on the property market itself than on the ability of consumption, services and new industries to replace it as sources of growth.
Need this analysis for your organisation?
We prepare confidential briefings, executive talks and studies on countries, markets and policies, built on the same method as this article.
Request a briefingSupport independent analysis
Our studies are free to read and carry no advertising. If this one was useful, a small contribution helps us publish the next.
Support our workGo further: books by Global Strategy Files


Frequently asked questions
How much has China’s property market contracted since 2021?
China’s property market has contracted sharply. By 2026 new construction starts are about 22 percent of their 2021 level, while floor space sold, sales value, investment and completions have each fallen to between 40 and 45 percent of their peak, and the decline accelerated in early 2026.
Have Chinese house prices fallen as much as sales?
No. The adjustment has been mainly a quantity adjustment. More than nine tenths of the fall in sales revenue comes from lower floor space sold, while the average value per square metre is only about 6 percent below its 2021 level in the national aggregate.
Why are Chinese property developers short of funding in 2026?
Developers are squeezed because presales remain weak and banks have pulled back. In 2026 domestic bank loans to developers are falling faster than any other source of funds, at 33.3 percent year on year, which limits new construction starts even where demand exists.
How much does the property slump cost China’s economy?
Property development investment has fallen from about 12.8 percent of GDP in 2021 to an estimated 4.5 percent in 2026, and its direct drag on growth is still above one percentage point of GDP per year, before indirect effects on related industries.
Methodological note
All calculations in this article were carried out by the author using data published by the National Bureau of Statistics of China. The 2026 estimates apply the year-on-year growth rate for January to August 2026 to the 2025 full-year level. The decomposition of sales value uses natural logarithms. The share of GDP uses published nominal GDP for 2021, 2024 and 2025 and assumes nominal growth of 4 percent in 2026. The underlying demand model and the scenarios are illustrative and are based on explicit assumptions described in Section 7. Annual levels for 2019 to 2024 are taken from NBS annual releases; growth rates published on a comparable basis may differ slightly from changes computed from levels. The figures and tables can be reproduced from the sources listed below.
References
Chivakul, M., Lam, W. R., Liu, X., Maliszewski, W. and Schipke, A. (2015). Understanding Residential Real Estate in China. IMF Working Paper WP/15/84. International Monetary Fund.
Fang, H., Gu, Q., Xiong, W. and Zhou, L.-A. (2016). Demystifying the Chinese Housing Boom. NBER Macroeconomics Annual, 30(1), 105 to 166.
Glaeser, E., Huang, W., Ma, Y. and Shleifer, A. (2017). A Real Estate Boom with Chinese Characteristics. Journal of Economic Perspectives, 31(1), 93 to 116.
International Monetary Fund (2025). People’s Republic of China: 2025 Article IV Consultation. IMF Country Report. Washington, DC.
Liu, C. and Xiong, W. (2020). China’s Real Estate Market. In M. Amstad, G. Sun and W. Xiong (eds.), The Handbook of China’s Financial System. Princeton University Press.
National Bureau of Statistics of China (2020 to 2026). Investment in Real Estate Development, annual and monthly press releases. Beijing.
National Bureau of Statistics of China (2026). Investment in Real Estate Development for 2025. Press release, 20 January 2026.
National Bureau of Statistics of China (2026). Investment in Real Estate Development for January to August 2026. Press release, September 2026.
National Bureau of Statistics of China (2026). Sales Prices of Residential Buildings in 70 Large and Medium-sized Cities, May to August 2026. Monthly press releases.
Rogoff, K. and Yang, Y. (2021). Has China’s Housing Production Peaked? China and World Economy, 29(1), 1 to 31.
Rogoff, K. and Yang, Y. (2022). Rethinking China’s Growth. Economic Policy, 37(111), 517 to 548.
World Bank (2026). China Economic Update. Washington, DC: World Bank.
