
Russia: Stabilising Prices Without Stifling Activity


Stabilising Prices Without Stifling Activity: An Empirical Assessment of the Bank of Russia’s Monetary Policy, 2014 to 2026
Driss EFFINA, PhD
Independent Researcher, Global Strategy Files
Reading time: 28 minutes
Key takeaways
- The Bank of Russia held its key rate at 14 percent in September 2026 after annual inflation rose from 5.31 percent in May to 6.35 percent.
- The ex post real key rate averaged 10.3 percent between July 2024 and December 2025, more than twice the upper bound of the central bank's neutral range.
- Disinflation in 2025 and 2026 required five to six times more real monetary tightness per point than the 2015 to 2018 episode.
- Households expect inflation of 14.2 percent, so from their point of view the real key rate is close to zero despite a 14 percent nominal rate.
Abstract
In September 2026 the Bank of Russia paused a fourteen-month easing cycle and held its key rate at 14 percent, after annual inflation rose from 5.31 percent in May to 6.35 percent in September. This paper asks a precise question: how can a central bank stabilise prices without suffocating activity when supply is constrained, fiscal policy is expansionary and inflation expectations remain detached from realised inflation? Using monthly official data from the Bank of Russia for January 2014 to September 2026 (153 observations), I reconstruct the monthly average key rate from daily decisions, compute ex post and ex ante real policy rates, benchmark policy against a simple inflation-targeting rule anchored on the central bank’s own neutral-rate estimate, estimate exchange-rate pass-through and inflation persistence with heteroskedasticity and autocorrelation robust inference, and compare three disinflation episodes. Five results stand out. First, the ex post real key rate averaged 10.3 percent between July 2024 and December 2025, more than twice the upper bound of the Bank of Russia’s neutral real-rate range, and was still 7.65 percent in September 2026. Second, policy has been between 2.5 and 6 percentage points tighter than a simple rule would prescribe since 2025, compared with an average gap of only 0.44 points in 2017 to 2019. Third, the statistical link between ruble depreciation and inflation, very strong before 2020 (slope 0.17, R squared 0.79), has collapsed since 2020 (slope close to zero, R squared 0.00). Fourth, the 2025 to 2026 disinflation proceeded at 0.36 percentage points per month despite an average real rate of 10.1 percent, whereas the 2015 to 2018 disinflation achieved 0.43 points per month with an average real rate of only 2.2 percent: each unit of disinflation now requires far more monetary effort. Fifth, households expect 14.2 percent inflation, which implies an ex ante real key rate of roughly zero from their point of view, while analysts’ forecasts imply a real rate above 9 percent. I argue that the trade-off between price stability and growth in Russia is no longer governed mainly by the level of the key rate but by the weakening of transmission channels, the size of the fiscal impulse and the persistence of household expectations. The paper closes with conditions under which easing could resume without reigniting inflation.
Keywords: Bank of Russia, key rate, inflation targeting, real interest rate, exchange-rate pass-through, monetary transmission, fiscal dominance, inflation expectations, sacrifice ratio.
1. Introduction
On 11 September 2026 the Board of Directors of the Bank of Russia decided to keep its key rate at 14.00 percent per annum. It was the first pause after ten consecutive reductions since June 2025, which had brought the rate down from a peak of 21 percent, a level held from October 2024 to June 2025. The official explanation was explicit. Current seasonally adjusted price growth reached 11.6 percent in annualised terms in July 2026, compared with 5.3 percent on average in the second quarter, and the Bank’s estimate of underlying inflation was raised to a range of 5 to 6 percent. Annual inflation stood at 6.3 percent on 7 September. The proximate cause was a disruption in the domestic fuel market, which the Governor described as a one-off factor that was nevertheless spreading to a wider range of goods and services through costs, demand and expectations.
This decision illustrates a dilemma that is at the heart of Russian macroeconomic policy in 2026. On one side, inflation has re-accelerated, household inflation expectations have risen to 14.2 percent, and the government’s draft budget for 2027 to 2029 confirms large and persistent deficits. On the other side, economic growth has slowed sharply: gross domestic product rose by about 1.0 percent in 2025 after 4.9 percent in 2024, contracted by 0.2 percent year on year in the first quarter of 2026 and grew by 1.3 percent in the second quarter, with gross capital formation falling by 8.4 percent. The cost of credit is high, investment is weak and the central bank’s own forecast for 2026 growth is only 0.0 to 1.0 percent.
The question addressed in this article is therefore not rhetorical: how can the Bank of Russia stabilise prices without suffocating activity? The public debate on this question is often conducted through assertions. Business associations argue that the key rate is strangling investment, while the central bank argues that easing too quickly would compromise disinflation. Many commentaries repeat one position or the other without measurement. The ambition of this paper is different. Rather than summarising arguments already in circulation, it builds its conclusions on calculations performed directly on official data, with the methods made explicit so that any reader can reproduce them.
The paper makes four contributions. First, it quantifies the stance of monetary policy over twelve years with consistent indicators: the ex post real key rate, the gap with respect to a transparent policy rule, and ex ante real rates measured against several sets of expectations. Second, it tests whether a central transmission channel, the pass-through of the exchange rate to consumer prices, has changed since 2020. Third, it compares the efficiency of three disinflation episodes, which provides an empirical measure of how much monetary effort is now required per point of disinflation. Fourth, it translates these results into a policy discussion of the conditions that would allow easing to resume.
The rest of the paper is organised as follows. Section 2 recalls the institutional and macroeconomic context. Section 3 reviews the relevant literature. Section 4 presents the data and the methodology. Section 5 reports the results. Section 6 discusses their implications for the trade-off between inflation and activity. Section 7 presents scenarios for 2027, and Section 8 concludes.
2. Context: twelve years of shocks and regime changes
Russian monetary policy since 2014 can be read as a succession of regimes, each defined by a dominant shock.
The first regime, from 2014 to 2016, was the transition to inflation targeting under extreme stress. The collapse of oil prices and the first round of Western sanctions after 2014 led to a sharp depreciation of the ruble: the monthly average dollar rate rose from 33.78 rubles in January 2014 to 77.93 rubles in January 2016. The Bank of Russia floated the ruble in November 2014 and raised its key rate to 17 percent on 16 December 2014. Inflation peaked at 16.9 percent in March 2015. The formal adoption of a 4 percent inflation target followed, and the target appears in the central bank’s statistical series from January 2017.
The second regime, from 2017 to 2019, was the period in which inflation targeting worked as the textbook describes. Inflation averaged 3.68 percent, the key rate was gradually reduced from 10 percent to 6.25 percent, and the real key rate stayed between 2.45 and 5.78 percent. This period is important for this paper because it provides an empirical benchmark of what a functioning transmission mechanism looked like in Russia.
The third regime, in 2020 and 2021, combined the pandemic shock, an exceptionally low key rate of 4.25 percent in the second half of 2020 and a rebound of demand that pushed inflation to 8.4 percent at the end of 2021.
The fourth regime began with the war in Ukraine in February 2022. The key rate was raised to 20 percent on 28 February 2022, capital controls were introduced, and the ruble, after a spike to an average of 103.47 per dollar in March 2022, appreciated strongly to 57.18 in June 2022. Inflation peaked at 17.83 percent in April 2022 and then fell to 2.31 percent in April 2023, largely because of base effects and the strong ruble.
The fifth regime, from mid-2023 onwards, is the war economy proper. Military spending, labour shortages and subsidised lending fuelled demand while sanctions constrained supply. Inflation accelerated again from 2.31 percent in April 2023 to 10.34 percent in March 2025. The Bank of Russia responded with one of the most aggressive tightening cycles of its history, raising the key rate from 7.5 percent in July 2023 to 21 percent in October 2024, in eight steps. Disinflation followed: inflation fell to 5.59 percent in December 2025 and 5.31 percent in May 2026, allowing the key rate to be reduced to 14 percent by July 2026.
Since June 2026, a new supply shock has interrupted this trajectory. Disruptions at production facilities in the fuel sector raised motor fuel prices, and the Governor stated in September that indirect effects were materialising through business costs and second-round effects through expectations and demand. At the same time, external conditions deteriorated: renewed escalation in the Middle East pushed up commodity prices, several major economies faced rising inflation and interest rates, and the ruble weakened from an average of 72.81 per dollar in May 2026 to 85.11 in September 2026.
The fiscal context is equally important. According to the draft federal budget submitted at the end of September 2026, the federal deficit is estimated at 3.2 percent of GDP in 2026, or 7.335 trillion rubles. Defence spending is planned at 17.147 trillion rubles in 2027. Public debt is projected to rise from 53.9 trillion rubles at the end of 2027 to 67.9 trillion rubles at the end of 2029. The Bank of Russia’s July 2026 baseline assumed a structural primary deficit of 2 percent of GDP in 2026, falling to 1 percent in 2027 and 0.5 percent in 2028, and warned that a looser path would require tighter monetary policy.
3. Literature review
Four strands of the literature frame the analysis.
The first strand concerns the measurement of the policy stance. Taylor (1993) proposed that the policy rate should respond to the deviation of inflation from target and to the output gap, around a neutral nominal rate. Clarida, Galí and Gertler (1999) formalised the logic of such rules within the New Keynesian framework and showed why the policy rate must react more than one for one to inflation (the Taylor principle) for inflation to be stable. The neutral real rate itself is unobservable and must be estimated, as in Laubach and Williams (2003). For Russia, the most relevant estimate is the central bank’s own: the Bank of Russia currently places the long-term neutral real rate at 3.5 to 4.5 percent, which corresponds to a nominal neutral key rate of 7.5 to 8.5 percent given the 4 percent target. This paper uses this official range rather than imposing an external estimate.
The second strand concerns exchange-rate pass-through. Taylor (2000) argued that pass-through falls in low and stable inflation environments because firms perceive cost shocks as less persistent. Campa and Goldberg (2005) documented substantial differences in pass-through across countries and over time. In commodity-exporting emerging economies, the exchange rate has traditionally been a dominant channel of monetary transmission, which makes any change in pass-through a first-order question for policy.
The third strand concerns the interaction between fiscal and monetary policy. Sargent and Wallace (1981) showed that when fiscal policy is dominant, monetary policy may lose its ability to control inflation over time. Blanchard (2004), studying Brazil, showed how a high debt burden and fiscal risk can make interest rate increases counterproductive by weakening the currency. Russia’s public debt remains moderate by international standards, so the relevant mechanism is not classic fiscal dominance but rather a fiscal impulse that offsets the restrictive effect of monetary policy on aggregate demand.
The fourth strand concerns expectations and the cost of disinflation. Coibion, Gorodnichenko and Kamdar (2018) reviewed the evidence that household and firm expectations differ markedly from those of professional forecasters and from rational expectations benchmarks, and that these subjective expectations matter for pricing and spending decisions. Ball (1994) estimated sacrifice ratios, the output loss per point of disinflation, and showed that they depend on the speed of disinflation and on nominal rigidities. Bernanke and Gertler (1995) described the credit channel through which policy affects spending, a channel that is weakened when a large share of credit is subsidised or directed. Blanchard and Galí (2009) showed how the macroeconomic effects of oil price shocks depend on wage rigidity and on the credibility of monetary policy.
The present paper contributes to these strands by providing updated measurements for Russia up to September 2026, a period that is not yet covered by the academic literature.
4. Data and methodology
4.1 Data
All core series come from official sources:
- Key rate: daily key rate of the Bank of Russia from January 2014 to October 2026, as published in its statistical database. I converted the step function of decisions into a calendar-day series and computed monthly averages. This avoids attributing a full month to a rate decided at the end of that month.
- Inflation: annual consumer price inflation (percent, year on year) for each month, from the Bank of Russia’s series “Inflation and key rate”, which reproduces Rosstat data. The sample used covers January 2014 to September 2026.
- Exchange rate: official daily ruble to US dollar rate set by the Bank of Russia, averaged by month.
- Expectations: the InFOM household survey commissioned by the Bank of Russia (median expected inflation over the next 12 months), the Bank of Russia business monitoring (average expected price growth over the next three months, seasonally adjusted annualised) and the Bank of Russia survey of analysts.
- Activity, labour and fiscal data: Rosstat GDP releases as reported by the press, the Bank of Russia’s July 2026 medium-term forecast, and the draft federal budget for 2027 to 2029.
The final monthly panel contains 153 observations. Data were collected on 18 October 2026.
4.2 Indicators and methods
Ex post real key rate. Defined as the monthly average key rate minus annual inflation in the same month. It is an imperfect measure of the real cost of money, because economic agents care about expected rather than past inflation, but it has the advantage of being fully observable.
Ex ante real key rates. Defined as the key rate minus a measure of expected inflation. Because different agents hold very different expectations, I compute four versions: using household expectations, analysts’ forecasts for 2027, the central bank’s own target for 2027, and firms’ short-term expected price growth.
Rule-based benchmark. I compute a simple rule of the form: prescribed rate = 8 percent + 1.5 x (inflation minus 4 percent). The constant of 8 percent is the midpoint of the Bank of Russia’s nominal neutral range. The coefficient of 1.5 is the classic value proposed by Taylor (1993) and satisfies the Taylor principle. I deliberately omit the output gap: official estimates are not published monthly, and in a supply-constrained economy the output gap is particularly uncertain. The rule gap is the difference between the actual key rate and the prescribed rate. A positive gap means policy is tighter than the rule.
Exchange-rate pass-through. I compute the annual depreciation of the ruble against the dollar as the 12-month difference in the logarithm of the monthly average rate, multiplied by 100. I then compute cross-correlations between inflation and depreciation lagged from 0 to 12 months and select the lag with the highest correlation. Finally, I estimate simple regressions of inflation on lagged depreciation over two subsamples, 2014 to 2019 and 2020 to 2026, to test for a structural break.
Persistence and dynamic regression. I estimate the model
inflation(t) = a + ρ x inflation(t-1) + b x depreciation(t-3) + c x real rate(t-6) + error,
by ordinary least squares with Newey and West (1987) standard errors robust to heteroskedasticity and autocorrelation (12 lags). The coefficient ρ measures persistence, the implied half-life of a deviation is ln(0.5)/ln(ρ), and the long-run pass-through is b/(1-ρ).
Disinflation episodes. For each of the three major inflation peaks (2015, 2022, 2025), I identify the peak and the subsequent trough, then compute the speed of disinflation in percentage points per month, the average ex post real key rate during the episode, and the change in the exchange rate.
Limitations. These methods are deliberately transparent and parsimonious. They do not identify causal effects in the strict sense: the key rate responds to inflation, which biases simple regressions of inflation on the real rate. Annual inflation is a smoothed indicator that reacts with delay to monthly dynamics. The rule omits the output gap. For these reasons, results are interpreted as robust stylised facts rather than as structural parameters.
5. Results
5.1 Twelve years of policy stance
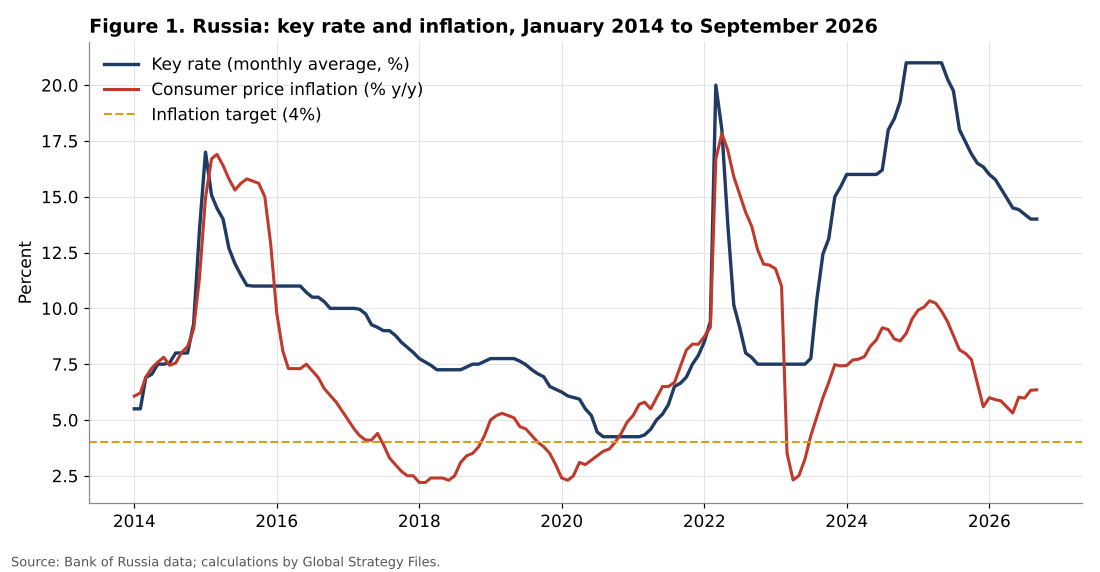
Figure 1 shows the key rate and inflation since 2014. Table 1 summarises the stance by regime.
Table 1. Policy stance by regime (monthly averages, percent)
| Period | Key rate | Inflation | Ex post real rate | Minimum real rate | Maximum real rate |
|---|---|---|---|---|---|
| Jan 2014 to Dec 2016 | 10.36 | 10.15 | 0.21 | -4.77 | 4.60 |
| Jan 2017 to Dec 2019 | 7.96 | 3.68 | 4.28 | 2.45 | 5.78 |
| Jan 2020 to Dec 2021 | 5.40 | 5.03 | 0.37 | -1.47 | 3.85 |
| Jan 2022 to Dec 2022 | 10.61 | 13.75 | -3.14 | -6.30 | 3.31 |
| Jan 2023 to Jun 2024 | 11.96 | 6.61 | 5.35 | -4.27 | 8.56 |
| Jul 2024 to Dec 2025 | 19.12 | 8.80 | 10.32 | 7.06 | 12.12 |
| Jan 2026 to Sep 2026 | 14.80 | 5.93 | 8.87 | 7.65 | 10.00 |
Source: Bank of Russia; calculations by the author.
Three observations follow from Table 1. First, the only period in which inflation remained close to target, 2017 to 2019, was also the only period in which the ex post real rate stayed persistently within or slightly above the Bank of Russia’s neutral range (3.5 to 4.5 percent). The average was 4.28 percent. This supports the official estimate of the neutral rate: in normal conditions, a real rate around 4 percent was sufficient to keep inflation near 4 percent.
Second, the tightening of 2024 and 2025 was exceptional by any historical standard. The ex post real key rate averaged 10.32 percent between July 2024 and December 2025, peaked at 12.12 percent in November 2024 and never fell below 7.06 percent. Since January 2024, the real rate has exceeded 5 percent in 33 consecutive months of the sample. In September 2026, even after a cumulative reduction of 7 percentage points in the nominal key rate, the real rate was still 7.65 percent, almost twice the upper bound of the neutral range.
Third, the decline in the real rate during 2026 is not only the result of nominal cuts but also of the rebound in inflation. Between May and September 2026, the nominal rate fell by 0.5 points on a monthly average basis, while inflation rose by 1.04 points; the real rate therefore fell by 1.54 points. In other words, part of the easing of real monetary conditions in 2026 was passive, caused by inflation itself. This is precisely the mechanism the Governor referred to when she noted that overall monetary tightness in real terms had decreased slightly since July.
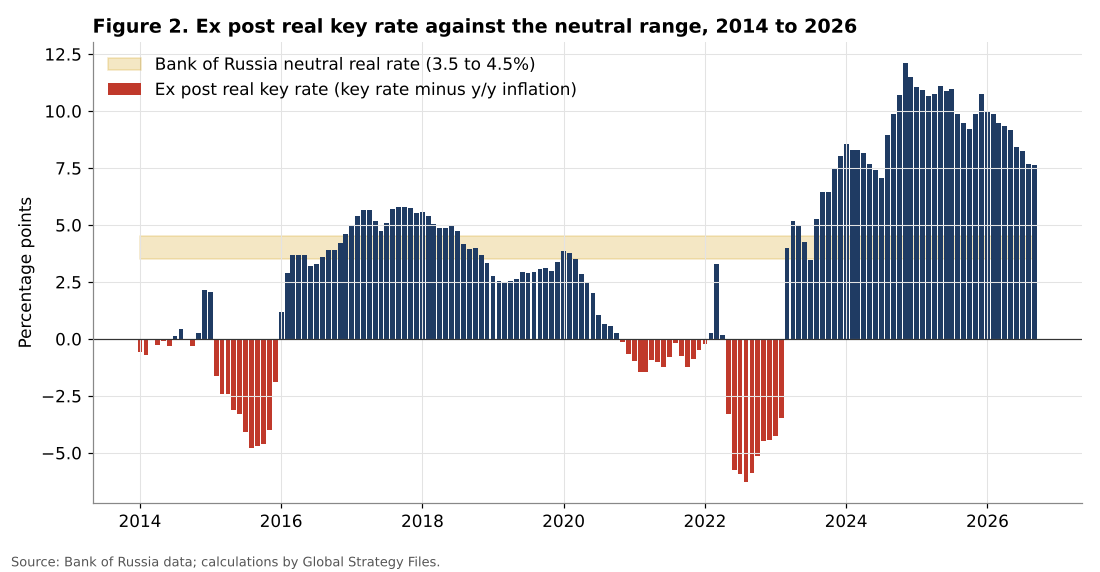
5.2 How tight is policy compared with a rule?
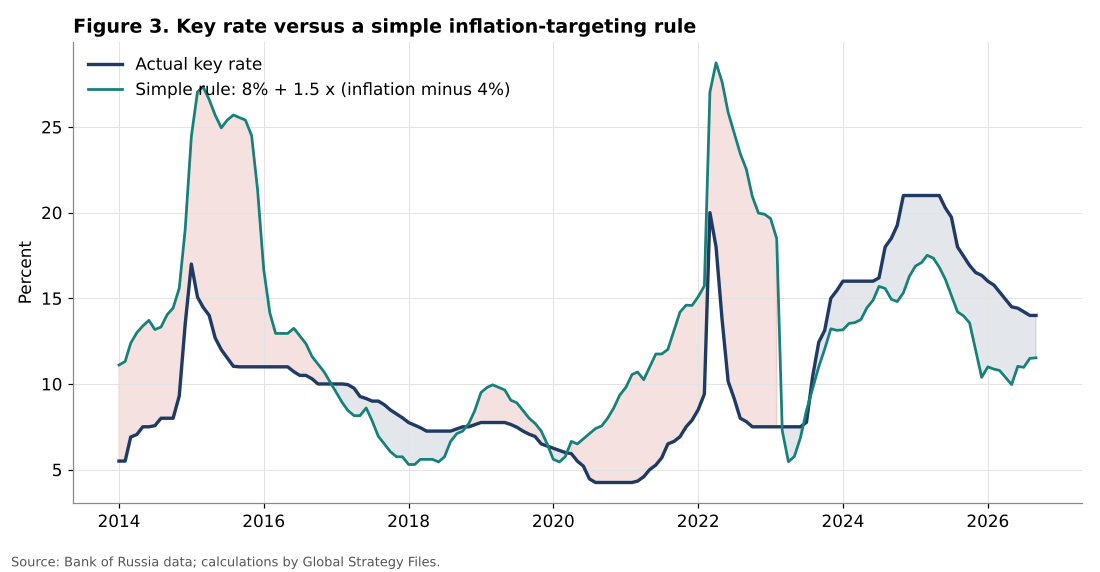
Figure 3 compares the actual key rate with the simple rule described in Section 4. The rule gap is informative about the central bank’s reaction function. In 2017 to 2019, the average gap was 0.44 percentage points: the Bank of Russia behaved almost exactly as a simple inflation-targeting rule with a neutral rate of 8 percent would suggest. In 2015 and 2022, the gap was strongly negative (-12.68 and -12.02 points on annual average), reflecting the fact that inflation peaks driven by large devaluations were partly looked through.
The situation since 2024 is the reverse. The gap averaged +2.83 points in 2024, +4.10 points in 2025 and +3.91 points in the first nine months of 2026. It reached +5.95 points in December 2025. In September 2026, with inflation at 6.35 percent, the rule prescribes a rate of 11.52 percent, against an actual rate of 14 percent, a gap of +2.48 points.
This finding has a clear interpretation. A rule calibrated on the experience of 2017 to 2019 would have allowed a faster easing. The Bank of Russia has chosen to maintain a premium of several percentage points above such a rule. The premium is consistent with the central bank’s own explanations: high inflation expectations, the risk of fiscal loosening, labour shortages and wage growth exceeding productivity. It is also consistent with a hypothesis tested below, namely that the transmission of a given level of the key rate to inflation has become weaker, so that more tightening is needed to obtain the same effect.
5.3 The collapse of exchange-rate pass-through
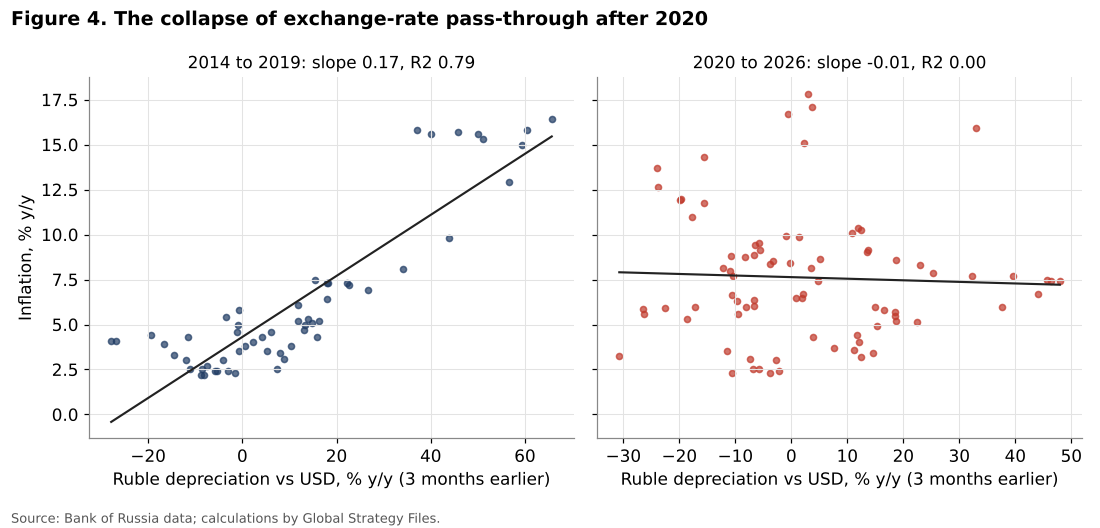
The cross-correlation between annual inflation and ruble depreciation is positive at all lags between 0 and 12 months over the full sample, but modest: it rises from 0.29 at lag 0 to a maximum of 0.38 at lag 3 and then declines to 0.21 at lag 12. A lag of three months is consistent with the time needed for import prices to be transmitted to retail prices.
The more striking result appears when the sample is split. Over 2014 to 2019, a regression of inflation on depreciation lagged three months yields a slope of 0.17 with an R squared of 0.79. In plain terms, before 2020 a 10 percent annual depreciation of the ruble was associated with an inflation rate about 1.7 points higher three months later, and depreciation alone explained almost four fifths of the variation in inflation. Over 2020 to 2026, the slope is -0.01 and the R squared is 0.00. The relationship has disappeared.
Several mechanisms can explain this break, and they are not mutually exclusive. Capital controls and export revenue surrender requirements after 2022 changed the nature of the exchange rate, which became less a market signal than a managed outcome of trade flows. The reorientation of imports towards China and the increase in settlements in yuan reduced the role of the dollar as the reference currency for pricing. Import substitution and parallel imports altered the cost structure of consumer goods. Finally, during 2022 to 2026, inflation was dominated by domestic demand and labour market pressures rather than by import costs.
The policy implication is important. Historically, one of the main channels through which a higher key rate reduced inflation in Russia was the appreciation of the ruble. If this channel has weakened, the central bank must rely more on the credit and demand channels, which are themselves weakened by subsidised lending and fiscal spending. This helps explain why the key rate had to rise so high in 2024 and 2025.
A caution is necessary. The dollar rate may have become a poor measure of the effective exchange rate relevant for Russian importers, given the shift towards the yuan. The collapse of the measured pass-through could therefore partly reflect a measurement problem rather than a true disappearance of the channel. Even so, the result shows that the simple rule of thumb that many commentators still use, according to which a weaker ruble mechanically means higher inflation, is no longer supported by the data of the last six years.
5.4 Persistence: inflation has a long memory
The dynamic regression described in Section 4 yields the following estimates (138 observations, R squared 0.93):
Table 2. Dynamic inflation regression, 2015 to 2026 (Newey West standard errors, 12 lags)
| Variable | Coefficient | t statistic |
|---|---|---|
| Constant | 0.256 | 1.59 |
| Inflation, previous month | 0.939 | 37.53 |
| Depreciation, three months earlier | 0.006 | 0.86 |
| Ex post real rate, six months earlier | 0.021 | 0.72 |
Source: calculations by the author.
The persistence coefficient of 0.939 is high and very precisely estimated. It implies that the half-life of a deviation of annual inflation is about 11 months. Concretely, if inflation rises one point above its normal level because of a temporary shock, half of the deviation is still present eleven months later in the absence of other forces. This persistence is partly mechanical, because annual inflation is a 12-month moving measure, but the order of magnitude is relevant for policy: a shock such as the summer 2026 fuel disruption will affect annual inflation throughout most of 2027 unless offset.
The long-run pass-through implied by the dynamic model is 0.09, in line with the static estimate of 0.07 over the full sample, and statistically weak. The coefficient on the lagged real rate has a positive sign and is not significant. This should not be read as evidence that monetary policy has no effect. It reflects the reverse causality described in Section 4: the central bank raises the real rate precisely when inflation is high and expected to rise. Identifying the causal effect of policy would require a structural model or high-frequency identification, which goes beyond the scope of this paper. The result does show, however, that the reduced-form relationship between the real rate and subsequent inflation is weak in Russian data, which is consistent with the hypothesis of weakened transmission.
5.5 Three disinflations compared: the rising cost of each point
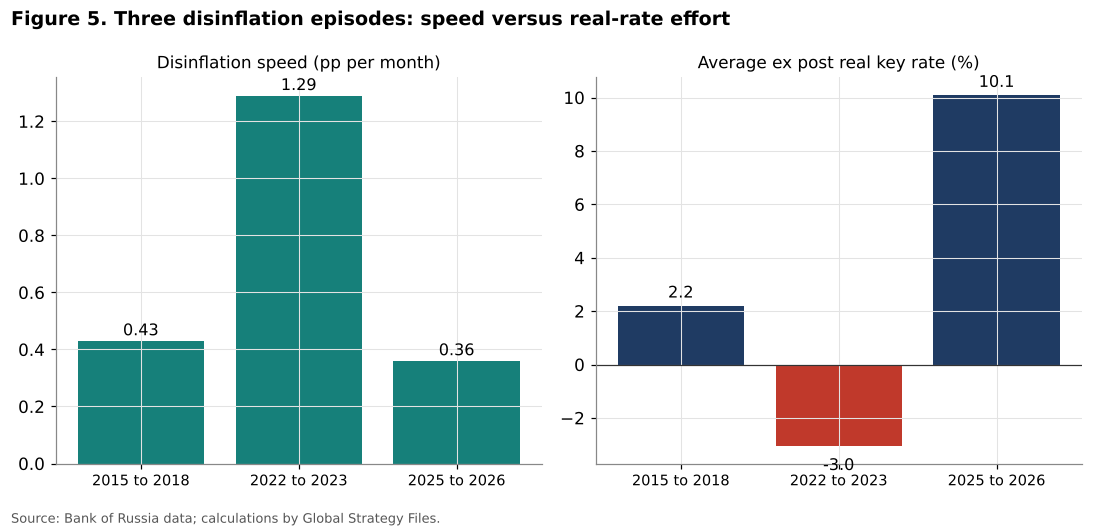
Table 3. Disinflation episodes
| Episode | Peak | Trough | Duration (months) | Speed (pp per month) | Average ex post real rate | Change in USD rate |
|---|---|---|---|---|---|---|
| 2015 to 2018 | 16.90 (Mar 2015) | 2.20 (Jan 2018) | 34 | 0.43 | 2.21 | -6.4% |
| 2022 to 2023 | 17.83 (Apr 2022) | 2.31 (Apr 2023) | 12 | 1.29 | -3.05 | +4.0% |
| 2025 to 2026 | 10.34 (Mar 2025) | 5.31 (May 2026) | 14 | 0.36 | 10.10 | -15.4% |
Source: Bank of Russia; calculations by the author. A negative change in the USD rate means ruble appreciation.
This comparison is, in my view, the most important result of the paper. The 2015 to 2018 disinflation reduced inflation by 0.43 points per month with an average real key rate of only 2.2 percent, helped by a moderate appreciation of the ruble. The 2022 to 2023 disinflation was very fast, 1.29 points per month, with a negative average real rate, because it was mainly a base effect following a one-time price level jump combined with a strongly appreciating ruble in mid-2022.
The 2025 to 2026 disinflation is of a different nature. It proceeded at only 0.36 points per month, the slowest of the three, even though the average real key rate was 10.1 percent, almost five times higher than in the first episode, and even though the ruble appreciated by 15.4 percent against the dollar between March 2025 and May 2026. If one computes a crude effort ratio, the average real rate divided by the speed of disinflation, the result is about 5 for the 2015 episode and about 28 for the 2025 episode. Each point of disinflation now requires roughly five to six times more real monetary tightness than a decade ago.
This is the empirical core of the dilemma the Bank of Russia faces. The central bank has not been timid: it has delivered real rates that are extreme by international standards. Yet disinflation has been slow and has proved fragile, since inflation rebounded after May 2026. The reasons for this lower efficiency are discussed in Section 6. But the immediate consequence is that the trade-off between price stability and activity has deteriorated: the same disinflation now costs more in terms of credit, investment and growth.
5.6 Whose inflation? The expectations gap
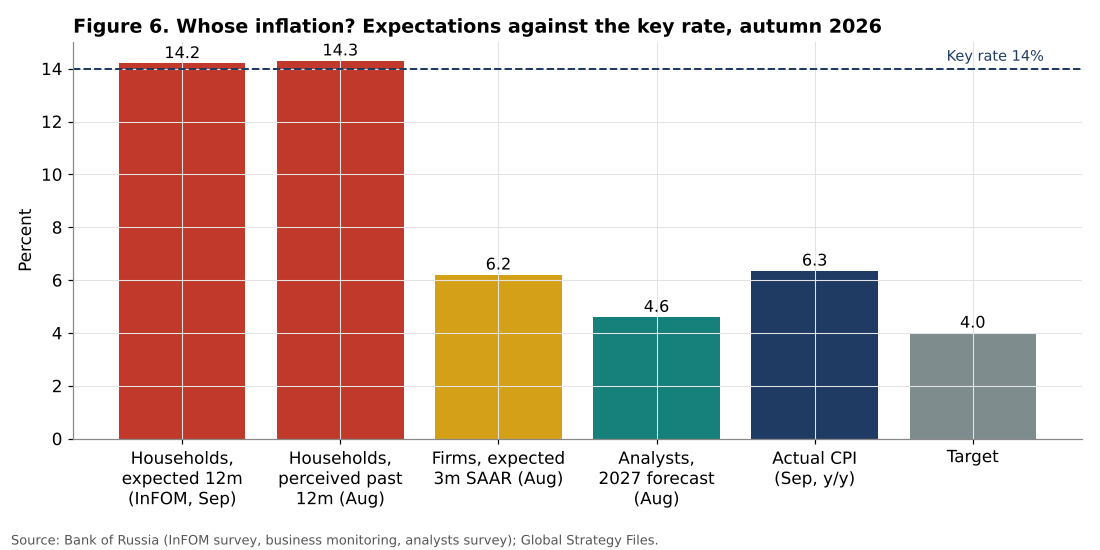
The level of the real interest rate depends on whose expectations are used. Figure 6 brings together the most recent indicators. Households surveyed by InFOM expected 14.2 percent inflation over the next 12 months in September 2026, up from 13.7 percent in August, and they perceived past inflation at 14.3 percent in August, more than double the official figure of 6.33 percent for the same month. Firms expected price growth of 6.2 percent in seasonally adjusted annualised terms over the following three months. Analysts expected inflation of 4.6 percent for 2027.
Table 4. Ex ante real key rates in September 2026 under alternative expectations
| Expectation used | Expected inflation | Implied real key rate |
|---|---|---|
| Households, next 12 months (InFOM, September) | 14.2 | -0.2 |
| Firms, next 3 months annualised (August) | 6.2 | 7.8 |
| Analysts, 2027 (August) | 4.6 | 9.4 |
| Bank of Russia target for 2027 | 4.0 | 10.0 |
Source: Bank of Russia; calculations by the author.
The gap between the first and last lines of Table 4 is ten percentage points. From the point of view of financial markets and analysts, monetary policy is extremely restrictive. From the point of view of the average household, the real return on savings and the real cost of credit are roughly zero. This has two consequences. First, the intertemporal substitution channel, by which high rates encourage households to save rather than consume, works only for those households who believe official inflation figures. The Governor noted that the propensity to save remained high in 2026, which indicates that a significant fraction of households does respond to high nominal deposit rates, but the persistence of very high expectations limits the effect. Second, as long as household expectations remain far above realised inflation, wage demands and pricing decisions in sectors close to final consumers will remain under upward pressure.
The structural nature of this gap is visible in the data. Household expected inflation averaged 13.2 percent in 2025, while realised inflation averaged 8.72 percent; in the first quarter of 2026 the expectations average was 13.4 percent against realised inflation of about 5.9 percent. The gap has therefore widened during disinflation, which suggests that household expectations are formed more by the prices of frequently purchased goods, such as fuel and food, than by the official index, in line with the evidence reviewed by Coibion, Gorodnichenko and Kamdar (2018).
5.7 The growth cost of disinflation
How much activity has been sacrificed? The available data allow an approximate answer. GDP growth fell from 4.9 percent in 2024 (latest revised estimate) to about 1.0 percent in 2025. The Bank of Russia forecasts 0.0 to 1.0 percent for 2026, after -0.2 percent year on year in the first quarter and +1.3 percent in the second. The central bank’s forecast for 2027 and 2028 is 1.5 to 2.5 percent, which can be taken as an indication of potential growth.
If potential growth is around 2 percent, the cumulative shortfall of output relative to potential over 2025 and 2026 is about 1.0 point in 2025 and about 1.5 points in 2026 (taking the midpoint of the forecast), or about 2.5 point-years. Over the same period, inflation is expected to fall from 9.52 percent in December 2024 to roughly 6.5 percent in December 2026 (midpoint of the official range), a reduction of about 3 points. The implied sacrifice ratio is therefore of the order of 0.8, meaning that each point of disinflation costs a little less than one point of annual output.
This estimate must be interpreted carefully. On the one hand, the economy was clearly operating above potential in 2023 and 2024, with record low unemployment, so part of the slowdown is a return to sustainable growth rather than a pure loss. This would lower the true sacrifice ratio. On the other hand, the composition of growth matters as much as its level. In the second quarter of 2026, final consumption rose by 4.2 percent while gross capital formation fell by 8.4 percent, and the share of investment in GDP fell from 25.2 percent to 23.3 percent in one year. Monetary tightening has therefore fallen disproportionately on investment, the component of demand that determines future capacity. This is the most serious cost of the current policy mix, because insufficient investment reduces potential growth and makes future inflation more likely when demand recovers.
The labour market confirms that the economy has cooled only moderately. Unemployment was 2.2 percent in August 2026, close to historic lows, and the number of unemployed was 1.6 million. Real wages grew by 3.4 percent year on year in June 2026, after 6.5 percent in the first half overall, and nominal wages by 9.6 percent. The Bank of Russia notes that wage growth still exceeds productivity growth by a significant margin. In such conditions, the room for a rapid fall in inflation without further cooling remains limited.
5.8 The ruble as a risk: scenario arithmetic
Although the measured pass-through has weakened, it is not zero over the full sample. Using the long-run pass-through of 0.09 from the dynamic model, the effect on annual inflation of a move in the ruble from its September 2026 average of 85.11 per dollar can be approximated. A return to 80 rubles would subtract about 0.6 points; stability around 85 would leave inflation unchanged; a depreciation to 95 would add about 1.0 point, and a depreciation to 105 about 1.9 points. Given the instability of the pass-through estimate across subsamples, these figures should be taken as orders of magnitude, but they indicate that the exchange rate is a second-order risk for 2027 compared with fiscal policy and expectations, unless a very large depreciation occurs.
6. Discussion: why has the trade-off deteriorated?
The results converge on one diagnosis: the key rate has become a less efficient instrument. The question is why. Four factors can be identified, and each points to a different policy response.
6.1 A fiscal impulse that offsets monetary restriction
When fiscal policy injects demand into the economy at the same time as monetary policy tries to withdraw it, the central bank must tighten more to achieve the same effect on aggregate demand. The draft budget estimates the 2026 federal deficit at 3.2 percent of GDP, well above the structural primary deficit of 2 percent assumed by the Bank of Russia in its July baseline. The Governor noted in September 2026 that strong lending combined with elevated budget expenditures had pushed the growth of money supply above the trajectory typical of the low-inflation period of 2016 to 2019. Defence spending of 17.1 trillion rubles planned for 2027 represents a demand flow that is largely insensitive to interest rates. In this configuration, the key rate acts only on the part of the economy that depends on market credit, which must therefore bear a disproportionate share of the adjustment. This explains why investment falls while consumption remains strong.
6.2 Subsidised and directed credit
A significant share of credit in Russia is granted at subsidised rates, notably for mortgages and for priority sectors. When borrowers do not face the market rate, a rise in the key rate does not reduce their demand for credit, and the transmission through the credit channel described by Bernanke and Gertler (1995) is weakened. The central bank’s July 2026 forecast projects growth of claims on organisations of 7 to 11 percent in 2026 and 7 to 12 percent in 2027, and the Governor described corporate lending as elevated in the summer of 2026, despite a real rate above 7 percent. The insensitivity of corporate credit to very high real rates is consistent with the low efficiency measured in Section 5.5.
6.3 Supply constraints
The summer 2026 inflation rebound was triggered not by excess demand but by a reduction in production capacity in the fuel sector. Monetary policy cannot restore destroyed refining capacity. What it can do is prevent the initial price shock from turning into persistent inflation through expectations and wage indexation, which is exactly the stated logic of the September pause. More broadly, the labour shortage, with unemployment at 2.2 percent, and restricted access to imported equipment limit the economy’s ability to respond to demand with more output rather than higher prices. In such an economy, the Phillips curve is steep: any recovery in demand quickly produces inflation.
6.4 Detached household expectations
The ten-point gap between household expectations and analysts’ forecasts documented in Section 5.6 is perhaps the most worrying finding. Expectations of 14.2 percent are higher than those recorded in 2024 and 2025, according to the Bank of Russia itself, even though realised inflation is lower. As long as households believe that prices are rising at more than twice the official rate, their behaviour in terms of saving, spending and wage demands will not fully reflect the disinflation achieved. Reducing this gap requires credibility built over time, but also communication focused on the prices households observe most directly.
6.5 Implications for the trade-off
Taken together, these four factors imply that the answer to the question in the title is not simply “cut rates” or “keep rates high”. The level of the key rate necessary to achieve 4 percent inflation depends on the fiscal impulse, the share of subsidised credit, supply constraints and the anchoring of expectations. If these factors improve, the same disinflation could be achieved with a much lower rate. If they do not, cutting the key rate quickly would risk a repeat of 2023, when inflation rose from 2.31 percent in April to 7.42 percent in December, in eight months, while the key rate was kept at 7.5 percent until July.
Three practical conclusions follow from the data.
First, the room for easing exists but is conditional. The simple rule prescribes 11.5 percent at the current inflation rate, against 14 percent actual. This gap of about 2.5 points measures the premium the central bank is paying to insure against fiscal and expectations risks. If the final budget confirms a reduction of the structural deficit and if underlying inflation returns to the 4 percent range, a gradual reduction of about 2 to 3 points over 2027 would be consistent with the historical reaction function, which is close to the Bank of Russia’s own forecast of an average key rate of 10.5 to 12.5 percent in 2027.
Second, protecting investment requires instruments other than the key rate. Since the burden of monetary tightening falls disproportionately on investment, measures that reduce the cost of capital for productive investment while limiting consumer credit growth, such as macroprudential limits on unsecured consumer lending combined with targeted support for investment in capacity, would improve the trade-off. The Governor’s stated preference for closing the gap between wages and productivity through faster productivity growth points in the same direction.
Third, fiscal consolidation is the most efficient anti-inflation instrument currently available. A reduction of the structural deficit of one percentage point of GDP would directly reduce demand pressure without passing through the weakened credit channel, and would allow a lower key rate for the same inflation outcome. The empirical results of this paper suggest that the marginal efficiency of fiscal adjustment in reducing inflation is currently higher than that of additional monetary tightening.
7. Scenarios for 2027
Combining the estimates of Section 5 with the official forecasts, three scenarios can be outlined. These are not forecasts produced by a structural model, but internally consistent narratives anchored on the quantitative results above.
Scenario A: conditional normalisation. The fuel shock dissipates during the fourth quarter of 2026, the 2027 budget reduces the structural deficit as announced, and the ruble stabilises between 80 and 90 rubles per dollar. Given an inflation persistence half-life of about 11 months, annual inflation would end 2026 around 6.5 percent and fall towards 4.5 to 5 percent by the end of 2027. To reach exactly 4 percent in December 2027, price growth would need to average about 0.33 percent per month in seasonally adjusted terms throughout 2027, which is plausible but demanding. In this scenario, the key rate could be reduced towards 11 to 12 percent by the end of 2027, and growth would recover towards 1.5 to 2 percent as investment stabilises.
Scenario B: fiscal slippage and sticky expectations. The deficit remains near 3 percent of GDP in 2027, corporate credit continues to grow strongly and household expectations remain above 13 percent. Underlying inflation stays in the 5 to 6 percent range. The central bank would then have to keep the key rate around 14 percent or even raise it, prolonging real rates of 8 to 9 percent. Investment would continue to contract and growth would remain below 1 percent. This scenario corresponds to the “tighter monetary policy” explicitly mentioned in the September 2026 press release.
Scenario C: external shock. A sharp fall in oil prices or a renewed tightening of sanctions would weaken the ruble towards 100 to 105 per dollar and reduce budget revenues. Using the long-run pass-through estimate, the direct effect on inflation would be around 1.5 to 2 points, but the second-round effects through expectations, already very high, could be larger. The central bank would face the most difficult version of the dilemma: tighter policy in an economy already near stagnation.
The relative probabilities of these scenarios depend mainly on fiscal decisions, which is the central policy message of this paper.
8. Conclusion
This paper set out to measure, rather than assert, the terms of the trade-off facing the Bank of Russia. The data from January 2014 to September 2026 lead to five conclusions.
First, Russian monetary policy has been exceptionally restrictive since mid-2024. The ex post real key rate averaged 10.3 percent between July 2024 and December 2025 and was still 7.65 percent in September 2026, compared with a neutral range of 3.5 to 4.5 percent.
Second, policy is several points tighter than a simple rule that described the Bank’s behaviour well in 2017 to 2019. This premium reflects risks related to fiscal policy, expectations and the labour market rather than a mechanical response to current inflation.
Third, the exchange-rate channel, historically the most powerful transmission mechanism in Russia, has weakened considerably since 2020, at least as measured against the dollar.
Fourth, disinflation has become much more costly in terms of monetary effort: the 2025 to 2026 episode required roughly five to six times more real tightness per point of disinflation than the 2015 to 2018 episode.
Fifth, household expectations are disconnected from realised inflation by about eight points, which means that for many households the real interest rate is close to zero despite a 14 percent key rate.
The answer to the question “how to stabilise prices without suffocating activity” is therefore primarily outside the narrow scope of the key rate. The level of the rate required to bring inflation back to 4 percent depends on fiscal consolidation, the reduction of subsidised credit distortions, the relief of supply constraints and the re-anchoring of household expectations. Without progress on these fronts, the central bank can only choose between persistent inflation and persistent stagnation of investment. With progress, the data suggest that a key rate of around 11 to 12 percent by the end of 2027 would be compatible with the inflation target, and that growth could recover towards its potential.
The next Board meeting, on 23 October 2026, together with the new medium-term forecast, will provide the first test of these conclusions. The indicators to watch are, in order of importance: the structural fiscal balance in the final budget, the monthly seasonally adjusted price growth after the fuel shock, household inflation expectations, and the pace of corporate credit growth.
Need this analysis for your organisation?
We prepare confidential briefings, executive talks and studies on countries, markets and policies, built on the same method as this article.
Request a briefingSupport independent analysis
Our studies are free to read and carry no advertising. If this one was useful, a small contribution helps us publish the next.
Support our workGo further: books by Global Strategy Files


Frequently asked questions
Why did the Bank of Russia stop cutting its key rate in September 2026?
The Bank of Russia paused its easing cycle and held the key rate at 14 percent because annual inflation rose again, from 5.31 percent in May to 6.35 percent in September 2026. Fiscal expansion, supply constraints and high household inflation expectations also made further cuts risky.
How restrictive is Russian monetary policy in 2026?
Russian monetary policy is very restrictive. The ex post real key rate averaged 10.3 percent between July 2024 and December 2025 and was still 7.65 percent in September 2026, well above the Bank of Russia’s neutral real rate range of 3.5 to 4.5 percent.
Does the ruble exchange rate still drive inflation in Russia?
Much less than before. Before 2020 the link between ruble depreciation and inflation was strong, with a slope of 0.17 and an R squared of 0.79. Since 2020 the measured relationship against the dollar has almost disappeared, with a slope close to zero and an R squared of 0.00.
Why is disinflation in Russia so costly?
Disinflation in Russia is costly because transmission channels have weakened. In 2025 and 2026 inflation fell 0.36 points per month with an average real rate of 10.1 percent, while in 2015 to 2018 it fell 0.43 points per month with a real rate of only 2.2 percent.
Methodological note
All calculations in this paper were performed by the author on the raw official series listed in Section 4. The monthly average key rate was computed from daily values. Regressions were estimated by ordinary least squares with Newey and West standard errors (12 lags). The simple rule uses a nominal neutral rate of 8 percent and an inflation coefficient of 1.5. Figures and tables were produced from the same dataset. Data are available from the author on request.
References
Ball, L. (1994). What determines the sacrifice ratio? In N. G. Mankiw (Ed.), Monetary Policy (pp. 155 to 193). University of Chicago Press.
Bank of Russia. (2026a). Bank of Russia keeps the key rate at 14.00% p.a. Press release, 11 September 2026.
Bank of Russia. (2026b). Statement by Bank of Russia Governor Elvira Nabiullina in follow-up to Board of Directors meeting on 11 September 2026.
Bank of Russia. (2026c). Commentary on the medium-term forecast, 5 August 2026.
Bank of Russia. (2026d). Inflation expectations and consumer sentiment, August 2026 and September 2026 releases.
Bank of Russia. (2026e). Statistical database: key rate, inflation and key rate, official exchange rates. Accessed 18 October 2026.
Bernanke, B. S., and Gertler, M. (1995). Inside the black box: The credit channel of monetary policy transmission. Journal of Economic Perspectives, 9(4), 27 to 48.
Blanchard, O. (2004). Fiscal dominance and inflation targeting: Lessons from Brazil. NBER Working Paper No. 10389.
Blanchard, O. J., and Galí, J. (2009). The macroeconomic effects of oil price shocks: Why are the 2000s so different from the 1970s? In J. Galí and M. Gertler (Eds.), International Dimensions of Monetary Policy (pp. 373 to 421). University of Chicago Press.
Campa, J. M., and Goldberg, L. S. (2005). Exchange rate pass-through into import prices. Review of Economics and Statistics, 87(4), 679 to 690.
Clarida, R., Galí, J., and Gertler, M. (1999). The science of monetary policy: A New Keynesian perspective. Journal of Economic Literature, 37(4), 1661 to 1707.
Coibion, O., Gorodnichenko, Y., and Kamdar, R. (2018). The formation of expectations, inflation, and the Phillips curve. Journal of Economic Literature, 56(4), 1447 to 1491.
Laubach, T., and Williams, J. C. (2003). Measuring the natural rate of interest. Review of Economics and Statistics, 85(4), 1063 to 1070.
Newey, W. K., and West, K. D. (1987). A simple, positive semi-definite, heteroskedasticity and autocorrelation consistent covariance matrix. Econometrica, 55(3), 703 to 708.
Sargent, T. J., and Wallace, N. (1981). Some unpleasant monetarist arithmetic. Federal Reserve Bank of Minneapolis Quarterly Review, 5(3), 1 to 17.
Taylor, J. B. (1993). Discretion versus policy rules in practice. Carnegie-Rochester Conference Series on Public Policy, 39, 195 to 214.
Taylor, J. B. (2000). Low inflation, pass-through, and the pricing power of firms. European Economic Review, 44(7), 1389 to 1408.
TASS. (2026). Key takeaways from Russia’s draft federal budget for 2027 to 2029. 30 September 2026.
The Star / Xinhua. (2026). Russia’s GDP grows 1.3 pct in Q2. 3 October 2026.
Trading Economics. (2026). Russia unemployment rate, August 2026.
The Moscow Times. (2026). Real wage growth in Russia slowed to 3.4% in June. 2 September 2026.
