
China: Can Subsidies Change the Growth Model?


Can Subsidies Change China’s Growth Model? An Empirical Look at Consumption Support in 2025 and 2026
Driss EFFINA, PhD
Independent Researcher, Global Strategy Files
Reading time: 26 minutes
Key takeaways
- Household consumption was 40.0 percent of China's GDP in 2024 against 56.6 percent for the world, a gap of about 23 trillion yuan a year.
- The consumption share has risen only 0.39 points a year since 2010, so reaching 50 percent at this pace would take about 26 years.
- Appliance sales rose 11.0 percent in 2025 with trade-in subsidies, then fell 5.6 percent in January to August 2026, erasing about 56 percent of the gain.
- The 125 billion yuan of subsidies in 2026 equal 0.09 percent of GDP and about 0.5 percent of the annual consumption gap.
Abstract
For more than a decade, Chinese leaders have promised to rebalance the economy towards household consumption. In 2025 and 2026 this promise took a concrete form: a national programme of subsidies for the trade-in of consumer goods, interest subsidies on consumer loans, and higher social spending. On 9 October 2026 the Ministry of Finance pledged a “more proactive” fiscal policy to expand domestic demand. This paper asks whether these instruments can durably change China’s growth model. Using World Bank national accounts data from 1995 to 2024, monthly retail sales from the National Bureau of Statistics for 2025 and 2026, and official budget figures, I measure the size of the consumption gap, the effect and the payback of the trade-in programme, and the scale of effort required for genuine rebalancing. Five findings emerge. First, household consumption represented 40.0 percent of China’s GDP in 2024, compared with 56.6 percent for the world economy; the gap is equivalent to about 23 trillion yuan, or 3.3 trillion dollars, per year. Second, since its low point of 34.6 percent in 2010, the consumption share has risen by only 0.39 percentage points per year; at this pace, reaching 50 percent would take about 26 years. Third, the trade-in subsidies produced a visible boom in subsidised categories in 2025, followed by a payback: household appliance sales rose 11.0 percent in 2025 and then fell 5.6 percent in January to August 2026, erasing about 56 percent of the earlier gain, while car sales fell 13.9 percent. Fourth, total retail sales growth fell from 6.4 percent in May 2025 to 0.4 percent in August 2026. Fifth, the subsidies are small relative to the problem: the 125 billion yuan allocated in 2026 equal 0.09 percent of GDP and about 0.5 percent of the annual consumption gap. Reaching a consumption share of 45 percent in five years would require household consumption to grow by about 6.5 percent per year in nominal terms, against 4.4 percent per capita in 2025. Subsidies can shift purchases in time; changing the growth model requires a durable transfer of income to households.
Keywords: China, household consumption, rebalancing, trade-in subsidies, fiscal policy, saving rate, social spending, retail sales, growth model.
1. Introduction
China’s economy has an unusual structure. It invests and saves far more than almost any other large economy and consumes far less. This structure served China well during its decades of rapid catch-up, when high investment built infrastructure, factories and cities. It has become a constraint as the property sector contracts, local governments face heavy debts and the returns on investment decline. The alternative engine, household consumption, has remained weak.
The Chinese government recognises the problem. Since 2024, it has deployed a series of measures to support consumption. The most visible is the consumer goods trade-in programme, which subsidises the replacement of old household appliances, cars, phones and other goods. In 2026 the programme was continued with 125 billion yuan of subsidies, which the Ministry of Finance says helped generate about 1.1 trillion yuan in sales. The government has also extended interest subsidies to personal consumption loans and, from 1 October 2026, introduced a one percentage point interest subsidy on eligible first-time home mortgages. Health and social security spending rose by 10.8 and 7.6 percent respectively in the first half of 2026.
Yet retail sales growth slowed to 0.4 percent in August 2026, one of the weakest readings in years. The question addressed in this paper is therefore whether public support can change China’s growth model, or whether it merely shifts spending in time.
Commentaries on this question often fall into two camps: those who see each new stimulus as a turning point, and those who dismiss all measures as insufficient. This paper attempts to measure the effects and the orders of magnitude involved, using official data and transparent calculations.
The paper is organised as follows. Section 2 presents the context. Section 3 reviews the literature. Section 4 describes the data and methods. Section 5 presents the results, including an accounting of household income and consumption in 2025 and a look at services. Section 6 discusses the policy implications, Section 7 presents scenarios, and Section 8 concludes.
2. Context: an economy built on investment
China’s growth in 2025 reached 5.0 percent according to the National Bureau of Statistics, and GDP reached 140.2 trillion yuan. In the first half of 2026, growth was 4.7 percent. The headline figures hide a significant imbalance. Real estate development investment fell by 17.2 percent in 2025, and fixed asset investment fell by 7.2 percent in the first eight months of 2026. Consumer prices were unchanged in 2025. Exports, by contrast, boomed, and the trade surplus reached a record of about 1.2 trillion dollars in 2025.
Household income growth has been moderate: per capita disposable income rose by 5.0 percent in 2025 to 43,377 yuan, while per capita consumption expenditure rose by 4.4 percent to 29,476 yuan. The share of income consumed therefore fell slightly, from 68.3 percent in 2024 to 68.0 percent in 2025. Households continue to save a large share of their income, partly for precautionary reasons linked to health care, education and retirement, and partly because the fall in property prices has reduced their wealth.
The population is also declining. At the end of 2025 China had 1,404.89 million inhabitants, 3.39 million fewer than a year earlier. An ageing population with limited pensions tends to save more, not less.
The fiscal stance for 2026 is expansionary: a deficit target of about 4 percent of GDP, or 5.89 trillion yuan, and general public budget expenditure expected to exceed 30 trillion yuan for the first time. But a large part of fiscal resources continues to support investment, local government finances and the recapitalisation of state banks, including a capital injection of 360 billion yuan into eight state-owned banks and insurers.
3. Literature review
Three strands of research inform the analysis.
The first concerns the causes of China’s high saving rate. Modigliani and Cao (2004) linked China’s high household saving to rapid income growth and demographic change within the life-cycle framework. Wei and Zhang (2011) proposed that the competition for marriage partners in a context of skewed sex ratios raised household saving. Chamon and Prasad (2010) emphasised precautionary saving in response to rising private costs of housing, education and health care. These explanations suggest that consumption will not rise durably without changes in income distribution, social insurance and household balance sheets.
The second strand concerns the macroeconomic consequences of the imbalance. Pettis (2013) argued that China’s low consumption share reflects policies that transfer income from households to producers and the state, through low interest rates, an undervalued currency and limited social spending, and that rebalancing requires reversing these transfers. The IMF has repeatedly recommended a shift of fiscal resources towards social spending and households to reduce excess saving and the external surplus.
The third strand concerns the effect of temporary purchase subsidies. Mian and Sufi (2012) studied the US “Cash for Clunkers” programme of 2009 and found that it pulled forward car purchases by a few months, with almost all of the additional sales reversed within a year. This intertemporal substitution effect is central to evaluating China’s trade-in programme.
4. Data and methodology
4.1 Data
- National accounts: World Bank World Development Indicators: household final consumption, gross national saving and gross capital formation as a percentage of GDP, China 1995 to 2024, and household consumption for comparator economies in 2024.
- Retail sales: National Bureau of Statistics of China, monthly year-on-year growth of total retail sales of consumer goods, January 2025 to August 2026; category growth (household appliances, telecommunication equipment, motor vehicles) for enterprises above designated size.
- Income and consumption: National Bureau of Statistics, per capita disposable income and consumption expenditure, 2024 and 2025.
- Fiscal data: Ministry of Finance statements of October 2026 (trade-in subsidies, deficit, expenditure, interest subsidies) and NBS GDP for 2025.
Data were collected on 18 October 2026.
4.2 Methods
Consumption gap. I compute the difference between China’s household consumption share and the world average, and convert it into yuan and dollars using 2025 GDP.
Trend of rebalancing. I compute the average annual change in the consumption share since its low point in 2010 and the number of years needed to reach given targets at that pace.
Payback analysis. Using annual and year-to-date growth rates, I construct an index of household appliance sales (2024 = 100) and compute the share of the 2025 gain reversed in 2026.
Scale analysis. I compare the size of the trade-in programme with GDP, the government deficit and the consumption gap.
Simulation. I compute the annual nominal growth of household consumption required to raise the consumption share from 40 percent to 45 or 50 percent in five or ten years, assuming nominal GDP growth of 4 or 5 percent. I also compute the size of transfers to households needed to raise the consumption share by 5 points, under alternative marginal propensities to consume.
Limitations. World Bank data end in 2024. Retail sales cover goods and catering but not most services, which are a growing part of consumption. Category data cover enterprises above a designated size. The simulation is an accounting exercise, not a behavioural model.
5. Results
5.1 The size of the consumption gap
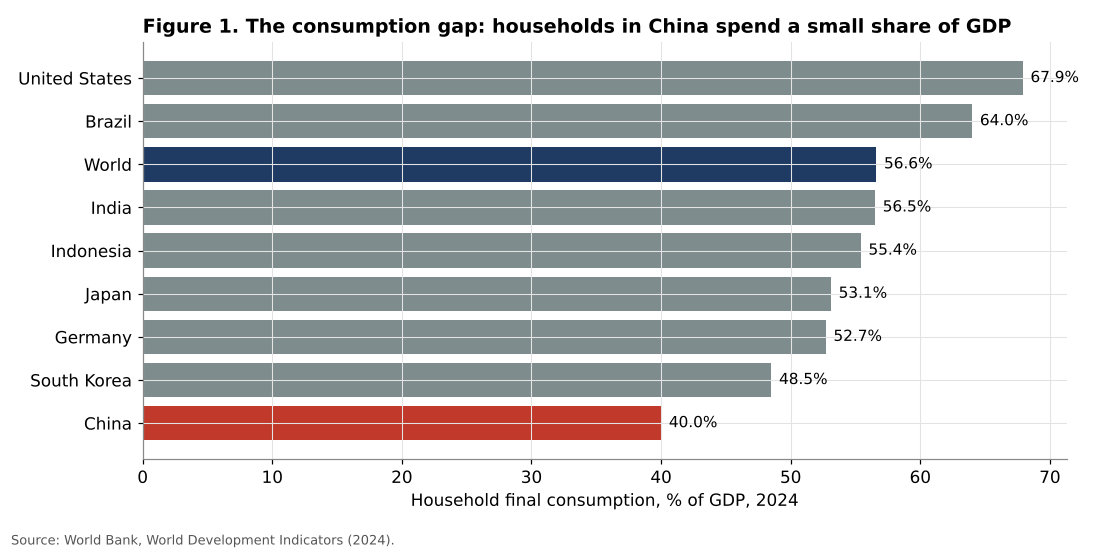
In 2024, household final consumption represented 40.0 percent of China’s GDP, compared with 56.6 percent for the world, 53.1 percent in Japan, 52.7 percent in Germany, 48.5 percent in South Korea, 56.5 percent in India and 67.9 percent in the United States. China has the lowest share among the economies compared, including East Asian economies with similar cultural attitudes to saving.
The gap with the world average, 16.6 percentage points of GDP, is equivalent to about 23.3 trillion yuan per year at 2025 GDP, or about 3.3 trillion dollars. To put this figure in perspective, it is larger than the entire GDP of most countries. It also helps to explain China’s trade surplus: an economy that consumes much less than it produces must either invest the difference or export it.
Table 1. Household consumption and national saving, % of GDP, 2024
| Economy | Household consumption | Gross national saving |
|---|---|---|
| China | 40.0 | 42.7 |
| South Korea | 48.5 | 35.0 |
| Germany | 52.7 | 27.1 |
| Japan | 53.1 | 32.1 |
| India | 56.5 | 34.7 |
| World | 56.6 | 26.0 |
| United States | 67.9 | 16.6 |
Source: World Bank, World Development Indicators.
5.2 Rebalancing at a glacial pace
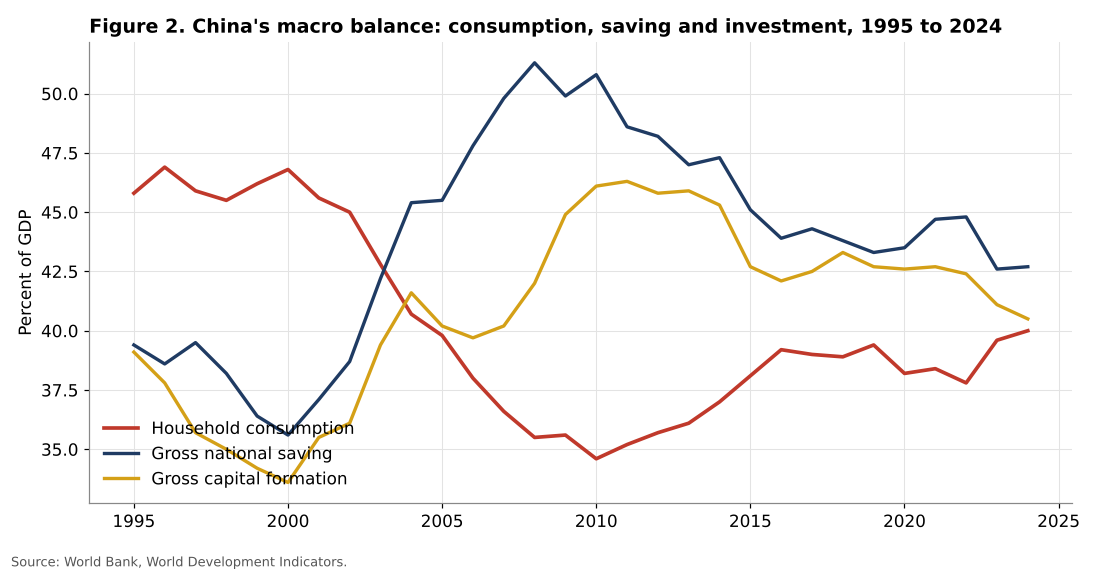
Figure 2 shows the evolution of China’s macroeconomic balance since 1995. Household consumption fell from about 46 percent of GDP in the late 1990s to a low of 34.6 percent in 2010, as investment rose to 46 percent and national saving exceeded 50 percent. Since 2010, the consumption share has recovered, but slowly: it reached 40.0 percent in 2024. National saving fell from 51.3 percent in 2008 to 42.7 percent, and investment from 46.3 percent in 2011 to 40.5 percent.
The average increase in the consumption share since 2010 has been 0.39 percentage points per year. At this pace, China would need about 26 years to reach a consumption share of 50 percent, still below the world average, and more than 40 years to reach the world average. Moreover, the trend has not been regular: the share fell in 2020 and 2022, during the pandemic, before rising again in 2023 and 2024.
The structure of saving and investment has changed less than that of consumption. In 2024, China still saved 42.7 percent of its GDP, against a world average of 26.0 percent, and invested 40.5 percent, against 26.3 percent. The difference between saving and investment, about 2 points of GDP, corresponds approximately to the current account surplus.
5.3 The trade-in programme: a boom followed by a payback
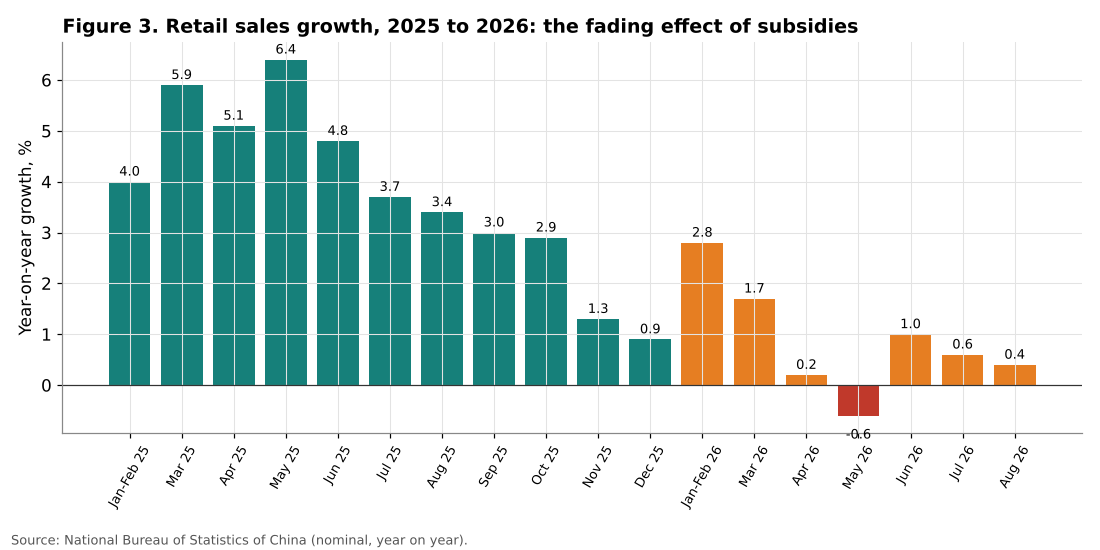
The national trade-in programme was scaled up in 2025 with 300 billion yuan of ultra-long special treasury bonds. Its effect on retail sales is clearly visible in Figure 3. Total retail sales growth accelerated from 4.0 percent in January and February 2025 to 5.9 percent in March and 6.4 percent in May, the highest rate of the period. Sales in the subsidised categories, including household appliances and communication devices, rose by as much as 53 percent in May 2025, according to official reports, and contributed 1.9 percentage points to total retail growth.
The effect then faded. Retail sales growth slowed to 3.0 percent in September 2025, 1.3 percent in November and 0.9 percent in December. In 2026, despite the continuation of the programme with a smaller budget, growth slowed further: 2.8 percent in January and February, 0.2 percent in April, -0.6 percent in May and 0.4 percent in August.
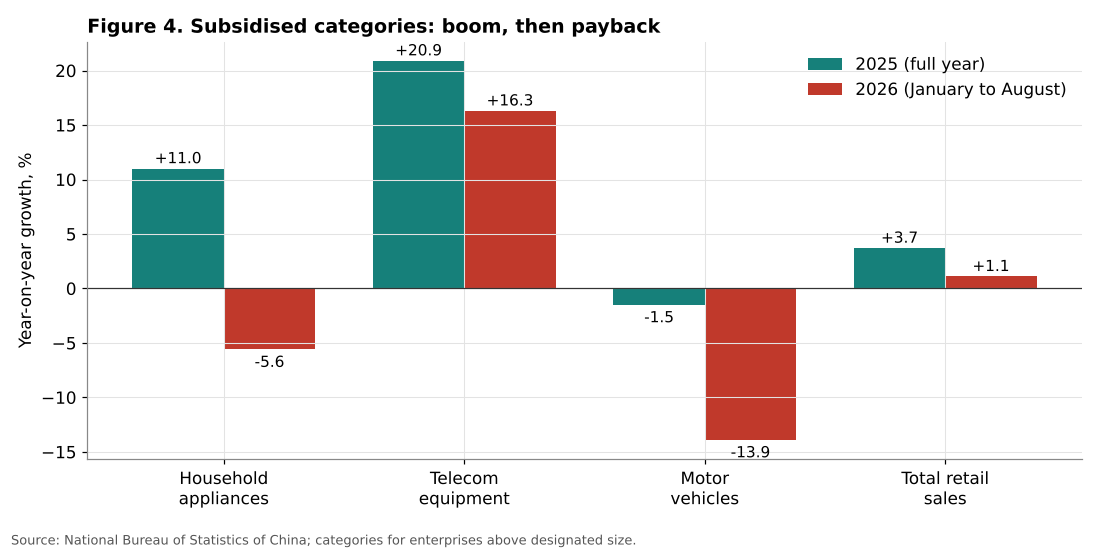
The category data reveal the mechanism. Household appliance sales rose by 11.0 percent in 2025 as a whole, but already fell by 14.6 percent in October 2025 and 18.7 percent in December, when the comparison base included the subsidy-driven purchases of late 2024. In January to August 2026, they fell by 5.6 percent. Using 2024 as a base of 100, the index of appliance sales rose to 111.0 in 2025 and would fall to about 104.8 in 2026 if the year-to-date decline persists. About 56 percent of the 2025 gain would therefore be reversed within a year.
Car sales show an even sharper reversal: down 1.5 percent in 2025 and down 13.9 percent in January to August 2026, with declines of 18.5 percent in August. Only telecommunication equipment, whose sales rose by 20.9 percent in 2025 and 16.3 percent in January to August 2026, kept growing, reflecting subsidies for phones introduced in 2025 and the renewal cycle linked to new devices.
Table 2. Retail sales growth by category, % year on year
| Category | 2025 | Oct 2025 | Dec 2025 | Mar 2026 | Apr 2026 | Jan to Aug 2026 |
|---|---|---|---|---|---|---|
| Total retail sales | +3.7 | +2.9 | +0.9 | +1.7 | +0.2 | +1.1 |
| Household appliances | +11.0 | -14.6 | -18.7 | -5.0 | -15.1 | -5.6 |
| Telecommunication equipment | +20.9 | +23.2 | +20.9 | +27.3 | +6.2 | +16.3 |
| Motor vehicles | -1.5 | -6.6 | -5.0 | -11.8 | -15.3 | -13.9 |
Source: National Bureau of Statistics of China.
This pattern is consistent with the evidence from the US “Cash for Clunkers” programme studied by Mian and Sufi (2012): purchase subsidies for durable goods mainly shift purchases forward in time. Households that replaced their refrigerator or car in 2025 do not need to replace it again in 2026. The programme raised the level of sales temporarily but did not raise the trend.
The ministry’s figure of 1.1 trillion yuan of sales generated by 125 billion yuan of subsidies in 2026 implies 8.8 yuan of sales per yuan of subsidy. This ratio measures gross sales of subsidised goods, not additional sales: many of these purchases would have occurred without the subsidy, and some were brought forward from future years. The net effect on consumption is therefore much smaller than the headline ratio suggests.
5.4 The scale problem
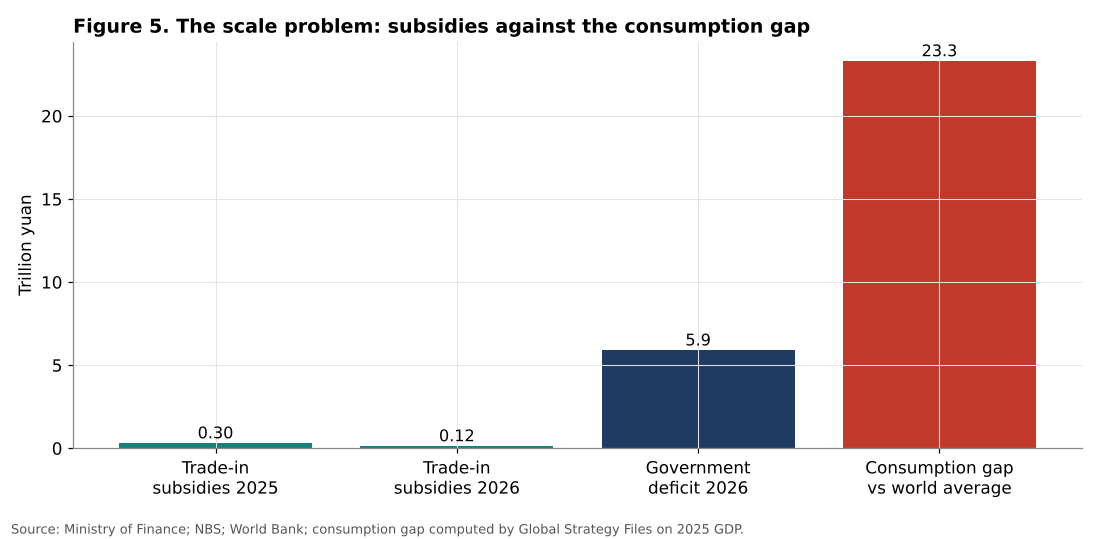
The trade-in subsidies are small relative to the macroeconomic problem they are meant to address.
Table 3. Orders of magnitude (trillion yuan)
| Item | Value | % of 2025 GDP |
|---|---|---|
| Trade-in subsidies, 2025 | 0.30 | 0.21 |
| Trade-in subsidies, 2026 | 0.125 | 0.09 |
| Government deficit target, 2026 | 5.89 | about 4.0 |
| Consumption gap with world average | 23.3 | 16.6 |
Source: Ministry of Finance; NBS; World Bank; calculations by the author.
The 2026 trade-in programme represents 0.09 percent of GDP and about 0.5 percent of the annual consumption gap with the world average. Even the larger 2025 programme represented only 0.21 percent of GDP. By comparison, the government deficit is about 4 percent of GDP. The programme is therefore not designed, and could not be designed at this scale, to change the structure of the economy. It is a cyclical support for specific industries.
5.5 What genuine rebalancing would require
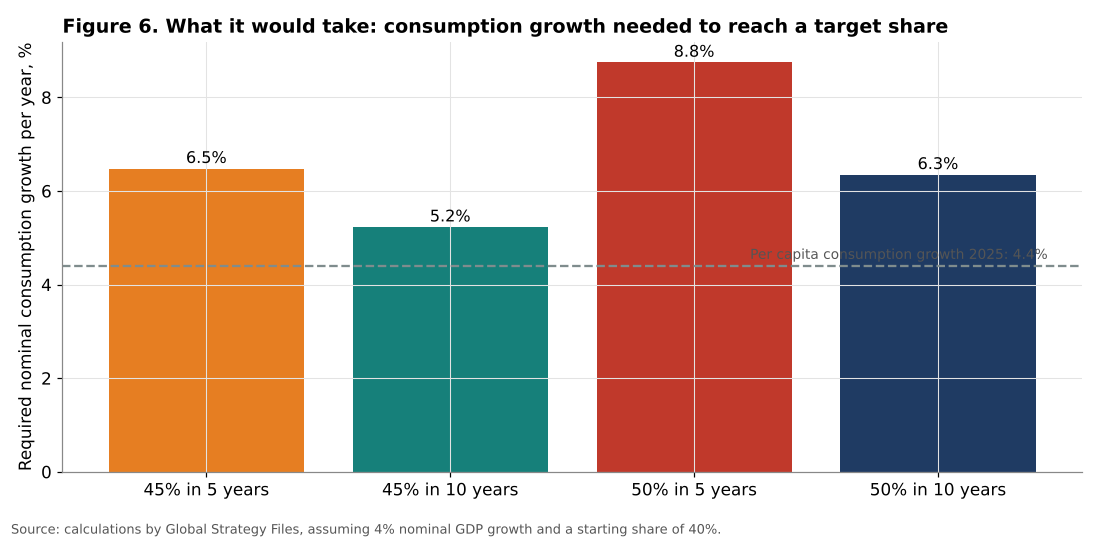
How fast would consumption need to grow to change the growth model? The arithmetic is straightforward. If nominal GDP grows by 4 percent per year, raising the household consumption share from 40 to 45 percent in five years requires nominal consumption growth of about 6.5 percent per year. Reaching 50 percent in five years would require 8.8 percent per year; in ten years, 6.4 percent per year. With nominal GDP growth of 5 percent, these requirements rise by about one percentage point.
Table 4. Required nominal household consumption growth per year
| Target share | Horizon | Nominal GDP growth 4% | Nominal GDP growth 5% |
|---|---|---|---|
| 45% | 5 years | 6.5% | 7.5% |
| 45% | 10 years | 5.2% | 6.2% |
| 50% | 5 years | 8.8% | 9.8% |
| 50% | 10 years | 6.4% | 7.4% |
Source: calculations by the author.
In 2025, per capita consumption expenditure grew by 4.4 percent in nominal terms, and with a declining population, total household consumption grew slightly less. In 2026, retail sales are growing by about 1 percent. The gap between what is needed and what is happening is therefore between 2 and 5 percentage points of consumption growth per year.
Closing this gap requires a durable increase in household income relative to GDP, or a durable fall in the household saving rate. One way to estimate the effort involved is to consider transfers to households. If households spend 60 percent of each additional yuan of transfer income (a marginal propensity to consume of 0.6), raising the consumption share by 5 percentage points of GDP would require permanent transfers of about 8.3 percent of GDP. With a propensity of 0.8, typical for low-income households, the required transfers fall to about 6.2 percent of GDP; with 0.4, they rise to 12.5 percent. These are very large amounts, comparable to or larger than the entire government deficit, which explains why rebalancing has been so slow.
5.6 Income, consumption and GDP in 2025: did rebalancing advance?
A simple accounting exercise shows whether households gained ground relative to the economy in 2025. Nominal GDP rose from 134.9 trillion yuan in 2024 to 140.2 trillion in 2025, an increase of about 3.9 percent, a low figure that reflects the absence of inflation. Per capita disposable income rose by 5.0 percent and per capita consumption by 4.4 percent. Since the population fell by 0.24 percent, total household disposable income rose by about 4.75 percent and total household consumption by about 4.15 percent.
Two conclusions follow. First, household income grew faster than nominal GDP in 2025, by almost one percentage point, which means that the household share of national income increased slightly. This is a positive sign: it reflects in part the deflationary environment, in which wages held up better than corporate prices and profits. Second, households saved most of this gain. Consumption grew only slightly faster than nominal GDP, so the consumption share of GDP rose by perhaps 0.1 to 0.2 points, in line with the slow trend since 2010. The average propensity to consume fell from 68.3 to 68.0 percent of disposable income.
The 2025 experience therefore illustrates the central difficulty. Even when household income rises relative to GDP, households do not necessarily spend the gain. Without a reduction of the motives for precautionary saving, higher income translates largely into higher saving. This is consistent with the literature reviewed in Section 3 and with the weak response of consumption to the trade-in programme.
5.7 Services: the missing piece of the picture
Retail sales statistics mainly cover goods and catering, while a growing share of household spending goes to services such as travel, entertainment, health, education and personal services. The data for 2026 suggest that services hold up better than goods. In January to August 2026, retail sales of goods rose by only 1.0 percent and catering income by 2.4 percent, but online sales of services rose by 5.1 percent, against 4.3 percent for online sales of goods. According to official figures, combined retail sales of goods and services rose by about 2.5 percent in the first eight months of 2026.
This pattern has two implications. First, the weakness of goods consumption is partly the mirror image of the trade-in programme: after a year in which households brought forward purchases of durable goods, spending shifts back towards services. Second, policies aimed at services, such as support for elderly care, childcare, tourism and cultural activities, may be more effective at raising consumption than subsidies for durable goods, because services cannot be stockpiled and are therefore less subject to payback effects.
Services are also more labour-intensive than manufacturing, so a shift of demand towards services would raise employment and household income, creating a virtuous circle. This is one of the reasons why economists who advocate rebalancing emphasise the development of the service sector alongside income transfers.
6. Discussion
6.1 Subsidies versus structural transfers
The evidence draws a clear distinction between two types of instruments. Temporary purchase subsidies, such as the trade-in programme, can raise sales of specific goods for a few months, but they mainly shift spending in time and are followed by a payback. They do not change the share of income that households consume. Structural transfers, such as higher pensions, better health insurance, unemployment benefits and support for families, change households’ expected lifetime income and reduce the need for precautionary saving. They are the instruments that, according to the literature on Chinese saving, can durably raise consumption.
The data for 2026 show that the government has begun to move in this direction. Health spending rose by 10.8 percent and social security and employment spending by 7.6 percent in the first half, much faster than total expenditure (1.5 percent). The new interest subsidy on first-time mortgages and the expansion of consumer loan subsidies also aim to support households. But the scale remains modest relative to the 16.6 point consumption gap.
6.2 Why the old model persists
Three factors explain the persistence of the investment-led model.
First, the institutional incentives of local governments remain oriented towards investment and production, which generate measurable growth and tax revenue. Social spending generates fewer immediate returns.
Second, the property downturn has weakened household balance sheets. With housing representing the main asset of Chinese households, falling prices reduce wealth and encourage saving, offsetting the effects of subsidies.
Third, the export boom reduces the urgency of rebalancing. When exports grow at double-digit rates, as in 2026, the economy can meet its growth target without a strong recovery in consumption. This is precisely why trading partners are concerned: China’s weak domestic demand is exported through the trade surplus.
6.3 Policy implications
The analysis suggests that a genuine change in the growth model would require three types of measures:
1. A permanent increase in social transfers, particularly pensions for rural residents and health insurance, to reduce precautionary saving. The amounts involved are several percent of GDP over a decade. 2. A rebalancing of income distribution between enterprises, the state and households, for example through higher dividend payouts by state-owned enterprises to the social security fund and a reduction in the tax burden on labour income. 3. A stabilisation of the property market and household wealth, which would reduce the pressure to save.
Temporary subsidies can complement these measures, but they cannot replace them.
6.4 Urbanisation and the hukou system as consumption policy
A further structural factor deserves attention. China’s household registration system, the hukou, ties access to many public services, such as schooling for children, health insurance and social housing, to a person’s place of registration. Around 300 million migrant workers live and work in cities where they do not have local registration. Because they have limited access to local public services and face uncertainty about their long-term status, they tend to save a high share of their income and send part of it to their places of origin.
Granting migrant workers full access to urban public services would therefore be one of the most powerful consumption policies available. It would reduce precautionary saving, encourage families to settle in cities and raise demand for housing, education and services. The fiscal cost would be significant, because cities would have to finance additional schools, hospitals and social benefits, but this cost should be compared with the macroeconomic gain of a higher consumption share. Recent reforms have relaxed hukou restrictions in many cities, but access to services in the largest cities remains limited.
6.5 The external dimension
The weakness of domestic consumption is not only a domestic issue. As the previous article in this series showed, China’s goods trade surplus reached about 1.2 trillion dollars in 2025, about 1 percent of world GDP, and is on course for a new record in 2026. A country that saves 42.7 percent of its GDP and invests 40.5 percent must export the difference. Rebalancing towards consumption would therefore also reduce the external surplus and the trade tensions it generates with the European Union, the United States and emerging economies. In this sense, the success or failure of China’s consumption policies matters for the entire global economy.
6.6 Indicators to watch
Several indicators will show whether China is moving beyond temporary support towards structural rebalancing. The first is the growth of household disposable income relative to nominal GDP: a sustained gap of one point or more in favour of households, as in 2025, is a necessary condition. The second is the average propensity to consume, which must rise rather than fall; a reversal of the decline from 68.3 to 68.0 percent observed in 2025 would be a meaningful signal. The third is the composition of the budget: the share of social security, health and education in general public expenditure, compared with spending on infrastructure and industrial support. The fourth is the reform of the hukou system in large cities, measured by the number of migrant workers gaining access to local public services. The fifth is the household consumption share in the national accounts for 2025 and 2026, when the World Bank and the National Bureau of Statistics publish them. If these indicators move together, the change in the growth model will be real; if only retail sales of subsidised goods move, it will not.
7. Scenarios to 2030
Scenario A: continuity. Subsidies continue at a modest scale, social spending rises gradually, and the consumption share increases by about 0.4 points per year, reaching about 42 to 43 percent by 2030. The economy remains dependent on investment and exports, and external surpluses remain large.
Scenario B: structural shift. The government commits to raising transfers to households by about 1 percent of GDP per year for five years, financed by a reallocation of spending from investment and by higher contributions from state enterprises. Consumption growth reaches 6 to 7 percent per year in nominal terms, and the consumption share approaches 45 percent by 2030. The trade surplus narrows and tensions with trading partners ease.
Scenario C: stagnation. The property downturn deepens, deflationary pressures persist, and households increase their saving. Consumption growth remains near current levels, the consumption share stagnates around 40 percent, and growth depends increasingly on exports, which intensifies trade frictions.
8. Conclusion
Can public support change China’s growth model? The evidence presented in this paper leads to a clear answer: not at its current scale and in its current form.
First, the consumption gap is enormous: household consumption is 40 percent of GDP, 16.6 points below the world average, equivalent to about 23 trillion yuan per year.
Second, rebalancing has been very slow, at about 0.4 points per year since 2010, which would take a quarter of a century to reach a share of 50 percent.
Third, the trade-in subsidies have produced a temporary boom followed by a payback: appliance sales rose 11 percent in 2025 and then fell 5.6 percent in 2026, reversing more than half of the gain, and total retail sales growth fell from 6.4 percent to 0.4 percent.
Fourth, the subsidies are tiny relative to the problem: 0.09 percent of GDP in 2026, about 0.5 percent of the annual consumption gap.
Fifth, genuine rebalancing would require household consumption to grow 2 to 5 points faster than it does today, which implies durable transfers to households of several percent of GDP.
Subsidies can bring purchases forward; only a durable redistribution of income towards households can change the growth model. Until that happens, China’s growth will continue to depend on investment and exports, with the domestic and international tensions that this implies.
Need this analysis for your organisation?
We prepare confidential briefings, executive talks and studies on countries, markets and policies, built on the same method as this article.
Request a briefingSupport independent analysis
Our studies are free to read and carry no advertising. If this one was useful, a small contribution helps us publish the next.
Support our workGo further: books by Global Strategy Files


Frequently asked questions
How low is household consumption in China?
Household consumption represented 40.0 percent of China’s GDP in 2024, compared with 56.6 percent for the world economy. The gap is equivalent to about 23 trillion yuan, or 3.3 trillion dollars, per year, and the share has risen by only 0.39 points a year since 2010.
Did China’s trade-in subsidies boost consumption?
They boosted subsidised goods temporarily. Household appliance sales rose 11.0 percent in 2025, then fell 5.6 percent in January to August 2026, erasing about 56 percent of the gain, while total retail sales growth slowed from 6.4 percent in May 2025 to 0.4 percent in August 2026.
Are China’s consumer subsidies large enough to change its growth model?
No. The 125 billion yuan allocated to trade-in subsidies in 2026 equal 0.09 percent of GDP and about 0.5 percent of the annual consumption gap. Subsidies can shift purchases in time, but changing the growth model requires a durable transfer of income to households.
How fast would Chinese consumption need to grow to rebalance the economy?
To raise the household consumption share to 45 percent of GDP in five years, household consumption would need to grow by about 6.5 percent a year in nominal terms, compared with growth of 4.4 percent per capita in 2025.
Methodological note
All calculations were performed by the author on the data listed in Section 4. The consumption gap is computed on 2025 GDP of 140.19 trillion yuan. The appliance sales index assumes that the January to August 2026 growth rate applies to the full year. The required growth rates are computed as (target share / initial share) raised to the power 1/N, multiplied by (1 + nominal GDP growth), minus 1. Data are available from the author on request.
References
Chamon, M. D., and Prasad, E. S. (2010). Why are saving rates of urban households in China rising? American Economic Journal: Macroeconomics, 2(1), 93 to 130.
Mian, A., and Sufi, A. (2012). The effects of fiscal stimulus: Evidence from the 2009 cash for clunkers program. Quarterly Journal of Economics, 127(3), 1107 to 1142.
Ministry of Finance of the People’s Republic of China, as reported by Xinhua. (2026). China’s finance ministry pledges vigorous, effective implementation of more proactive fiscal policy. 9 October 2026.
Modigliani, F., and Cao, S. L. (2004). The Chinese saving puzzle and the life-cycle hypothesis. Journal of Economic Literature, 42(1), 145 to 170.
National Bureau of Statistics of China. (2026). Statistical communiqué and monthly releases on total retail sales of consumer goods, January 2025 to August 2026.
Pettis, M. (2013). Avoiding the Fall: China’s Economic Restructuring. Carnegie Endowment for International Peace.
Wei, S.-J., and Zhang, X. (2011). The competitive saving motive: Evidence from rising sex ratios and savings rates in China. Journal of Political Economy, 119(3), 511 to 564.
World Bank. (2026). World Development Indicators: household final consumption expenditure, gross savings and gross capital formation (% of GDP).
China Daily. (2025). Retail sales growth accelerates in May 2025. 16 June 2025.
Euronews. (2026). China’s retail sales slow again as Beijing struggles to revive consumer spending. 15 September 2026.
