
India’s Investment-Led Growth in 2026: Measuring the Capital Engine Behind Seven Percent

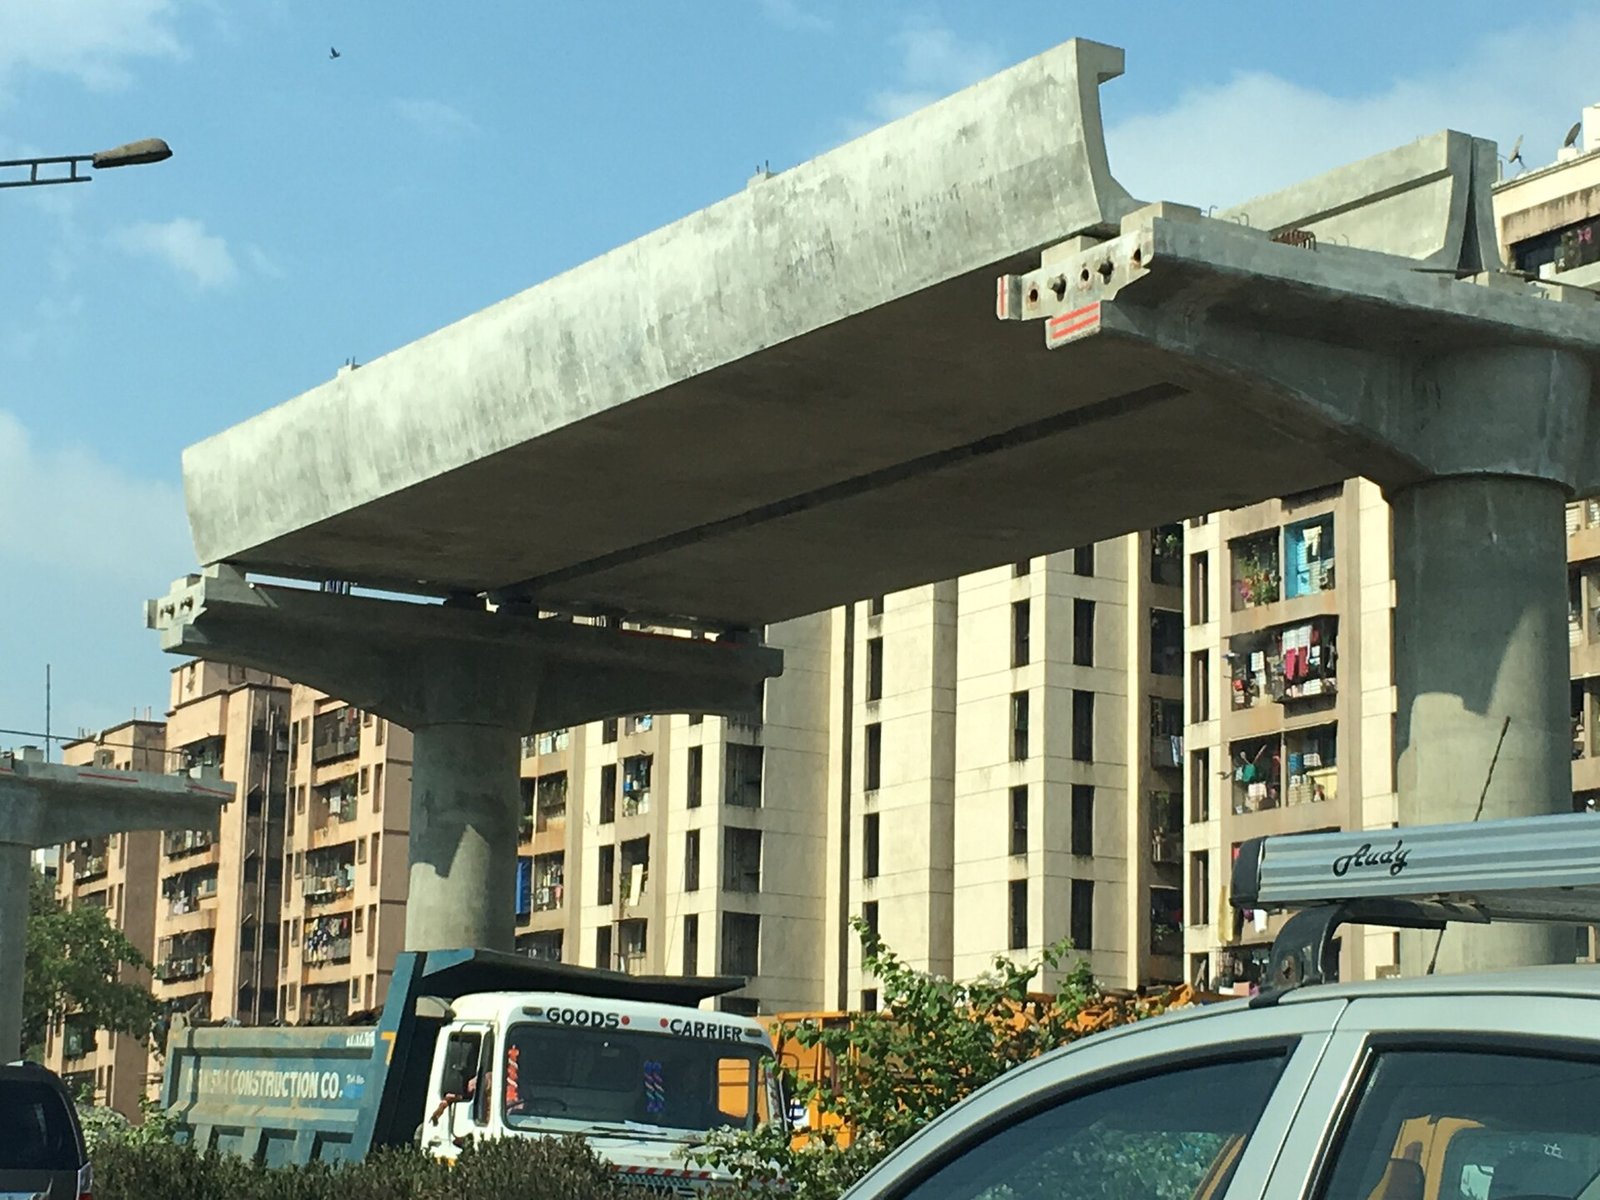
India’s Investment-Led Growth in 2026: Measuring the Capital Engine Behind Seven Percent
Driss EFFINA, PhD Independent Researcher, Global Strategy Files Reading time: about 26 minutes
Key takeaways
- The World Bank raised its forecast for India's growth in 2026-27 to 7.1 percent in October 2026, from 6.6 percent in April.
- Fixed investment contributed about 2.6 points of India's 7.7 percent growth in 2025-26 and almost 4 points in the first quarter of 2026-27.
- India's investment rate reached 34.3 percent of GDP in the first quarter of 2026-27, still below the 2008 peak of about 38 percent.
- The three year average incremental capital output ratio improved to about 4.1, from 5.7 to 5.8 in 2013 and 2014.
Abstract
On 6 October 2026, the World Bank raised its forecast for India’s growth in fiscal year 2026-27 to 7.1 percent, from 6.6 percent in April, noting that growth had held up better than expected despite trade and geopolitical uncertainty. A week later, the International Monetary Fund raised its own forecast to 7.0 percent, and the Reserve Bank of India projected 7.1 percent while raising its policy rate to fight a return of inflation. This article examines what lies behind these numbers, with a focus on investment. Using the national accounts released by the Ministry of Statistics and Programme Implementation (MoSPI) on the new 2022-23 base, the long-run fixed capital formation series of the IMF International Financial Statistics, and budget data, the author computes the contributions of each expenditure component to growth, the investment rate over two decades, the incremental capital output ratio (ICOR), the share of public investment in total investment, and growth scenarios to 2030-31. Five findings emerge. First, fixed investment contributed about 2.6 percentage points of the 7.7 percent growth of 2025-26 and almost 4 points of the 7.8 percent growth of the first quarter of 2026-27, about half. Second, the investment rate is back above 31 percent of GDP and reached 34.3 percent in the first quarter of 2026-27 at current prices, but remains below the peak of about 38 percent reached in 2008. Third, the efficiency of investment has improved: the three-year average ICOR is about 4.1, compared with 5.7 to 5.8 in 2013 and 2014. Fourth, public investment still accounts for a significant share of the total, with effective central capital spending budgeted at 4.4 percent of GDP in 2026-27. Fifth, sustaining growth of 7 percent requires an investment rate of about 32 to 33 percent with current efficiency; a retreat of private investment would bring growth closer to 6 percent. The article concludes that India’s growth is now driven by a broad investment cycle, but that its sustainability depends on private corporate investment taking over from the state at a time when the external environment is becoming less favourable.
Keywords: India, economic growth, investment, gross fixed capital formation, ICOR, public capital expenditure, private investment, national accounts, scenarios
JEL codes: E22, E23, O11, O47, O53, H54
1. Introduction
India is the fastest growing large economy in the world. According to the provisional estimates published by the National Statistics Office in 2026, real GDP grew by 7.1 percent in 2024-25 and 7.7 percent in 2025-26, and by 7.8 percent in the first quarter of 2026-27 (April to June 2026). These figures are remarkable in a global environment marked by higher oil prices, the conflict in the Middle East, tariff tensions with the United States and a slowdown in China.
The question this article addresses is not whether India is growing fast, which is evident, but why it is growing fast and whether this growth is durable. The answer, according to the World Bank, lies largely in investment: the acceleration of 2025-26 was “driven by strong investment and solid private consumption”, supported by a favourable policy and credit environment that outweighed trade tensions. The World Bank also warns that global uncertainty weighs on private investment as the frontloading of exports fades.
Investment matters for growth in two ways. In the short term, it is a component of demand: spending on machinery, buildings and infrastructure raises output directly. In the long term, it is the main source of growth in productive capacity: an economy that invests more accumulates more capital, which allows it to produce more in the future. The relationship between the two, captured by the incremental capital output ratio, measures how efficiently an economy converts investment into growth.
The article proceeds in eight sections. Section 2 sets out the context. Section 3 reviews the literature on investment and growth in India. Section 4 describes the data and methods. Section 5 presents the results: growth dynamics, the investment rate, contributions to growth, capital efficiency, sectoral composition and the role of public investment. Section 6 discusses the results. Section 7 presents growth scenarios to 2030-31. Section 8 concludes.
2. Context
2.1 Two decades of investment cycles
India’s modern growth story is closely tied to investment cycles. Between 2003 and 2008, a boom in private corporate investment, financed by bank credit and strong corporate profits, pushed the investment rate to historic highs and growth to around 9 percent. This boom ended with the global financial crisis and then, more seriously, with the “twin balance sheet” problem of the 2010s: highly indebted corporations, particularly in infrastructure, steel and power, and banks burdened by non-performing loans. Private investment stagnated for almost a decade, and the investment rate fell steadily.
From 2018 onward, the cleaning of bank balance sheets, the insolvency and bankruptcy code, corporate tax cuts in 2019 and, after the pandemic, a large increase in public capital expenditure created the conditions for a new investment cycle. The central government more than tripled its capital expenditure between 2019-20 and 2025-26, prioritising roads, railways, ports and defence.
2.2 The new national accounts series
In February 2026, MoSPI published a new series of national accounts with base year 2022-23, replacing the 2011-12 base. The new series incorporates updated data sources and methods and has changed the measured levels and growth rates of some components. All MoSPI data used in this article refer to the new series. Comparisons with older periods use the IMF International Financial Statistics series, which provides a longer time series of fixed capital formation and GDP.
2.3 The 2026 environment
The year 2026 has been marked by several shocks. In 2025, the United States imposed tariffs of 25 percent, then 50 percent, on Indian goods. In February 2026, a trade agreement was announced, reducing the tariff rate to 18 percent and removing the additional penalty linked to purchases of Russian oil. At the same time, the escalation of the conflict in the Middle East pushed oil prices sharply higher: the IMF assumes an average oil price of about US$96 per barrel in 2026, against about US$68 in 2025. India imports most of its oil, so this is a significant terms of trade shock, examined in a later article in this series.
Inflation has returned. Consumer price inflation, which had fallen to historically low levels in 2025, rose to 4.8 percent in August 2026. On 7 October 2026, the Reserve Bank of India raised its repo rate by 25 basis points to 5.50 percent and changed its stance to “calibrated tightening”. It projects inflation of 5.2 percent and growth of 7.1 percent in 2026-27.
2.4 The budget
The Union Budget for 2026-27 set central government capital expenditure at 12.22 lakh crore rupees, about 3.1 percent of GDP, and “effective capital expenditure”, which includes grants to states for the creation of capital assets, at 17.15 lakh crore rupees, or 4.4 percent of GDP. The fiscal deficit target is 4.3 percent of GDP. Public investment therefore remains a pillar of growth, but the government is also committed to reducing its debt.
3. Literature review
The relationship between investment and growth is one of the oldest questions in economics. The Harrod-Domar model, the starting point of Indian planning in the 1950s, links growth to the investment rate divided by the capital output ratio. The Solow model added that, in the long run, growth depends on technological progress rather than capital accumulation alone, but that during the transition to the steady state, which can last decades for developing economies, investment remains a key driver.
For India specifically, Bosworth and Collins (2008), in a comparative growth accounting study of China and India, showed that capital accumulation accounted for a much smaller share of growth in India than in China, and that India’s growth was more driven by total factor productivity gains in services. Later work, including the growth accounting estimates of the KLEMS India database maintained by the Reserve Bank of India, shows that the contribution of capital increased in the 2000s with the investment boom.
The literature on the twin balance sheet problem is also relevant. The Economic Survey of India 2016-17, under the direction of Arvind Subramanian, documented how the overextension of corporate balance sheets during the 2000s boom led to a long period of weak private investment. Chari, Jain and Kulkarni (2021) analysed the impact of the insolvency reforms on the resolution of distressed assets.
On the efficiency of investment, Indian planning documents and successive Economic Surveys have long used the incremental capital output ratio as an approximate measure, while noting its limitations: the ICOR is a residual concept that mixes the efficiency of capital with all other sources of growth. Rodrik and Subramanian (2005) argued that the acceleration of Indian growth from the 1980s was initially due to a pro-business attitude rather than liberalisation alone, which implies that productivity rather than capital was the first driver.
More recent studies, including the IMF Article IV reports on India and the World Bank India Development Updates, have focused on the role of public investment in crowding in private investment. The IMF has generally found that public infrastructure investment has significant multiplier effects in India, but that its sustainability depends on fiscal space.
The present article contributes to this literature by updating these measurements with the new 2022-23 base series and the most recent data up to the first quarter of 2026-27, and by linking the investment rate and the ICOR to explicit growth scenarios.
4. Data and methodology
4.1 Sources
The data come from:
- MoSPI press notes on the provisional estimates of GDP for 2025-26 (May 2026) and the quarterly estimates for the first quarter of 2026-27 (31 August 2026), new series with base year 2022-23;
- the IMF International Financial Statistics series of nominal gross fixed capital formation, nominal GDP and real GDP for India, accessed through the Federal Reserve Bank of St. Louis (FRED), covering fiscal years 2005-06 to 2025-26;
- the World Bank India Development Update of October 2026, the IMF World Economic Outlook of October 2026 and the Reserve Bank of India’s monetary policy statement of 7 October 2026 for forecasts;
- the Union Budget 2026-27 for public capital expenditure.
4.2 Contributions to growth
The contribution of each expenditure component to real GDP growth is calculated as the change in the real level of the component divided by the real level of GDP in the previous period. Imports are subtracted. The sum of contributions does not exactly equal GDP growth because of changes in stocks, valuables and the statistical discrepancy, which are shown as a residual.
4.3 Investment rate
The investment rate is gross fixed capital formation divided by GDP at current prices. For the long series, the author uses the IMF IFS data. The new MoSPI series gives slightly different values for recent years, and both are shown.
4.4 Incremental capital output ratio
The ICOR is calculated as the average investment rate over the three preceding years divided by the average real growth rate over the current year and the two preceding years. This smoothing reduces the effect of annual fluctuations and of the lag between investment and its effect on output. A lower ICOR means that less investment is needed to produce one point of growth, which indicates higher efficiency. The ICOR is a rough measure: it attributes all growth to capital and ignores labour and productivity.
4.5 Scenarios
Growth scenarios are calculated using the Harrod-Domar relationship: growth equals the investment rate divided by the ICOR. Three combinations of investment rate and ICOR are considered. This is a deliberately simple framework, used to show orders of magnitude rather than precise forecasts.
4.6 Limitations
The change of base year in 2026 creates a break between the old and new series. The IMF IFS series may differ from MoSPI data because of revisions and different vintages. Quarterly data are provisional and subject to revision; the next release is scheduled for 30 November 2026. The statistical discrepancy in the quarterly accounts is large in the first quarter of 2026-27, which makes the quarterly contributions less reliable than the annual ones.
5. Results
5.1 Growth momentum
Figure 1 shows quarterly real GDP growth since 2024-25 and the forecasts for 2026-27.
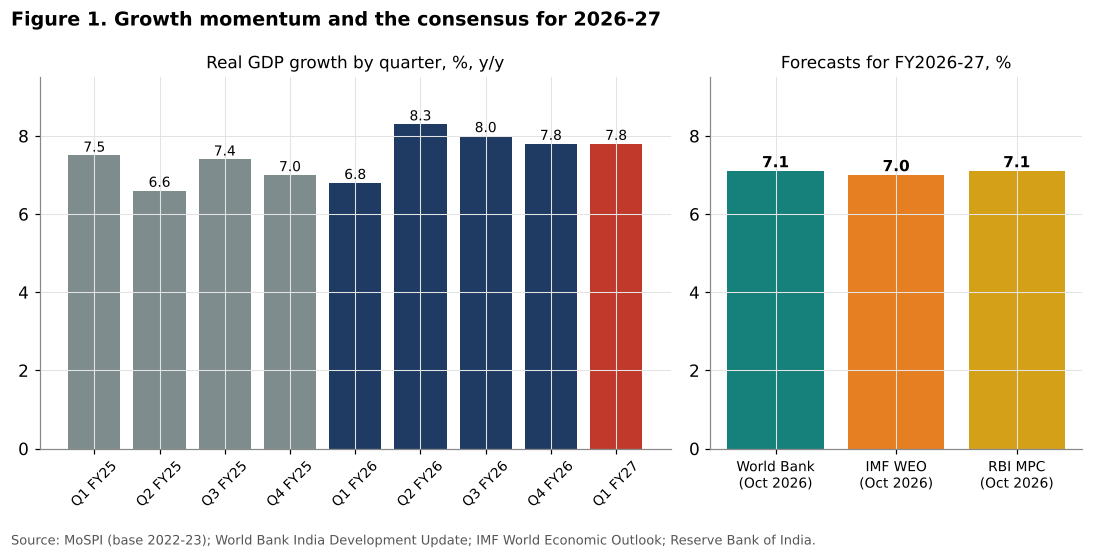
Growth was 7.5 percent in the first quarter of 2024-25, slowed to 6.6 percent in the second quarter, then recovered to 7.4 and 7.0 percent. In 2025-26, after a softer first quarter (6.8 percent), growth accelerated to 8.3 percent in the second quarter and remained close to 8 percent in the following quarters. In the first quarter of 2026-27, it was 7.8 percent, above expectations.
For the whole of 2026-27, the three main forecasters converge around 7 percent: 7.1 percent for the World Bank, 7.0 percent for the IMF and 7.1 percent for the RBI. The RBI expects growth to slow gradually during the year, to 7.2 percent in the second quarter, 6.9 percent in the third and 6.8 percent in the fourth. This slowdown reflects tighter monetary policy, high oil prices, a rainfall deficit that weighs on rural demand, and the fading of export frontloading.
| Indicator | 2023-24 | 2024-25 | 2025-26 |
|---|---|---|---|
| Real GDP growth (%) | 7.2 | 7.1 | 7.7 |
| Nominal GDP growth (%) | 11.0 | 9.7 | 8.9 |
| Real GDP per capita growth (%) | 6.2 | 6.1 | 6.8 |
| GFCF, % of GDP, current prices | 31.9 | 31.6 | 31.9 |
| Private consumption, % of GDP, current prices | 56.5 | 56.5 | 56.7 |
Table 1. Main national accounts aggregates. Source: MoSPI, new series base 2022-23.
One feature of recent data is the low rate of nominal growth relative to real growth. In 2025-26, nominal GDP grew by 8.9 percent, only 1.2 points more than real GDP, which implies very low inflation as measured by the GDP deflator. This has implications for public finances, since revenue depends on nominal growth, and for the debt ratio. In the first quarter of 2026-27, nominal growth rebounded to 10.3 percent as inflation returned.
5.2 The investment rate over two decades
Figure 2 shows gross fixed capital formation as a share of GDP from 2005-06 to 2025-26.
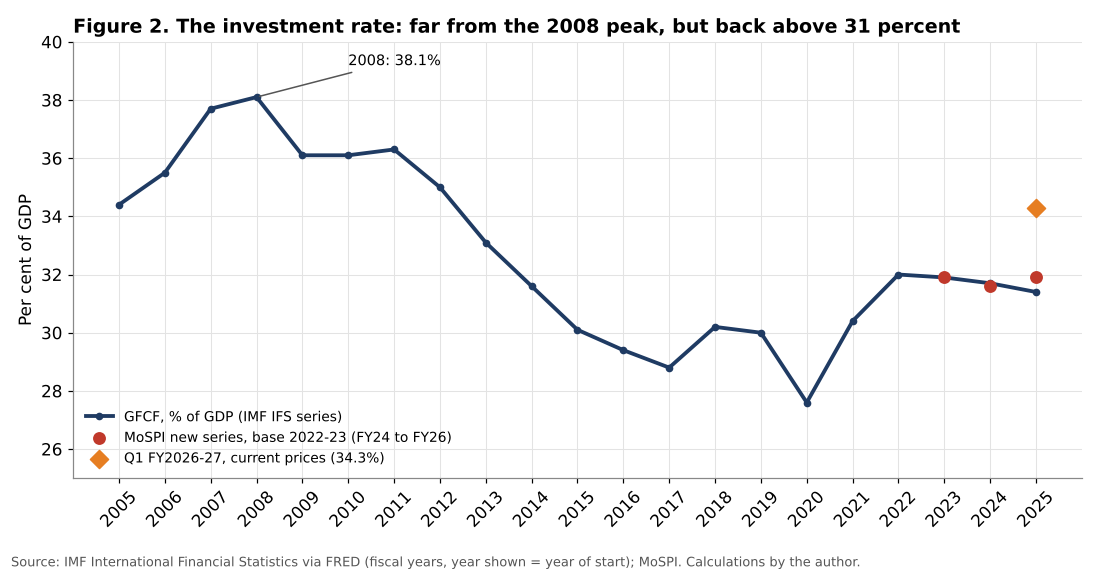
The investment rate rose from 34.4 percent in 2005-06 to a peak of 38.1 percent in 2008-09, at the height of the private investment boom. It then fell almost continuously for a decade, to 28.8 percent in 2017-18, and reached a low of 27.6 percent in the pandemic year 2020-21. Since then, it has recovered to about 32 percent in 2022-23 and has remained close to that level, at 31.4 percent in 2025-26 according to the IMF series and 31.9 percent according to the new MoSPI series.
The first quarter of 2026-27 shows a marked increase: gross fixed capital formation reached 34.3 percent of GDP at current prices, against 31.4 percent a year earlier. In real terms, GFCF grew by 11.9 percent, the fastest growth of any demand component. Part of this increase may be seasonal and part reflects strong public spending at the start of the fiscal year, but it suggests that the investment cycle is still strengthening.
The main lesson of this long series is that India’s investment rate is still about 4 to 6 points of GDP below its 2008 peak. The current investment cycle is real, but it is not (yet) a boom comparable to that of the 2000s. This is not necessarily a weakness: the 2000s boom ended with a decade of corporate and banking distress, partly because investment was financed by excessive debt and directed to projects that proved unviable.
5.3 What drives growth?
Figure 3 shows the contributions of each demand component to real GDP growth.
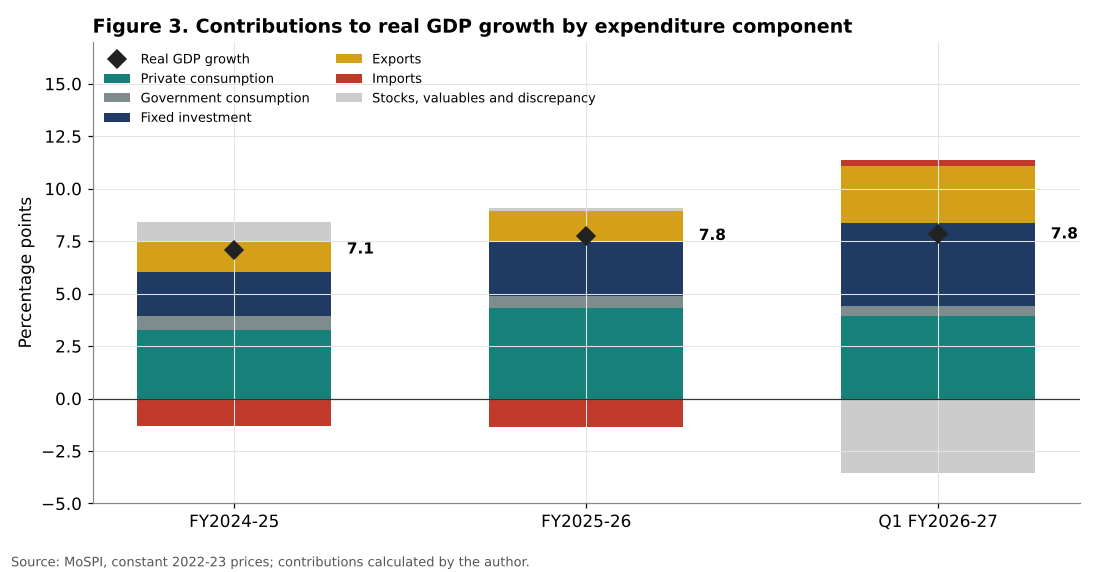
In 2024-25, private consumption contributed 3.3 percentage points of the 7.1 percent growth, fixed investment 2.1 points and exports 1.5 points, while imports subtracted 1.3 points. In 2025-26, the contribution of private consumption rose to 4.3 points and that of fixed investment to 2.6 points, explaining most of the acceleration of growth to 7.7 percent. Fixed investment thus accounted for about 34 percent of growth in 2025-26.
In the first quarter of 2026-27, the picture changed. Fixed investment contributed almost 4 percentage points, as much as private consumption, and exports contributed 2.7 points while imports fell slightly, adding a small positive contribution. On this measure, fixed investment explains about half of growth in the first quarter. The large negative residual in this quarter (about -3.6 points) reflects stocks, valuables and the statistical discrepancy, and calls for caution: the contributions of individual components may be revised.
| Component | 2024-25 | 2025-26 | Q1 2026-27 |
|---|---|---|---|
| Private consumption | 3.26 | 4.32 | 3.95 |
| Government consumption | 0.67 | 0.56 | 0.47 |
| Fixed investment | 2.08 | 2.62 | 3.95 |
| Exports | 1.48 | 1.42 | 2.73 |
| Imports (minus) | -1.31 | -1.35 | 0.29 |
| Real GDP growth | 7.10 | 7.75 | 7.82 |
Table 2. Contributions to real GDP growth, percentage points. Source: MoSPI; calculations by the author.
The strong contribution of exports in the first quarter of 2026-27 is notable: real exports grew by 12.0 percent, while imports fell by 1.1 percent. The World Bank identifies exports as the main source of the upward revision to its forecast. However, part of this performance reflects frontloading ahead of tariff changes and is unlikely to be repeated.
The relatively modest contribution of government consumption (less than half a point) shows that the state supports growth mainly through investment rather than current spending. This is consistent with the fiscal strategy of the central government, which has sought to increase capital expenditure while consolidating overall spending.
5.4 The efficiency of investment
Figure 4 shows the incremental capital output ratio calculated as three-year averages.
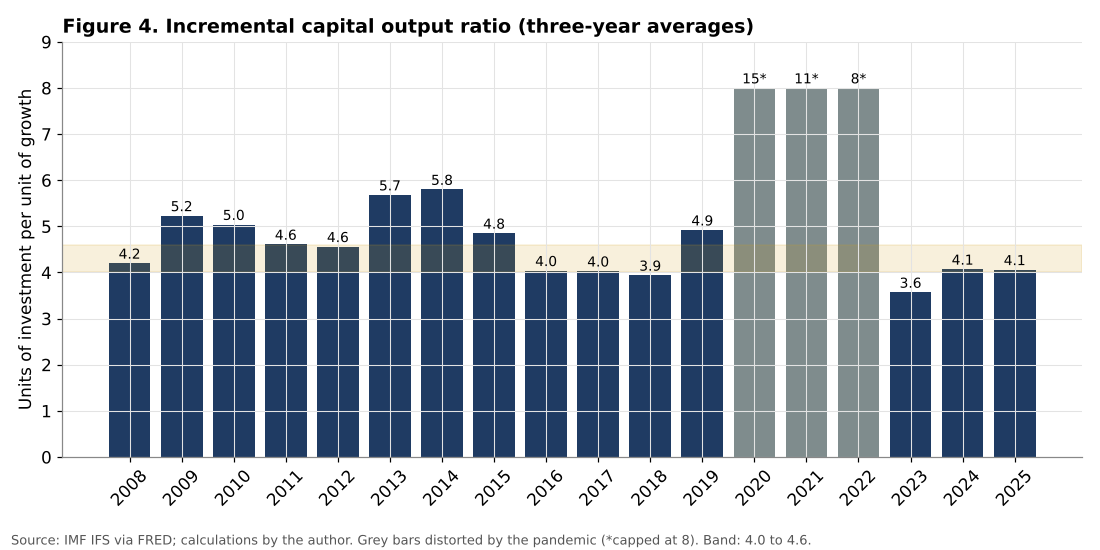
Before the global financial crisis, the ICOR was about 4.2, which reflected high growth with high investment. It then rose to between 5 and 6 in the early 2010s, reaching 5.7 in 2013-14 and 5.8 in 2014-15. This deterioration is the quantitative signature of the twin balance sheet problem: investment remained relatively high, but growth slowed because many projects were stalled, unfinished or unproductive.
Between 2016 and 2019, the ICOR returned to about 4, before rising to 4.9 in 2019-20 as growth slowed. The pandemic years produced extreme values, which are not meaningful because the fall and rebound of output distort the ratio. In 2023-24 to 2025-26, the ICOR stabilised at about 3.6 to 4.1. With the new MoSPI series, the ratio of the investment rate to growth is 4.5 in 2024-25 and 4.1 in 2025-26.
This is an important result. It indicates that the current investment cycle is efficient: each point of GDP invested generates more growth than in the early 2010s. Three factors may explain this. First, the composition of investment has shifted toward infrastructure with high returns, such as roads, railways and ports, which reduce logistics costs for the whole economy. Second, the cleaning of bank and corporate balance sheets has reduced the share of investment trapped in stalled projects. Third, digital public infrastructure, including the unified payments interface, digital identity and the goods and services tax network, has raised productivity across sectors at relatively low capital cost.
However, an ICOR of 4 is not exceptionally low by international standards. East Asian economies during their high-growth phases often had ICORs of 3 to 4. And the ratio tends to rise as economies develop and as investment shifts from infrastructure to more capital-intensive industrial projects.
5.5 Sectoral composition
Figure 5 shows real gross value added growth by sector in 2025-26 and in the first quarter of 2026-27.
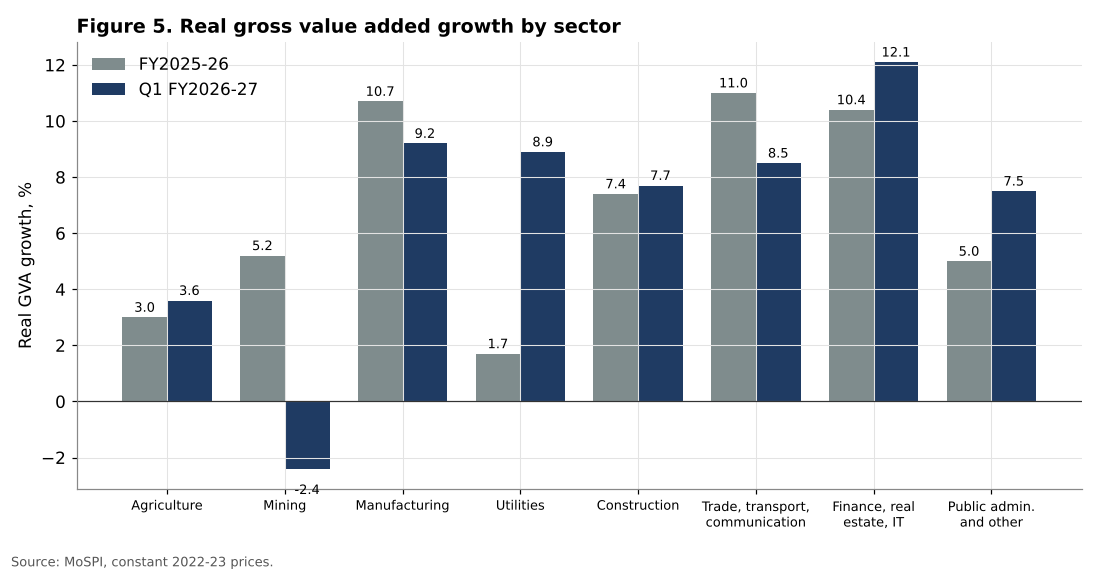
In 2025-26, the fastest growing sectors were trade, hotels, transport and communication (11.0 percent), manufacturing (10.7 percent) and financial, real estate, IT and professional services (10.4 percent). Agriculture grew by 3.0 percent and utilities by only 1.7 percent.
In the first quarter of 2026-27, financial, real estate, IT and professional services led with 12.1 percent growth, followed by manufacturing (9.2 percent), utilities (8.9 percent) and trade and transport (8.5 percent). Construction grew by 7.7 percent in real terms and by 16.5 percent in nominal terms, reflecting rising construction prices. Mining contracted by 2.4 percent in real terms, while its nominal value rose by 22.3 percent, a sign of the sharp increase in commodity prices.
The strength of manufacturing over two years is significant. For a long time, India’s growth was criticised for relying too heavily on services and for failing to create a large manufacturing base capable of absorbing labour. Manufacturing growth of about 10 percent in 2025-26 and 9 percent in the first quarter of 2026-27, combined with the production linked incentive schemes for electronics, automobiles and other sectors, suggests that this weakness is beginning to be addressed, although the share of manufacturing in GDP remains modest.
5.6 The role of public investment
Public investment has played a central role in the current cycle. Central government capital expenditure of 12.22 lakh crore rupees in the 2026-27 budget represents about 3.1 percent of GDP, or about 10 percent of total fixed capital formation in the economy. Including grants to states for capital assets, effective capital expenditure reaches 17.15 lakh crore rupees, 4.4 percent of GDP, or about 14 percent of total GFCF. State governments and public sector enterprises add a further substantial amount.
The strategy of the central government since 2020 has been to use public investment to crowd in private investment, by improving infrastructure and signalling confidence in long-term growth. The evidence on crowding in is mixed. Private corporate investment has increased, especially in sectors such as renewable energy, electronics, automobiles and data centres. But it has not yet taken over from public investment as the main driver, as was the case in the 2000s.
The fiscal context limits the scope for further increases in public investment. The central government aims to reduce its debt ratio toward the mid-50s percent of GDP and has set a fiscal deficit target of 4.3 percent of GDP for 2026-27. Interest payments absorb about 14 lakh crore rupees, about a fifth of total spending. Public capital expenditure is therefore likely to stabilise as a share of GDP, which means that further increases in the investment rate will have to come from the private sector.
5.7 Consumption and household balance sheets
Private consumption remains the largest component of demand, at about 56 to 57 percent of GDP. Its contribution to growth rose in 2025-26, helped by income tax relief in the 2025 budget and the reduction of goods and services tax rates later in the year. Real per capita private consumption grew by 6.8 percent in 2025-26, against 4.8 percent in the two previous years.
The World Bank notes that rural consumption initially outpaced urban demand thanks to good agricultural performance, and that urban consumption strengthened later in the year. For 2026-27, a rainfall deficit through August and higher inflation are likely to weigh on rural incomes. The return of inflation and the rise in interest rates will also reduce the purchasing power of households and the attractiveness of credit-financed purchases.
The link between consumption and investment is essential. Private investment responds to expected demand: firms invest when they expect to sell more. A sustained rise in consumption, broadly shared across income groups, is therefore a condition for the private investment cycle to continue.
5.8 Exports, tariffs and the external contribution
The external sector has been a surprise in 2025-26 and early 2026-27. Despite the American tariffs of 2025, real exports of goods and services grew by 6.3 percent in 2025-26 and by 12.0 percent in the first quarter of 2026-27. At current prices, exports rose to 25.6 percent of GDP in the first quarter of 2026-27, against 22.5 percent a year earlier. Services exports, notably information technology, business services and the activities of global capability centres, have been particularly dynamic. The World Bank reports that global capability centres employed about 2.36 million professionals in 2025, against 1.9 million in 2024.
The tariff agreement of February 2026 reduced the uncertainty that weighed on goods exports. The announced rate of 18 percent remains well above the levels that prevailed before 2025, but it places India in a better position than several Asian competitors. The diversion of supply chains away from China, sometimes described as a “China plus one” strategy, has also benefited Indian electronics and pharmaceutical exports.
Imports, by contrast, grew by 30.9 percent at current prices in the first quarter of 2026-27, while falling by 1.1 percent in real terms. This divergence is explained by prices: the rise in the price of oil and other commodities raised the import bill without any increase in volumes. This is the main channel through which the oil shock affects India. A higher import bill reduces national income, widens the current account deficit and puts pressure on the rupee, even when real growth remains strong.
The net contribution of external demand to growth is therefore fragile. If export frontloading fades, as the World Bank expects, and if oil prices remain high, the external sector could subtract from growth in the second half of 2026-27, and investment and consumption would have to carry the economy.
6. Discussion
6.1 An investment cycle, not yet a boom
The results show that India is in a genuine investment cycle. The investment rate has recovered from its low point, investment growth has been strong for several years and accelerated in early 2026-27, and the efficiency of investment, measured by the ICOR, has improved. This combination explains why India has been able to sustain growth of around 7 to 8 percent in a difficult global environment.
But this is not yet a boom comparable to that of 2003 to 2008. The investment rate is still several points below its peak, and the cycle relies heavily on public investment. The key question for the coming years is whether private corporate investment will take over.
There are reasons for optimism. Corporate balance sheets are much healthier than in the 2010s, banks are well capitalised and have low non-performing loans, and capacity utilisation in manufacturing has been high. The trade agreement with the United States has reduced the tariff uncertainty that weighed on export-oriented investment in 2025. And new sectors, including renewable energy, electronics manufacturing and data centres linked to artificial intelligence, are attracting significant investment.
There are also reasons for caution. The World Bank notes that global uncertainty is weighing on private investment. The rise in interest rates by the RBI, the increase in oil prices and the slowdown in the global economy could delay investment decisions. And the experience of the 2000s shows that investment booms can end abruptly when financed by excessive debt.
6.2 Efficiency matters as much as volume
The improvement in the ICOR is perhaps the most important finding of this article. An economy that grows 7 percent with an investment rate of 32 percent is in a much better position than one that needs 38 percent to grow at the same rate. High efficiency means that growth requires less saving, less foreign borrowing and less debt.
Maintaining this efficiency requires that investment continue to be directed to productive uses. The risk is that, as the cycle matures, investment shifts toward less productive projects, as happened in the late 2000s, or that public investment is directed by political rather than economic criteria. The quality of project selection, the speed of execution and the maintenance of existing infrastructure are therefore as important as the volume of investment.
6.3 Financing the investment rate
An investment rate of 32 to 34 percent of GDP must be financed by domestic saving or foreign capital. India’s current account deficit is projected by the IMF to rise from 0.7 percent of GDP in 2025 to 1.5 percent in 2026, mainly because of higher oil prices. This means that most investment is financed by domestic saving. Household financial saving has declined in recent years as households increased their borrowing and physical investment in housing, while corporate saving has risen.
If the investment rate rises further, the current account deficit is likely to widen. A deficit of 2 to 3 percent of GDP would be manageable for India, given its foreign exchange reserves, but it would increase dependence on capital flows, which are sensitive to global financial conditions. The World Bank explicitly mentions the risk of capital flow volatility linked to stock market corrections.
6.4 The demographic dimension
India’s growth must also be seen in relation to its demography. With about 1.42 billion inhabitants in 2025-26 and a working-age population still growing, India needs to create millions of jobs every year. Growth driven by capital-intensive investment may not create enough jobs, especially for young people and women, whose participation in the labour force remains low. This issue is examined in detail in the next article in this series.
6.5 Risks to the investment cycle
Four risks deserve particular attention. The first is the oil price. An average price of about US$96 per barrel in 2026, as assumed by the IMF, raises costs for firms, reduces household purchasing power and forces the central bank to keep interest rates higher. The second is monetary tightening itself: the RBI’s change of stance to calibrated tightening means that the cost of credit for firms is likely to rise further, at the very moment when private investment needs to take over. The third is the global financial cycle: a correction in global equity markets, mentioned by the World Bank, could trigger capital outflows and tighten domestic financial conditions. The fourth is climatic: the rainfall deficit of 2026 and the risk of an El Nino episode could reduce agricultural output, raise food prices and weaken rural demand.
None of these risks is likely, on its own, to end the investment cycle. But their combination could slow it significantly. The resilience of growth in 2025-26 and early 2026-27 should not lead to complacency.
6.6 Policy implications
The analysis leads to four observations for policy:
1. Public investment should be maintained at its current share of GDP, with an emphasis on the quality of projects and on maintenance, rather than increased further at the expense of fiscal consolidation. 2. The conditions for private investment should be strengthened through regulatory simplification, faster land and environmental approvals, and the stability of tax and trade policy. 3. The efficiency of investment should be monitored, for example by publishing indicators of project completion and cost overruns. 4. The financing of investment should rely mainly on domestic saving, which requires policies that encourage household financial saving and the development of long-term capital markets.
7. Scenarios to 2030-31
7.1 Method
Figure 6 presents three growth scenarios to 2030-31, based on the relationship growth = investment rate / ICOR.
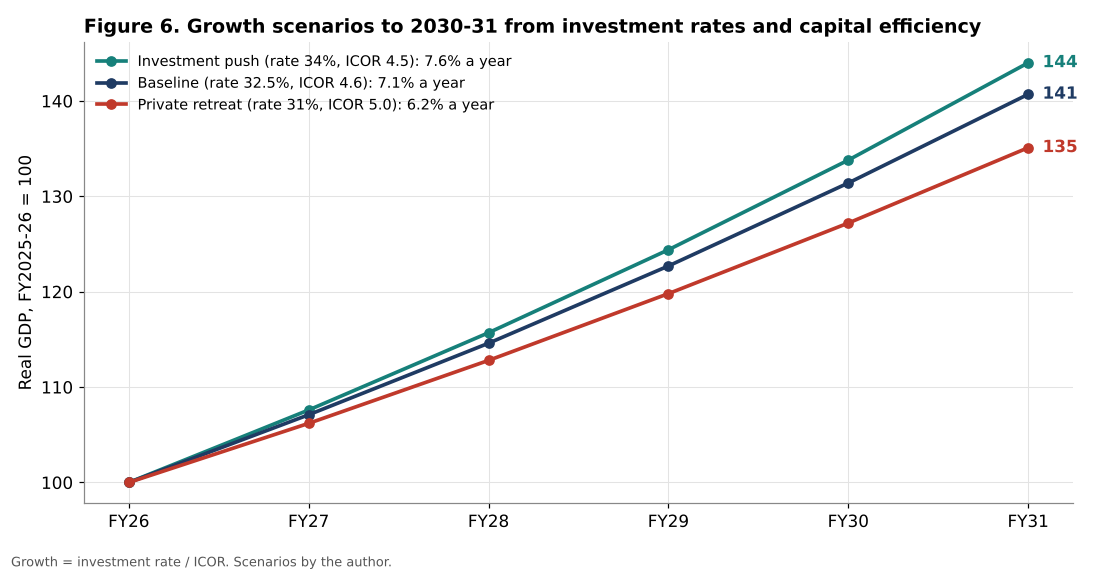
Investment push. The investment rate rises to 34 percent of GDP, close to the level of the first quarter of 2026-27, driven by private corporate investment in manufacturing, energy and digital infrastructure. Efficiency remains good, with an ICOR of 4.5. Growth averages about 7.6 percent per year. Real GDP in 2030-31 would be 44 percent higher than in 2025-26.
Baseline. The investment rate stabilises at 32.5 percent and the ICOR at 4.6. Growth averages about 7.1 percent, in line with the current forecasts of the World Bank, the IMF and the RBI. Real GDP would be 41 percent higher in 2030-31.
Private retreat. Private investment slows because of global uncertainty, high interest rates and weaker exports, and the investment rate falls back to 31 percent. Efficiency also deteriorates slightly, with an ICOR of 5.0, as projects are delayed. Growth averages 6.2 percent. Real GDP would be 35 percent higher in 2030-31.
7.2 Interpretation
The difference between the investment push and the private retreat scenarios is about 1.4 percentage points of growth per year, or about 9 percent of GDP after five years. This illustrates the importance of the private investment cycle for India’s medium-term prospects.
The difference also matters for India’s long-term ambitions. At 7 percent growth, real GDP doubles in about ten years; at 6 percent, it takes almost twelve years; at 8 percent, nine years. The government’s objective of making India a developed economy by 2047 requires sustained growth of 7 to 8 percent per year for more than two decades, which in turn requires both a high investment rate and continued improvements in efficiency.
7.3 Indicators to monitor
The author suggests monitoring:
1. The quarterly share of GFCF in GDP at current and constant prices. 2. The growth of new investment projects announced by the private sector and the rate of project completion. 3. Bank credit to industry, particularly to large firms. 4. Capacity utilisation in manufacturing, published by the RBI. 5. The current account deficit, as an indicator of the gap between investment and domestic saving.
8. Conclusion
India’s growth of around 7 to 8 percent since 2023 rests largely on a strong investment cycle. The main findings of this article are:
1. Fixed investment contributed about 2.6 percentage points to the 7.7 percent growth of 2025-26 and almost 4 points to the 7.8 percent growth of the first quarter of 2026-27. 2. The investment rate has recovered to about 32 percent of GDP and reached 34.3 percent in the first quarter of 2026-27 at current prices, but remains below the peak of about 38 percent in 2008. 3. The efficiency of investment has improved significantly: the ICOR is about 4, compared with almost 6 in the early 2010s. 4. Public investment remains a pillar of the cycle, with effective central capital spending of 4.4 percent of GDP, but fiscal constraints limit its further expansion. 5. Sustaining 7 percent growth requires an investment rate of about 32 to 33 percent at current efficiency. A retreat of private investment could bring growth back toward 6 percent.
The upward revisions of growth forecasts in October 2026 reflect real strength. But the external environment, marked by high oil prices, tighter monetary policy and global uncertainty, is less favourable than in 2025. The sustainability of India’s growth depends on the transition from a cycle led by public investment to one led by private investment, and on maintaining the efficiency gains of recent years.
Need this analysis for your organisation?
We prepare confidential briefings, executive talks and studies on countries, markets and policies, built on the same method as this article.
Request a briefingSupport independent analysis
Our studies are free to read and carry no advertising. If this one was useful, a small contribution helps us publish the next.
Support our workGo further: books by Global Strategy Files
Frequently asked questions
How fast is India’s economy growing in 2026?
India’s economy grew 7.7 percent in 2025-26 and 7.8 percent in the first quarter of 2026-27. In October 2026 the World Bank raised its forecast for 2026-27 to 7.1 percent, and the IMF raised its own forecast to 7.0 percent.
What is driving India’s economic growth?
Investment is the main driver. Fixed investment contributed about 2.6 percentage points of the 7.7 percent growth of 2025-26 and almost 4 points of the 7.8 percent growth in the first quarter of 2026-27, about half of total growth.
Is investment in India becoming more efficient?
Yes. The three year average incremental capital output ratio, the amount of investment needed per unit of extra output, is about 4.1, compared with 5.7 to 5.8 in 2013 and 2014, which means each rupee of investment now produces more growth.
Can India sustain 7 percent growth?
Sustaining 7 percent growth requires an investment rate of about 32 to 33 percent of GDP at current efficiency. If private investment retreated and the state could not fill the gap, growth would move closer to 6 percent, so private corporate investment must take over from public spending.
Methodological note
All calculations in this article were carried out by the author from official data. National accounts data are from MoSPI press notes using the new series with base year 2022-23. Long-run investment and GDP series are from the IMF International Financial Statistics via FRED, with fiscal years labelled by their starting year. Contributions to growth are calculated from real levels. The ICOR is calculated with three-year averages. Forecasts are from the World Bank, the IMF and the RBI as published in October 2026. The scenarios are illustrative and based on the Harrod-Domar relationship.
References
Bosworth, B. and Collins, S. M. (2008). Accounting for Growth: Comparing China and India. Journal of Economic Perspectives, 22(1), 45 to 66.
Chari, A., Jain, P. and Kulkarni, N. (2021). The Unholy Trinity: Regulatory Forbearance, Stressed Banks and Zombie Firms. NBER Working Paper 28435.
Government of India, Ministry of Finance (2017). Economic Survey 2016-17. Chapter 4: The Festering Twin Balance Sheet Problem. New Delhi.
Government of India, Ministry of Finance (2026). Union Budget 2026-27. New Delhi.
International Monetary Fund (2026). World Economic Outlook, October 2026. Washington, DC.
International Monetary Fund (2026). International Financial Statistics: India, gross fixed capital formation and gross domestic product. Accessed via Federal Reserve Bank of St. Louis, FRED.
Ministry of Statistics and Programme Implementation (2026). Press Note on New Series of GDP Estimates with Base Year 2022-23. 27 February 2026.
Ministry of Statistics and Programme Implementation (2026). Press Note on Provisional Estimates of Annual GDP for 2025-26 and Quarterly Estimates for Q4 2025-26. May 2026.
Ministry of Statistics and Programme Implementation (2026). Press Note on Quarterly Estimates of GDP for Q1 2026-27. 31 August 2026.
Reserve Bank of India (2026). Monetary Policy Statement, 2026-27: Resolution of the Monetary Policy Committee, October 5 to 7, 2026. Mumbai.
Rodrik, D. and Subramanian, A. (2005). From “Hindu Growth” to Productivity Surge: The Mystery of the Indian Growth Transition. IMF Staff Papers, 52(2), 193 to 228.
Solow, R. M. (1956). A Contribution to the Theory of Economic Growth. Quarterly Journal of Economics, 70(1), 65 to 94.
World Bank (2026). India Development Update, October 2026: India and Artificial Intelligence. Washington, DC: World Bank.
