
Jobs for Young People and Women in India: What the Labour Force Surveys Reveal in 2026

Jobs for Young People and Women in India: What the Labour Force Surveys Reveal in 2026
Driss EFFINA, PhD Independent Researcher, Global Strategy Files Reading time: about 26 minutes
Key takeaways
- Female labour force participation in India rose from 23.3 percent in 2017-18 to 40.0 percent in 2025, mostly in rural areas.
- Only 18.2 percent of employed women hold a regular wage or salaried job, while 64.2 percent are self-employed.
- Unemployment among urban young women reached 26.6 percent in September 2026 on the monthly current weekly status measure.
- India needs about 7.5 million new jobs a year to 2030 to keep participation constant, and about 14 million to raise women's worker ratio.
Abstract
India’s economy has grown by more than 7 percent a year since 2023, but the question of whether this growth creates enough good jobs for young people and women remains open. This article uses the Periodic Labour Force Survey (PLFS) of the National Statistics Office, including the annual reports for 2017-18 to 2023-24, the new annual report for calendar year 2025 and the monthly bulletins of 2026, to measure the employment situation of these two groups. The author computes participation and unemployment trends, the structure of employment by status and sector, the earnings gap between women and men, and the number of jobs India needs to create each year to 2030 under three participation scenarios. Five results stand out. First, the labour force participation rate of women aged 15 and over rose from 23.3 percent in 2017-18 to 41.7 percent in 2023-24 and 40.0 percent in 2025, but the increase is concentrated in rural areas, where participation reached 45.9 percent in 2025, while urban female participation remains at 27.7 percent. Second, 64.2 percent of employed women are self-employed, against 52.0 percent of men, and only 18.2 percent hold a regular wage or salaried job. Third, youth unemployment measured on the annual usual status basis fell from 17.8 percent in 2017-18 to 9.9 percent in 2025, but the monthly current weekly status measure shows unemployment of 19.0 percent among urban youth and 26.6 percent among urban young women in September 2026. Fourth, women earn about 76 percent of what men earn in regular jobs and only about 36 percent in self-employment. Fifth, India needs to create about 7.5 million jobs a year to 2030 simply to keep participation constant, and about 14 million a year if the female worker ratio is to rise to 45 percent. The article concludes that the rise in female participation is real but fragile, and that the creation of regular urban jobs for educated young people and women is the central employment challenge of the decade.
Keywords: India, employment, youth unemployment, female labour force participation, informality, gender gap, Periodic Labour Force Survey, structural transformation
JEL codes: J16, J21, J23, J64, O15, O53
1. Introduction
India has the largest population in the world and one of the youngest. About a quarter of the population is aged between 15 and 29. Each year, millions of young people enter the labour market, many of them with secondary or higher education. At the same time, India has long had one of the lowest rates of female labour force participation among large economies. These two facts, a youth bulge and low female participation, make employment the central social and economic question of Indian development.
Since 2017, the Periodic Labour Force Survey has provided regular, comparable data on employment in India. The survey shows two apparently contradictory trends. On the one hand, the participation of women has risen strongly and youth unemployment has fallen. On the other hand, the quality of the jobs created is often low, a large share of new female employment is in self-employment and unpaid family work, and unemployment among educated urban youth remains very high.
This article measures these trends with the latest data available in October 2026. It asks four questions. How much has women’s participation in the labour force really increased, and where? What kind of jobs do women and young people hold? How large is the gap between the annual and monthly measures of youth unemployment, and what does it mean? And how many jobs does India need to create in the coming years?
The article is organised as follows. Section 2 presents the context. Section 3 reviews the literature. Section 4 describes the data and methods. Section 5 presents the results. Section 6 discusses them. Section 7 presents scenarios for job creation to 2030. Section 8 concludes.
2. Context
2.1 Growth and employment
As shown in the previous article in this series, India’s real GDP grew by 7.1 percent in 2024-25, 7.7 percent in 2025-26 and 7.8 percent in the first quarter of 2026-27. This growth has been driven by investment, services and, more recently, manufacturing. But rapid growth does not automatically translate into abundant good jobs. Much of the growth has come from capital-intensive sectors and high-skill services, while about 43 percent of workers are still employed in agriculture, where productivity and incomes are low.
The relationship between growth and employment has been a subject of debate in India for two decades. During the high growth years of the 2000s, observers spoke of “jobless growth”, as non-agricultural employment grew slowly relative to output. The PLFS data since 2017-18 show a more nuanced picture: total employment has grown, unemployment has fallen and participation has risen, but much of the new employment is in low-productivity activities. The question is therefore less whether growth creates jobs than what kind of jobs it creates, and for whom.
2.2 The measurement of employment
The PLFS uses two main approaches. The usual status approach (principal status plus subsidiary status) classifies a person according to the activity in which they spent most of the previous year, with an additional criterion for subsidiary work of at least 30 days. This measure captures long-term attachment to the labour force and is relatively generous: a woman who works for at least 30 days a year in a family farm is counted as employed. The current weekly status approach classifies a person according to their activity in the week preceding the survey. It is more sensitive to short-term fluctuations and gives higher unemployment rates.
Until 2024, the annual reports covered July to June agricultural years. In January 2025, the survey was redesigned: it now produces monthly estimates for the whole country, quarterly estimates and an annual report for the calendar year. The 2025 annual report, published in March 2026, warns that its estimates “may not be strictly comparable” with those of previous years. This break must be kept in mind when interpreting the trends.
2.3 Policy
Several policies aim to improve employment. The production linked incentive schemes support labour-intensive manufacturing such as textiles and electronics assembly. The Employment Linked Incentive scheme, announced in the 2024 budget, subsidises the hiring of first-time employees in the formal sector. Skill development programmes and internship schemes target young people. For women, programmes support self-help groups and access to credit, and labour codes adopted in 2025 relaxed restrictions on night work for women in several states.
3. Literature review
The literature on employment in India has three main strands.
The first concerns the low and, until recently, declining participation of women. Klasen and Pieters (2015) analysed the decline of female labour force participation in urban India between 1987 and 2011 and found that rising household incomes and education, combined with social norms and a lack of suitable jobs, led many women to withdraw from the labour force. Fletcher, Pande and Moore (2017) reviewed the evidence on the constraints facing women, including social norms about women’s mobility and work outside the home, the burden of unpaid care work and safety concerns. Afridi, Dinkelman and Mahajan (2018) showed that the decline in rural female participation was linked to rising education and household incomes and changes in agricultural technology. Deshpande and Kabeer (2019) emphasised the role of social norms and the availability of work close to home.
The second strand concerns the recent rise in female participation. Several studies, including analyses by the State of Working India reports of Azim Premji University (2023), have noted that the increase in female participation since 2018-19 has been driven largely by rural women in self-employment, often as unpaid helpers in household enterprises, particularly in agriculture. This has led to a debate on whether the increase reflects better opportunities or distress, with women joining the labour force to compensate for low household incomes.
The third strand concerns youth unemployment and the mismatch between education and jobs. The India Employment Report 2024, published by the International Labour Organization and the Institute for Human Development, found that the unemployment rate of young graduates was 29.1 percent, almost nine times the rate of young people who could not read or write. It also showed that the share of educated young people among the unemployed rose from 54.2 percent in 2000 to 65.7 percent in 2022, and that among educated unemployed youth, the share was higher for women (76.7 percent) than for men (62.2 percent). Mehrotra and Parida (2019) documented the slow pace of non-agricultural job creation in the 2010s.
The present article builds on this literature by using the most recent data, including the new 2025 annual report and the monthly bulletins of 2026, and by quantifying the job creation required under explicit participation scenarios.
4. Data and methodology
4.1 Data
The data come from:
- the PLFS annual reports for 2017-18 to 2023-24 (July to June), for long-run series of participation, worker population ratio and unemployment by sex, in usual status;
- the PLFS Annual Report 2025 (January to December 2025), published in March 2026, for the latest annual estimates, including rural and urban detail, status in employment, industry of employment and average earnings;
- the PLFS monthly bulletins of 2026 (January to September), in current weekly status;
- the Directorate General of Employment compilation of youth unemployment rates for 2017-18 to 2023-24;
- the ILO and Institute for Human Development India Employment Report 2024.
4.2 Indicators
The labour force participation rate (LFPR) is the share of the population aged 15 and over who are working or seeking work. The worker population ratio (WPR) is the share employed. The unemployment rate (UR) is the share of the labour force without work but seeking it. The youth unemployment rate refers to persons aged 15 to 29.
The author computes:
1. The gender earnings ratio, defined as average female earnings divided by average male earnings for each status in employment (regular wage or salary, self-employment, casual labour). 2. The population aged 15 and over, by dividing the number of employed persons by the worker population ratio, separately for men and women. 3. The number of jobs to be created between 2025 and 2030 under three scenarios for the female worker population ratio, assuming that the population aged 15 and over grows by 1.2 percent a year (an estimate consistent with recent demographic trends) and that the male worker ratio remains at its 2025 level.
4.3 Limitations
The change in survey design in 2025 introduces a break in the series. The usual status and current weekly status measures are not directly comparable. The PLFS earnings data are averages that do not account for differences in hours worked, occupation or education. The demographic assumption is approximate, and the scenarios do not account for changes in education enrolment, which affect the participation of young people.
5. Results
5.1 The rise of female participation
Figure 1 shows the labour force participation rates of men and women since 2017-18.
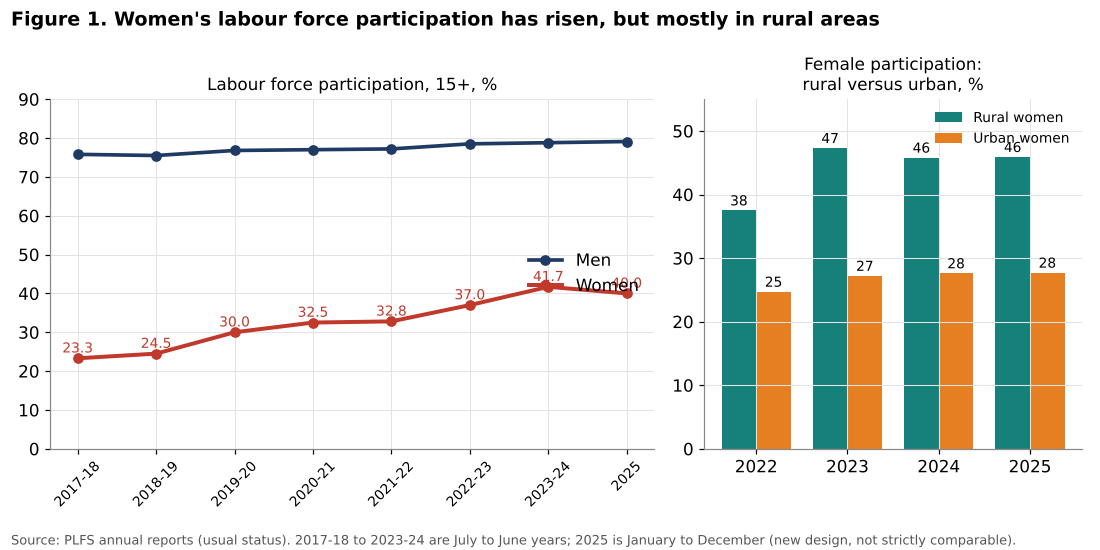
The participation of women aged 15 and over rose from 23.3 percent in 2017-18 to 30.0 percent in 2019-20, 37.0 percent in 2022-23 and 41.7 percent in 2023-24. In the new 2025 annual report, it was 40.0 percent. Male participation, by contrast, rose only slightly, from 75.8 percent to 79.1 percent. The gender gap in participation has therefore narrowed from 52.5 percentage points in 2017-18 to 39.1 points in 2025.
This is a substantial change. In absolute terms, the PLFS 2025 estimates that 20.0 crore (200 million) women were employed in 2025, out of a total of 61.6 crore employed persons. The share of women in total employment is therefore about 32 percent.
However, the right panel of Figure 1 shows that the increase is concentrated in rural areas. In 2025, the participation of rural women was 45.9 percent, against 37.5 percent in 2022, while urban female participation was only 27.7 percent, up from 24.7 percent. The jump in rural female participation occurred mainly between 2022 and 2023. Since 2023, both rural and urban rates have been roughly stable.
| Indicator (2025, usual status, 15+) | Men | Women | Persons |
|---|---|---|---|
| Labour force participation rate | 79.1 | 40.0 | 59.3 |
| Worker population ratio | 76.6 | 38.8 | 57.4 |
| Unemployment rate | 3.1 | 3.1 | 3.1 |
| Rural women LFPR | 45.9 | ||
| Urban women LFPR | 27.7 |
Table 1. Main labour market indicators in 2025. Source: PLFS Annual Report 2025.
The monthly current weekly status data for 2026 show lower rates of female participation, as expected from a stricter measure: 34.8 percent in August 2026, with 39.4 percent in rural areas and 25.4 percent in urban areas. The monthly series also shows seasonal fluctuations: female participation fell from 35.3 percent in February 2026 to 32.7 percent in June, then rose to 34.8 percent in August, following the agricultural calendar.
5.2 Youth unemployment: two measures, two stories
Figure 2 compares two measures of youth unemployment.
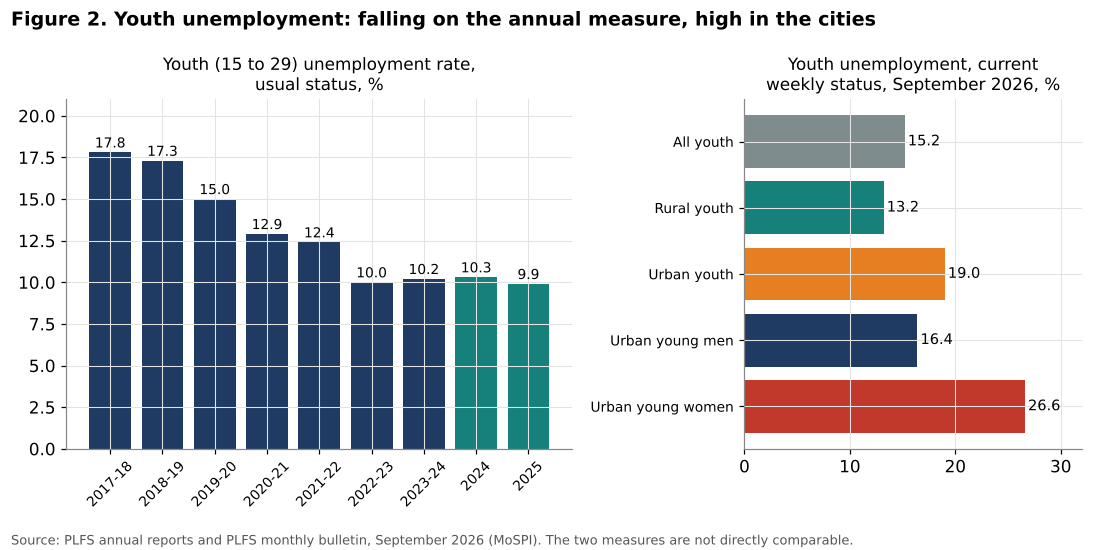
On the annual usual status basis, youth unemployment fell from 17.8 percent in 2017-18 to 12.4 percent in 2021-22 and 10.0 percent in 2022-23. It was 10.2 percent in 2023-24, 10.3 percent in 2024 and 9.9 percent in 2025. In urban areas, it was 13.6 percent in 2025, against 8.3 percent in rural areas.
The monthly current weekly status data give a very different picture. In September 2026, the unemployment rate of young people aged 15 to 29 was 15.2 percent nationally, 13.2 percent in rural areas and 19.0 percent in urban areas. Among urban young women, it reached 26.6 percent, against 16.4 percent among urban young men. Urban youth unemployment has been rising during 2026: it was 17.5 percent in May and 18.7 percent in August.
The difference between the two measures is large: about 5 percentage points for all youth. It reflects the way each measure treats intermittent work. On the usual status basis, a young person who worked for 30 days or more during the year is counted as employed, even if they are looking for work at the time of the survey. On the weekly basis, the same person may be counted as unemployed if they did not work during the reference week. The monthly measure therefore captures the precariousness of the jobs held by young people better than the annual measure.
The very high unemployment rate of urban young women, more than one in four of those in the labour force, is particularly striking. It suggests that the young women who do enter the urban labour market, often after completing secondary or higher education, find it very difficult to obtain a job. This is consistent with the findings of the ILO India Employment Report 2024 on the unemployment of educated young people, especially women.
5.3 The quality of employment
Figure 3 shows the distribution of workers by status in employment in 2025.
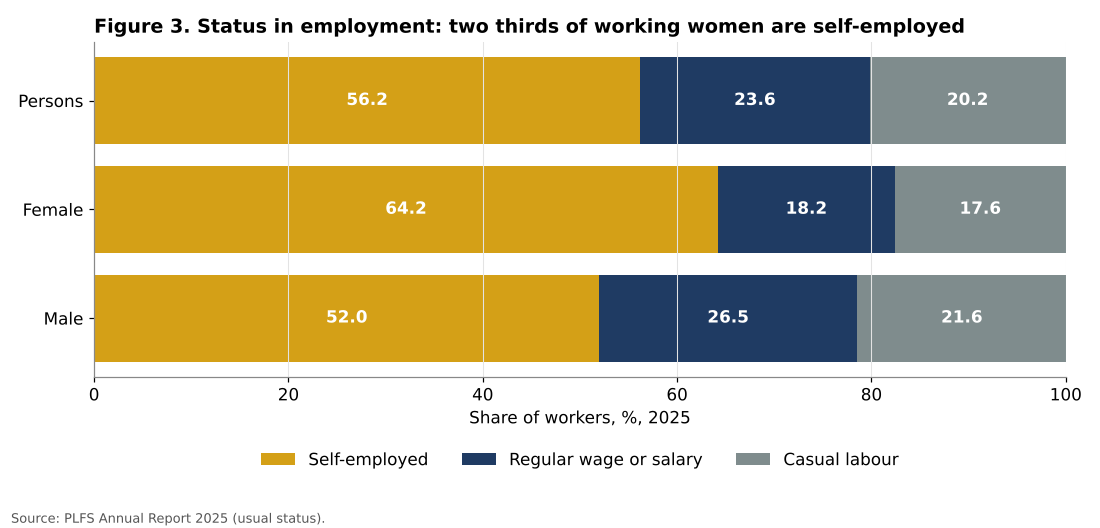
In 2025, 56.2 percent of Indian workers were self-employed, 23.6 percent were regular wage or salary employees and 20.2 percent were casual labourers. Among women, the share of self-employment was 64.2 percent, against 52.0 percent among men. Only 18.2 percent of employed women had a regular wage or salary job, against 26.5 percent of men.
Self-employment in India covers very different situations: the owner of a profitable small business, a street vendor, a small farmer, and an unpaid helper in a family enterprise. The PLFS distinguishes own-account workers, employers and helpers in household enterprises. Studies of the PLFS microdata have shown that a large part of the increase in female employment since 2018-19 consists of unpaid helpers in household enterprises, particularly on family farms. This type of work is counted as employment in the labour force statistics, but it does not provide women with an independent income.
There are, however, positive signs. Between 2024 and 2025, the share of regular wage or salary jobs among women rose from 16.6 to 18.2 percent, while the share of self-employment fell from 66.5 to 64.2 percent. Among all workers, the share of regular jobs rose from 22.4 to 23.6 percent. If confirmed in future surveys, this would indicate a gradual improvement in the quality of employment.
5.4 The gender earnings gap
Figure 4 shows women’s average earnings as a percentage of men’s for each type of work.
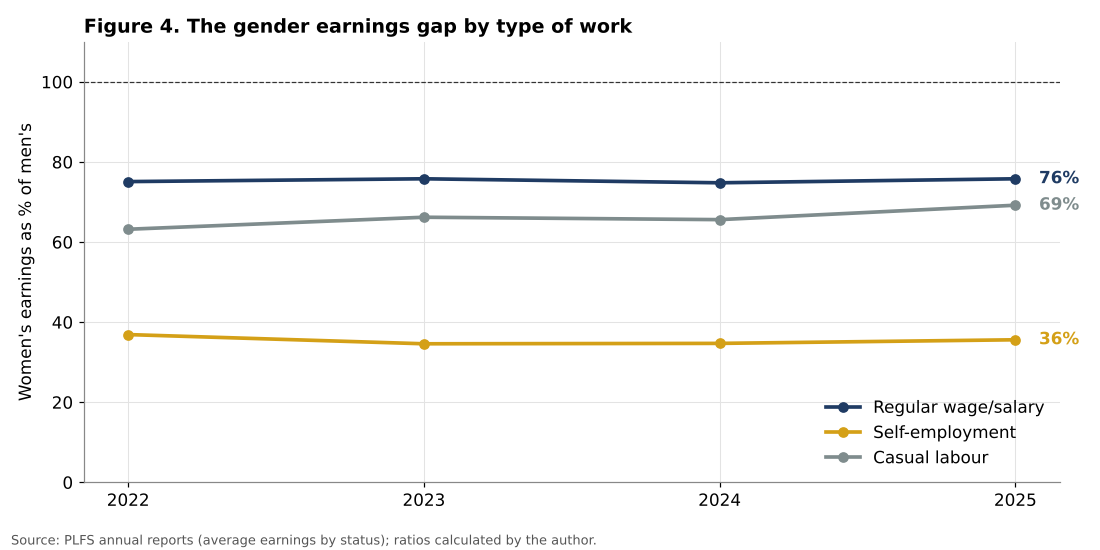
In regular wage or salary employment, women earned on average 18,353 rupees per month in 2025, against 24,217 rupees for men, a ratio of 75.8 percent. This ratio has been roughly stable since 2022. In casual labour, women earned 315 rupees per day, against 455 rupees for men, a ratio of 69.2 percent, up from 63.2 percent in 2022. In self-employment, the gap is much wider: women earned 6,374 rupees per month on average, against 17,914 rupees for men, a ratio of only 35.6 percent.
| Type of work | Men, 2025 | Women, 2025 | Ratio (%) | Men, growth 2022 to 2025 | Women, growth 2022 to 2025 |
|---|---|---|---|---|---|
| Regular wage/salary (Rs per month) | 24,217 | 18,353 | 75.8 | +18.0% | +19.1% |
| Self-employment (Rs per month) | 17,914 | 6,374 | 35.6 | +23.4% | +18.9% |
| Casual labour (Rs per day) | 455 | 315 | 69.2 | +7.3% | +17.5% |
Table 2. Average earnings by sex and status. Source: PLFS annual reports; ratios and growth rates calculated by the author.
The very low ratio in self-employment is linked to the nature of female self-employment: small-scale, part-time activities, often combined with domestic responsibilities, and concentrated in low-productivity sectors. It shows that the increase in female participation, which has been driven largely by self-employment, has not been accompanied by an equivalent increase in women’s economic independence.
The growth of nominal earnings between 2022 and 2025 was between 18 and 23 percent in regular and self-employment for both sexes. Over the same period, cumulative consumer price inflation was of the order of 12 to 14 percent (author’s estimate based on annual CPI inflation), which implies modest real gains of about 1.5 to 3 percent per year. Casual wages for men barely increased in nominal terms between 2024 and 2025 (455 rupees against 456), which implies a fall in real terms.
5.5 The structure of employment by sector
Figure 5 shows the distribution of workers by industry in 2024 and 2025.
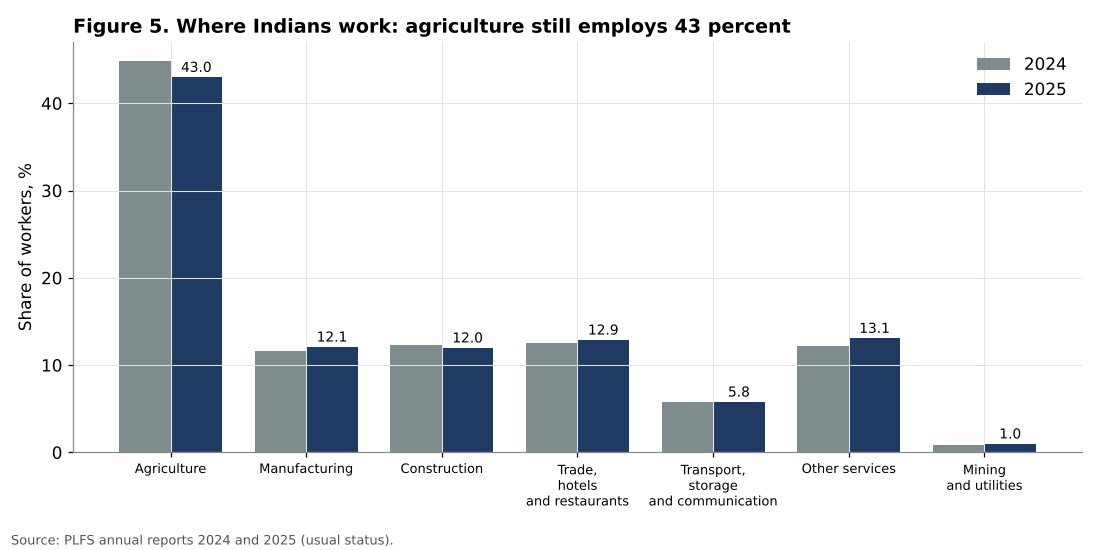
Agriculture still employed 43.0 percent of workers in 2025, down from 44.8 percent in 2024. Manufacturing employed 12.1 percent, construction 12.0 percent, trade, hotels and restaurants 12.9 percent, transport, storage and communication 5.8 percent, and other services 13.1 percent.
The slight decline in the share of agriculture between 2024 and 2025 and the increase in the shares of manufacturing and other services are positive signs of structural transformation. But the pace of change is slow. In 2017-18, according to the RBI’s KLEMS database, agriculture accounted for about 42 percent of employment, and this share actually increased during the pandemic, when many workers returned to their villages. The structural transformation of the Indian labour market, the movement of workers from agriculture to higher productivity sectors, has therefore been very slow over the past decade.
This matters for women in particular. A large share of women’s employment is in agriculture, often as unpaid helpers. The movement of women into non-agricultural work requires the creation of jobs in sectors and places that are accessible to them, including manufacturing in industrial clusters near towns, services and the care economy.
5.6 Unemployment in 2026
The monthly bulletins of 2026 show that the overall unemployment rate of persons aged 15 and over, in current weekly status, fluctuated between 4.9 and 5.5 percent. It rose from 4.9 percent in February to 5.5 percent in May and June, during the agricultural lean season and the heat wave, then fell back to 5.0 percent in August and September. Urban unemployment was 6.9 percent in September 2026 and rural unemployment 4.2 percent. Among urban women, unemployment was 9.2 percent.
| Month (2026) | Overall | Rural | Urban | Male | Female |
|---|---|---|---|---|---|
| January | 5.0 | 4.2 | 7.0 | 4.8 | 5.6 |
| March | 5.1 | 4.3 | 6.8 | 5.0 | 5.3 |
| May | 5.5 | 5.1 | 6.4 | 5.4 | 5.6 |
| July | 5.1 | 4.5 | 6.7 | 5.0 | 5.4 |
| August | 5.0 | 4.1 | 6.8 | 4.9 | 5.1 |
Table 3. Unemployment rate, current weekly status, persons 15+, %. Source: PLFS monthly bulletins.
The stability of the overall unemployment rate is consistent with strong growth. But the gradual rise in urban youth unemployment during 2026 is a warning sign, especially as growth is expected to slow in the second half of the fiscal year.
5.7 Education and the labour market
The PLFS 2025 reports that the average number of years of formal education of persons aged 15 and over reached 10.0 years, with 10.2 years for men and 9.9 years for women. The gender gap in education has therefore almost disappeared among the working-age population, and among the youngest cohorts, girls now often stay in school as long as boys. This is a major achievement of Indian education policy over the past three decades.
Yet the near closure of the education gap has not been matched by a closure of the employment gap. In 2025, the worker population ratio of women was 38.8 percent, half that of men (76.6 percent). Better educated women are not necessarily more likely to work: in urban areas, where education levels are highest, female participation is lowest. This apparent paradox is consistent with the literature: education raises women’s reservation wage and their expectations about suitable work, while the supply of jobs considered suitable, such as regular jobs in offices, schools, hospitals and modern factories, remains limited. At the same time, higher household incomes allow some educated women to stay out of the labour force.
The consequence is that a significant share of the investment that Indian families and the state make in the education of girls does not translate into paid work. From the point of view of the economy, this is a loss of potential output. From the point of view of women, it is a loss of autonomy and income.
6. Discussion
6.1 A real but fragile increase in female participation
The rise of female participation in India since 2017-18 is one of the most significant changes in the Indian labour market in decades. It has narrowed the gender gap and increased the measured labour force by tens of millions of women. But the analysis shows that this increase has three limitations.
First, it is concentrated in rural areas and in self-employment, often unpaid family work. Second, it has stalled since 2023: rural female participation fell slightly between 2023 and 2024, and urban female participation remained below 28 percent. Third, the earnings of self-employed women are very low, about a third of those of self-employed men.
The debate on whether this increase reflects opportunity or distress does not have a simple answer. Some women have certainly benefited from improved access to credit, self-help groups, digital payments and rural infrastructure. Others have joined the labour force to supplement household incomes that stagnated in real terms after the pandemic. What the data show unambiguously is that the transition of women into regular, paid, non-agricultural work remains limited.
6.2 The educated unemployed
The high unemployment of young, educated urban people, and particularly young women, is a structural problem. The Indian education system produces many graduates, but the economy creates relatively few formal jobs that match their qualifications. Many young people prefer to wait for a public sector job or a formal private sector position rather than accept informal work, and their families can support them during this search. This explains why unemployment is higher among the educated than among those with little education, who cannot afford to remain unemployed.
For young women, additional barriers exist: restrictions on mobility, safety concerns, the expectation of marriage, and the lack of jobs close to home. The result is a large pool of educated young women who are either unemployed or outside the labour force. This represents a large loss of human capital.
6.3 Growth and job creation
The analysis raises the question of the employment intensity of India’s growth. Growth of 7 to 8 percent should, in principle, create a large number of jobs. The PLFS data show that employment has grown, and that unemployment has fallen on the annual measure. But the composition of job creation is skewed toward self-employment and agriculture, and the creation of regular wage jobs has been slow.
The sectors that have driven growth, such as financial services, information technology and capital-intensive manufacturing, create relatively few jobs per unit of output. Labour-intensive sectors such as textiles, garments, leather, food processing and construction create more jobs, but have grown less rapidly. A strategy for employment must therefore focus on the sectoral composition of growth, not only its rate.
6.4 The role of artificial intelligence
The development of artificial intelligence adds a new dimension. The World Bank’s India Development Update of October 2026 highlights the opportunities that AI offers India, notably through global capability centres, which employed about 2.36 million professionals in 2025. But AI may also automate some of the routine cognitive tasks that have provided entry-level jobs for educated young people in services, such as data processing, customer support and basic programming. The impact of AI on productivity and employment is examined in the next article in this series.
6.5 The U-shaped curve and social norms
The international literature offers a useful framework for interpreting Indian trends. Goldin (1995) proposed that female participation follows a U-shaped curve during economic development: it is high in poor agricultural economies, where women work on family farms, falls as incomes rise and work shifts to factories that are socially less acceptable for women, and rises again when education increases and white-collar service jobs become available. India’s history since the 1980s fits the first two phases of this curve: female participation fell steadily until about 2017-18 as incomes rose and agriculture declined.
The recent increase could be interpreted as the beginning of the rising part of the curve, but the evidence suggests caution. The increase has occurred mainly in rural agriculture and self-employment, not in the white-collar urban jobs that characterise the rising part of the U. The rising part of the curve in India therefore remains to be achieved, and its timing will depend on the creation of suitable jobs and on changes in social norms regarding women’s work outside the home, which are evolving, but slowly.
6.6 Policy implications
The analysis suggests five priorities:
1. Labour-intensive manufacturing and services should be supported, particularly in industrial clusters located near towns where women can work. 2. The care economy, including childcare and elder care, should be developed, both to create jobs for women and to reduce the burden of unpaid care work that keeps many women out of the labour force. 3. Women’s safety and mobility should be improved through public transport, lighting, housing for working women and enforcement of laws against harassment. 4. The match between education and jobs should be improved through vocational training, apprenticeships and closer links between universities and employers. 5. Statistical monitoring should be strengthened, including regular publication of data on unpaid helpers, informal employment and earnings, so that the quality as well as the quantity of employment can be tracked.
7. Scenarios for job creation to 2030
7.1 Method
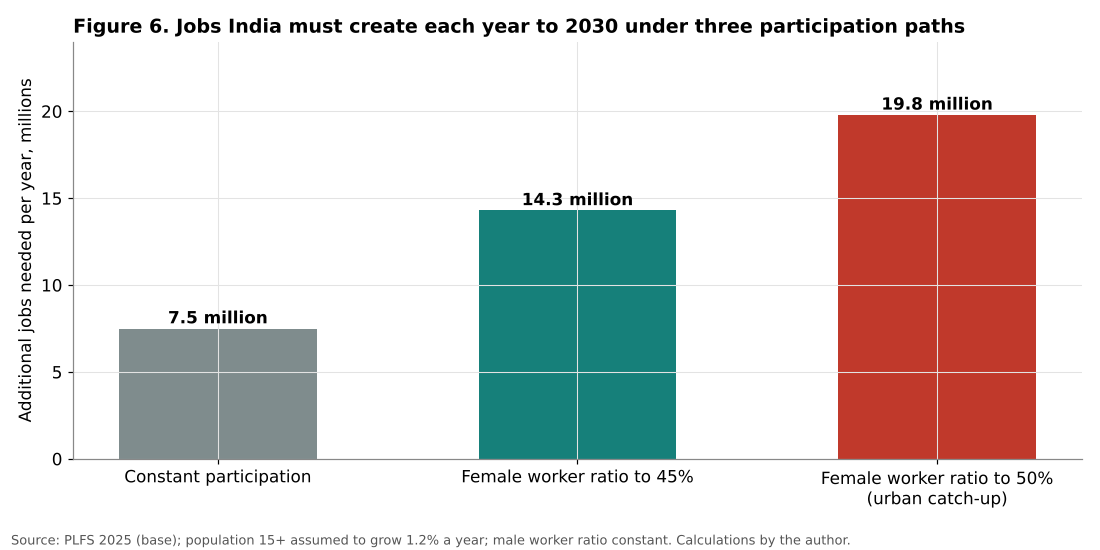
Figure 6 presents the number of jobs India needs to create each year between 2025 and 2030 under three scenarios.
The starting point is the PLFS 2025: 61.6 crore employed persons, including 41.6 crore men and 20.0 crore women, with worker population ratios of 76.6 percent for men and 38.8 percent for women. Dividing employment by the worker population ratio gives a population aged 15 and over of about 54.3 crore men and 51.5 crore women, or about 105.8 crore in total. The author assumes that this population grows by 1.2 percent per year and that the male worker ratio remains constant.
Scenario 1: Constant participation. The female worker ratio remains at 38.8 percent. India needs to create about 3.8 crore jobs over five years, or about 7.5 million per year, simply to absorb population growth.
Scenario 2: Female worker ratio rises to 45 percent. This would bring the national rate to roughly the current level of rural women. India would need to create about 7.2 crore jobs over five years, or about 14.3 million per year.
Scenario 3: Female worker ratio rises to 50 percent. This more ambitious scenario would bring India closer to the levels of other large middle-income countries. It would require about 9.9 crore jobs over five years, or about 19.8 million per year.
7.2 Interpretation
Even the constant participation scenario requires the creation of 7.5 million jobs per year. If these jobs are to be of good quality, that is, regular wage or salary jobs outside agriculture, the challenge is considerable. The scenarios with higher female participation double or almost triple this requirement.
To put these figures in perspective, if India were to raise its female worker ratio to the level of men, there would be about 19.5 crore (195 million) additional women in work. This “missing female workforce” is one of the largest untapped economic resources in the world. Studies by the McKinsey Global Institute and the IMF have suggested that closing the gender gap in participation could raise India’s GDP significantly.
The scenarios also show that job creation is not only a matter of growth. Even with 7 percent growth, the creation of 14 to 20 million jobs per year would require a much more labour-intensive pattern of growth than India has experienced in the past decade.
7.3 Sensitivity of the scenarios
The scenarios depend on two assumptions that deserve discussion. The first is the growth of the population aged 15 and over. If it grows by 1.0 percent per year rather than 1.2 percent, the number of jobs required in the constant participation scenario falls to about 6.2 million per year; if it grows by 1.4 percent, it rises to about 8.8 million. India’s demographic transition is well advanced in the southern states, where fertility is below replacement, but much less so in the large northern states, so the national average hides very different regional situations.
The second assumption is the male worker ratio. It is held constant at 76.6 percent, but it could fall if more young men stay in education for longer, which is the long-term trend. In that case, fewer jobs would be needed in the short term, but the same young men would enter the labour market later with higher qualifications and higher expectations, adding to the pressure on the supply of regular, skilled jobs. Rising education therefore postpones the employment challenge but also changes its nature: the issue is increasingly the quality of jobs rather than their number.
7.4 Indicators to monitor
The author suggests monitoring:
1. The monthly urban youth unemployment rate, by sex, in the PLFS bulletins. 2. The share of regular wage or salary employment among women in the annual reports. 3. The share of unpaid helpers in female employment. 4. Urban female labour force participation. 5. The share of agriculture in total employment.
8. Conclusion
India’s labour market has changed significantly since 2017-18. Female participation has risen from about 23 percent to about 40 percent, and youth unemployment on the annual measure has fallen from about 18 percent to about 10 percent. These are real improvements.
But the analysis shows that they are incomplete and fragile:
1. The rise in female participation is concentrated in rural areas and in self-employment. Urban female participation remains below 28 percent. 2. Only 18.2 percent of employed women have a regular wage or salary job, and self-employed women earn about 36 percent of what self-employed men earn. 3. Youth unemployment remains very high in cities on the monthly measure: 19.0 percent for urban youth and 26.6 percent for urban young women in September 2026. 4. Agriculture still employs 43 percent of workers, and structural transformation has been slow. 5. India needs to create between 7.5 and 20 million jobs per year to 2030, depending on the evolution of female participation.
The central employment challenge of the coming decade is therefore not only to create jobs, but to create regular, paid, non-agricultural jobs in places where young people and women can access them. This requires a more labour-intensive pattern of growth, investment in the care economy and in women’s mobility and safety, and a closer match between education and employment.
Need this analysis for your organisation?
We prepare confidential briefings, executive talks and studies on countries, markets and policies, built on the same method as this article.
Request a briefingSupport independent analysis
Our studies are free to read and carry no advertising. If this one was useful, a small contribution helps us publish the next.
Support our workGo further: books by Global Strategy Files
Frequently asked questions
How many women work in India?
The labour force participation rate of Indian women aged 15 and over rose from 23.3 percent in 2017-18 to 41.7 percent in 2023-24 and 40.0 percent in 2025. The increase is concentrated in rural areas, at 45.9 percent, while urban female participation remains at 27.7 percent.
What is youth unemployment in India in 2026?
Youth unemployment on the annual usual status basis fell from 17.8 percent in 2017-18 to 9.9 percent in 2025. However, the monthly current weekly status measure showed unemployment of 19.0 percent among urban youth and 26.6 percent among urban young women in September 2026.
What kind of jobs do women in India hold?
Most working women in India are self-employed: 64.2 percent, against 52.0 percent of men. Only 18.2 percent hold a regular wage or salaried job, and women earn about 76 percent of what men earn in regular jobs and only about 36 percent in self-employment.
How many jobs does India need to create each year?
India needs to create about 7.5 million jobs a year until 2030 simply to keep labour force participation constant, and about 14 million a year if the female worker population ratio is to rise to 45 percent.
Methodological note
All calculations were carried out by the author from the PLFS annual reports and monthly bulletins of the National Statistics Office. The 2025 annual report uses a new survey design and is not strictly comparable with earlier reports. The earnings ratios are calculated from average earnings by status and sex. The population aged 15 and over is derived by dividing employment by the worker population ratio. The job creation scenarios assume population growth of 1.2 percent per year and a constant male worker ratio, and are illustrative.
References
Afridi, F., Dinkelman, T. and Mahajan, K. (2018). Why Are Fewer Married Women Joining the Work Force in Rural India? A Decomposition Analysis over Two Decades. Journal of Population Economics, 31(3), 783 to 818.
Azim Premji University (2023). State of Working India 2023: Social Identities and Labour Market Outcomes. Centre for Sustainable Employment, Bengaluru.
Deshpande, A. and Kabeer, N. (2019). (In)Visibility, Care and Cultural Barriers: The Size and Shape of Women’s Work in India. Ashoka University Discussion Paper 10.
Directorate General of Employment (2025). Employment Situation in India. Ministry of Labour and Employment, New Delhi.
Fletcher, E., Pande, R. and Moore, C. T. (2017). Women and Work in India: Descriptive Evidence and a Review of Potential Policies. Harvard Kennedy School Faculty Research Working Paper RWP18-004.
Goldin, C. (1995). The U-Shaped Female Labor Force Function in Economic Development and Economic History. In T. P. Schultz (ed.), Investment in Women’s Human Capital. University of Chicago Press, 61 to 90.
International Labour Organization and Institute for Human Development (2024). India Employment Report 2024: Youth Employment, Education and Skills. New Delhi.
Klasen, S. and Pieters, J. (2015). What Explains the Stagnation of Female Labor Force Participation in Urban India? World Bank Economic Review, 29(3), 449 to 478.
Mehrotra, S. and Parida, J. K. (2019). India’s Employment Crisis: Rising Education Levels and Falling Non-Agricultural Job Growth. Centre for Sustainable Employment Working Paper 23, Azim Premji University.
Ministry of Statistics and Programme Implementation (2024). Periodic Labour Force Survey Annual Report, July 2023 to June 2024. New Delhi.
Ministry of Statistics and Programme Implementation (2026). Periodic Labour Force Survey Annual Report 2025, January to December 2025. New Delhi.
Ministry of Statistics and Programme Implementation (2026). Periodic Labour Force Survey Monthly Bulletins, January to September 2026. New Delhi.
World Bank (2026). India Development Update, October 2026: India and Artificial Intelligence. Washington, DC.
