
Financing National Priorities Under a Debt Constraint: The United Kingdom’s Public Finances Before the Autumn 2026 Budget


Financing National Priorities Under a Debt Constraint: The United Kingdom’s Public Finances Before the Autumn 2026 Budget
Driss EFFINA, PhD Independent Researcher, Global Strategy Files Reading time: about 26 minutes
Key takeaways
- UK public sector net debt is close to 94 percent of GDP, a level last seen in the early 1960s.
- Net borrowing reached 77.3 billion pounds in the first five months of 2026-27, 8.1 billion or about 12 percent above the OBR forecast.
- Central government debt interest reached 50.0 billion pounds over the same period, about 11 percent of current receipts.
- With the effective interest rate close to nominal growth, small rate or growth changes move the UK debt path by several points of GDP.
Abstract
The United Kingdom approaches its Autumn Budget of 28 October 2026 with net debt close to 94 percent of GDP, a level last seen in the early 1960s, borrowing above the official forecast and rising interest costs. According to the Office for National Statistics (ONS), public sector net borrowing reached £77.3 billion in the first five months of the 2026-27 financial year, £8.1 billion or about 12 percent more than forecast by the Office for Budget Responsibility (OBR) in March. Central government debt interest payments amounted to £50.0 billion over the same period, equivalent to about 11 percent of current receipts. This article analyses the choices facing the government between taxation, public services and investment, using the ONS public sector finances release for August 2026 and a set of calculations carried out by the author: a seasonal projection of full-year borrowing, an estimate of the primary balance, a decomposition of the erosion of fiscal headroom, the debt-stabilising primary balance as a function of the gap between the interest rate and growth, and three scenarios for net debt to 2030-31. The main finding is that the United Kingdom’s fiscal problem is not one of runaway deficits, since receipts are growing faster than spending and the primary deficit is small, but one of sensitivity: with the effective interest rate on debt close to nominal growth, small changes in market interest rates or growth prospects move the debt path by several percentage points of GDP and absorb most of the margin available under the fiscal rules. The article concludes that the central question of the Budget is less the size of any single tax or spending measure than the credibility of a medium-term path that reduces this sensitivity.
Keywords: United Kingdom, public finances, public sector net borrowing, net debt, fiscal rules, fiscal headroom, debt interest, debt sustainability, taxation, public investment
JEL codes: E62, H50, H60, H62, H63, H68
1. Introduction
Every government faces a basic constraint: what it spends must be financed by taxes or by borrowing, and borrowing today must be serviced tomorrow. For most of the period between the financial crisis of 2008 and the pandemic of 2020, this constraint was softened in the United Kingdom by exceptionally low interest rates. Debt could rise without a large increase in interest payments, because the cost of borrowing was lower than the growth of the economy. That period has ended. Since 2022, interest rates have returned to levels not seen for fifteen years, and the United Kingdom now carries a debt stock close to the size of its annual GDP at a much higher cost.
The topic of this article, as formulated in the list of themes for this series, is how the United Kingdom can finance its national priorities under the constraint of debt, examining the choices between taxation, public services and investment as the Budget approaches. These priorities are numerous: the National Health Service, defence spending in a more dangerous international environment, public investment in infrastructure and housing, support for households facing an energy price shock, and the reform of the welfare system. Each has a strong case. Together, they exceed the resources available without either higher taxes or more borrowing.
The Chancellor of the Exchequer, John Healey, will present his first Budget on 28 October 2026, accompanied by a new OBR forecast. The ONS release of 22 September 2026 on public sector finances for August provides the latest official picture before that event. This article uses it as its main source and asks four questions. What is the current state of the public finances? How much room is left under the fiscal rules? What determines the path of debt in the medium term? And what are the options for financing new priorities?
The article is deliberately neutral on the political choices involved. The purpose is to provide a quantitative framework that allows the reader to assess the consequences of different options, not to recommend any particular mix of taxes and spending.
Section 2 sets out the context. Section 3 reviews the literature. Section 4 describes the data and methodology. Section 5 presents the results. Section 6 discusses them. Section 7 presents scenarios to 2030-31. Section 8 concludes.
2. Context
2.1 Two decades of rising debt
At the start of the 2000s, UK public sector net debt was about 30 percent of GDP. It rose sharply after the financial crisis of 2008 and 2009, when borrowing reached about 10 percent of GDP, and again during the pandemic, when borrowing peaked at £311 billion, or about 14.7 percent of GDP, in 2020-21. Since then, borrowing has fallen but has remained well above pre-pandemic levels. In 2024-25, public sector net borrowing was £149.8 billion, about 5 percent of GDP; in 2025-26, it was £134.3 billion, or 4.4 percent of GDP.
Net debt, the headline measure, stood at £2,985.5 billion at the end of August 2026, equivalent to 93.8 percent of GDP. Excluding the Bank of England, whose balance sheet affects the measure because of its asset purchase and lending schemes, net debt was 90.2 percent of GDP. Public sector net financial liabilities (PSNFL), a broader measure that takes into account a wider range of financial assets, was 82.3 percent of GDP. According to the ONS, net debt is at levels last seen in the early 1960s.
2.2 The fiscal rules
The current fiscal framework, adopted in 2024, contains two main rules. The stability rule requires the current budget, that is, day-to-day spending excluding investment, to be in balance or surplus by the target year, 2029-30 in the most recent forecasts. The investment rule requires public sector net financial liabilities to be falling as a share of GDP by the same year. The rules allow the government to borrow for investment but not for current spending.
The margin by which the government is forecast to meet the stability rule is called “headroom”. In the OBR forecast of March 2026, headroom was about £23.6 billion in 2029-30, up by about £2 billion from the previous forecast. This margin is small relative to the size of the public finances: total managed expenditure is well over £1,300 billion a year. Small changes in forecasts of growth, interest rates or tax receipts can therefore eliminate it.
2.3 The macroeconomic environment
The Budget comes at a difficult time. As discussed in the previous article in this series, an energy price shock linked to the conflict in the Middle East has pushed inflation back above 3 percent, and the Bank of England has held Bank Rate at 3.75 percent while three members of its Monetary Policy Committee voted for an increase. Market expectations of future interest rates have risen, and long-term government bond yields have increased. According to market analysts, the 10-year gilt yield has risen by about 70 basis points since the OBR’s March forecast and has reached levels not seen since 2007.
Higher interest rates affect the public finances through several channels: the cost of new borrowing, the refinancing of maturing debt, the cost of index-linked gilts when inflation rises, and the interest paid by the Bank of England on reserves held by commercial banks, which is borne by the Treasury through the Asset Purchase Facility. All these channels are operating in 2026.
2.4 The political setting
The government is committed not to raise the main rates of income tax, National Insurance contributions paid by employees, or VAT, in line with its 2024 manifesto. The previous Chancellor raised taxes significantly in her two Budgets, mainly through higher employer National Insurance contributions and the freezing of income tax thresholds. Several spending pressures have emerged since then, including defence, energy support, the cost of welfare and the funding of public services. In 2026, the government has already introduced several measures to help households with the cost of living, including VAT cuts on electricity, a cap on bus fares and an extension of the fuel duty cut.
3. Literature review
The economic literature on public debt provides several tools for analysing the UK situation.
The first is the debt dynamics equation, which links the change in the debt ratio to the primary balance and to the difference between the interest rate on debt (r) and the growth rate of nominal GDP (g). When r is lower than g, a country can run a primary deficit and still see its debt ratio stabilise or fall. When r exceeds g, a primary surplus is needed. Blanchard (2019), in his presidential address to the American Economic Association, argued that in an environment where r was persistently below g, the fiscal cost of public debt was lower than usually assumed. The rise in interest rates since 2022 has challenged this conclusion for many advanced economies, including the United Kingdom.
The second is the analysis of fiscal reaction functions. Bohn (1998) showed that a sufficient condition for debt sustainability is that the primary surplus responds positively to the level of debt. A government that increases its primary balance when debt rises will keep debt on a sustainable path, even if debt is high. This approach shifts the focus from the level of debt to the behaviour of fiscal policy.
The third is the literature on the effects of high debt on growth. Reinhart and Rogoff (2010) suggested that growth tends to be lower when debt exceeds about 90 percent of GDP. Their results were challenged by Herndon, Ash and Pollin (2014), who found errors in the original calculations and showed that the relationship was much weaker. The consensus today is that there is no single threshold, but that high debt reduces a country’s ability to respond to future shocks.
The fourth concerns fiscal rules. Portes and Wren-Lewis (2015) analysed the design of fiscal rules and argued that rules should allow borrowing for investment while constraining current spending, an approach close to the current UK framework. They also warned against rules that are too sensitive to short-term forecast changes, which can lead to frequent policy adjustments. The OBR’s Fiscal Risks and Sustainability reports regularly underline the vulnerability of UK public finances to interest rate shocks, given the high share of index-linked debt and the short effective maturity of the consolidated public sector balance sheet once the Bank of England’s reserves are taken into account.
The fifth is the experience of the United Kingdom itself. The market reaction to the “mini-budget” of September 2022, when unfunded tax cuts led to a sharp rise in gilt yields and forced the Bank of England to intervene to stabilise pension funds, is a reminder that fiscal credibility can be lost quickly. This episode has shaped the approach of all subsequent governments.
4. Data and methodology
4.1 Data
The main source is the ONS statistical bulletin “Public sector finances, UK: August 2026”, published on 22 September 2026, and its accompanying tables. The bulletin provides monthly and cumulative data on borrowing, receipts, spending, debt interest and the stock of debt, as well as comparisons with the OBR forecast of March 2026. Additional information comes from the House of Commons Library briefing on public finances and from publicly reported estimates by market analysts and the press ahead of the Budget, which are clearly identified as such.
4.2 Projection of full-year borrowing
Monthly borrowing follows a seasonal pattern: receipts are particularly high in January and July, when self-assessed income tax is paid. A simple multiplication of five months of data by 12/5 would therefore be misleading. The author uses the seasonal profile of the previous year: in 2025-26, borrowing in April to August (£79.5 billion) represented 59.2 percent of full-year borrowing (£134.3 billion). Applying the same share to the 2026-27 year-to-date figure gives an estimate of full-year borrowing.
4.3 Nominal GDP and ratios
The ONS publishes debt both in pounds and as a share of GDP. The implied nominal GDP (rolling 12 months) is obtained by dividing the two. For 2026-27 as a whole, the author assumes nominal GDP about 2 percent higher than the rolling figure at the end of August.
4.4 Primary balance
The primary balance is net borrowing excluding debt interest. Debt interest for the full year is estimated by annualising the year-to-date figure (£50.0 billion over five months). This is likely an upper bound, since the year-to-date figure includes large index-linked uplifts. The resulting primary balance is therefore a rough estimate.
4.5 Debt-stabilising primary balance
The primary balance needed to stabilise the debt ratio d is approximately:
pb\ = d × (r – g) / (1 + g)*
where r is the effective nominal interest rate on debt and g is nominal GDP growth. The effective interest rate is estimated as annualised debt interest divided by the stock of net debt.
4.6 Debt projections
Debt projections to 2030-31 use the same equation, starting from net debt at the end of March 2026 (93.3 percent of GDP), with assumed paths for r, g and the primary balance.
4.7 Limitations
The projections are illustrative and much simpler than the OBR’s models. The estimate of debt interest is approximate. The headroom bridge relies on press estimates. All figures for 2025-26 and 2026-27 are provisional and subject to revision; the ONS will publish data for September on 21 October 2026, and the OBR will publish its new forecast on 28 October.
5. Results
5.1 The level of debt
Figure 1 shows the three main measures of public debt at the end of the last two financial years and in August 2026.
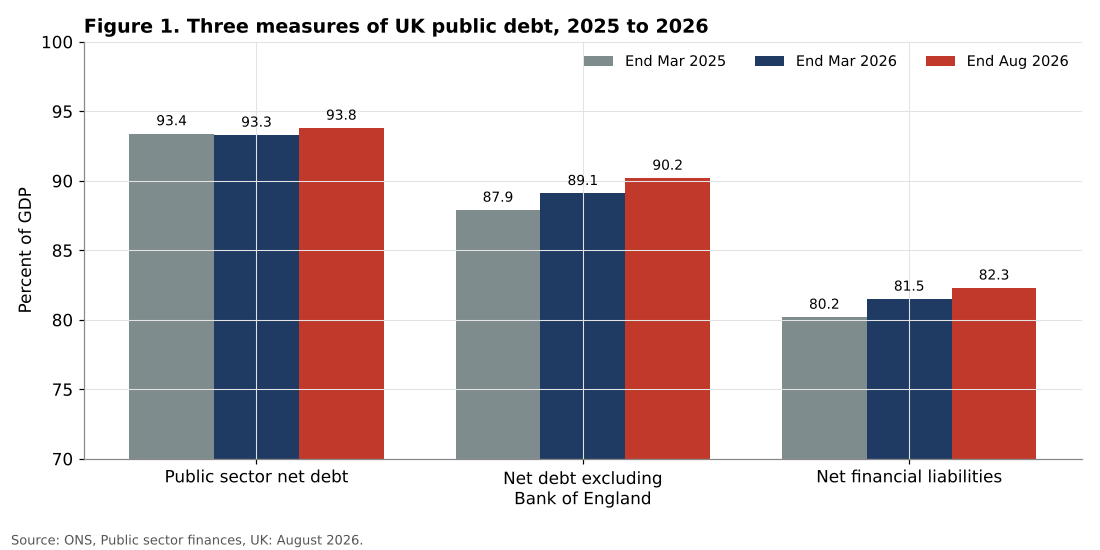
All three measures have risen over the period. Net debt went from 93.4 percent of GDP at the end of March 2025 to 93.3 percent at the end of March 2026 and 93.8 percent at the end of August 2026; in pounds, it rose by £178.8 billion in seventeen months. Net debt excluding the Bank of England rose more markedly, from 87.9 to 90.2 percent of GDP, reflecting the fact that the Bank’s asset holdings are falling as it carries out quantitative tightening, which transfers debt from the Bank’s balance sheet to that of the government. PSNFL, the measure targeted by the investment rule, rose from 80.2 to 82.3 percent of GDP.
| Measure | End Mar 2025 | End Mar 2026 | End Aug 2026 |
|---|---|---|---|
| Net debt (£ bn) | 2,806.7 | 2,916.8 | 2,985.5 |
| Net debt (% GDP) | 93.4 | 93.3 | 93.8 |
| Net debt ex BoE (% GDP) | 87.9 | 89.1 | 90.2 |
| PSNFL (% GDP) | 80.2 | 81.5 | 82.3 |
Table 1. Public sector debt. Source: ONS, Public sector finances, August 2026.
The fact that PSNFL is rising is significant, because the investment rule requires it to be falling by 2029-30. In March 2026, the OBR expected PSNFL to stabilise and begin to fall towards the end of the forecast period. Any deterioration in the forecast would make this rule harder to meet.
5.2 Receipts and spending
Figure 2 shows the growth of the main categories of receipts and spending in the first five months of 2026-27, compared with the same period of 2025-26.
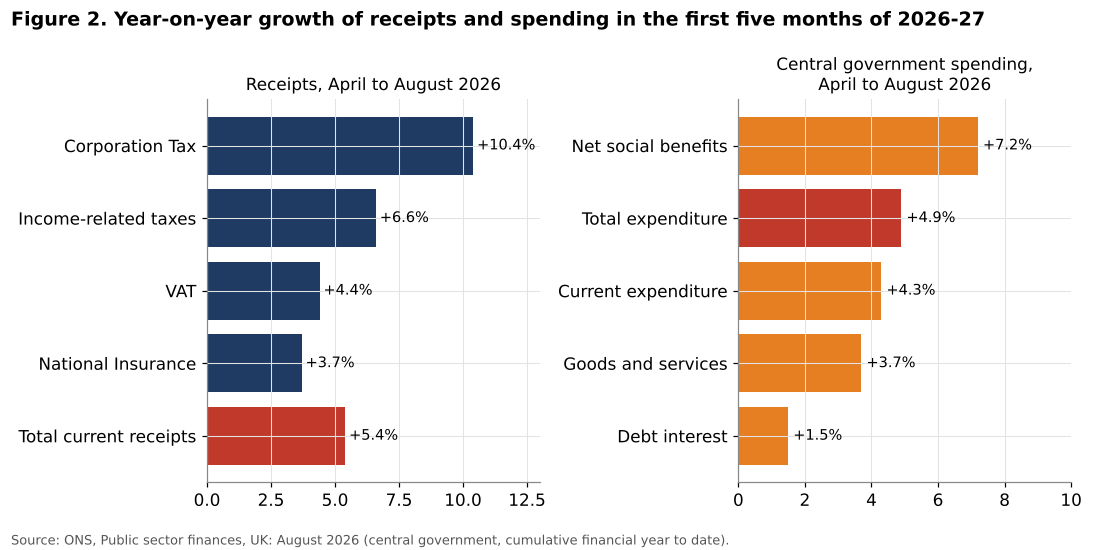
Receipts are growing strongly. Total current receipts increased by £23.6 billion, or 5.4 percent, to £460.7 billion. Corporation Tax grew by 10.4 percent, income-related taxes by 6.6 percent, VAT by 4.4 percent and National Insurance contributions by 3.7 percent. The strong growth of income tax reflects “fiscal drag”: with tax thresholds frozen while nominal wages rise, more income is taxed and a larger share is taxed at higher rates.
Spending is growing almost as fast. Total central government expenditure rose by £25.6 billion, or 4.9 percent, to £546.3 billion. The fastest growing category is net social benefits, up 7.2 percent, driven by the uprating of benefits and pensions with past inflation and by rising numbers of claimants. Spending on goods and services, which includes the pay of public sector employees and the running costs of public services, rose by 3.7 percent. Debt interest increased by only 1.5 percent over the period, to £50.0 billion, but this modest increase reflects the timing of inflation uplifts on index-linked gilts. In August alone, debt interest was £8.8 billion, the highest August figure since monthly records began in 1997.
The result is that borrowing in the first five months fell slightly, by £2.2 billion, compared with the same period of 2025-26. In other words, the public finances are not deteriorating in absolute terms: receipts are rising faster than non-interest spending, and borrowing is broadly stable.
5.3 Outturn compared with forecast
Figure 3 compares the outturn for April to August 2026 with the OBR’s March forecast.
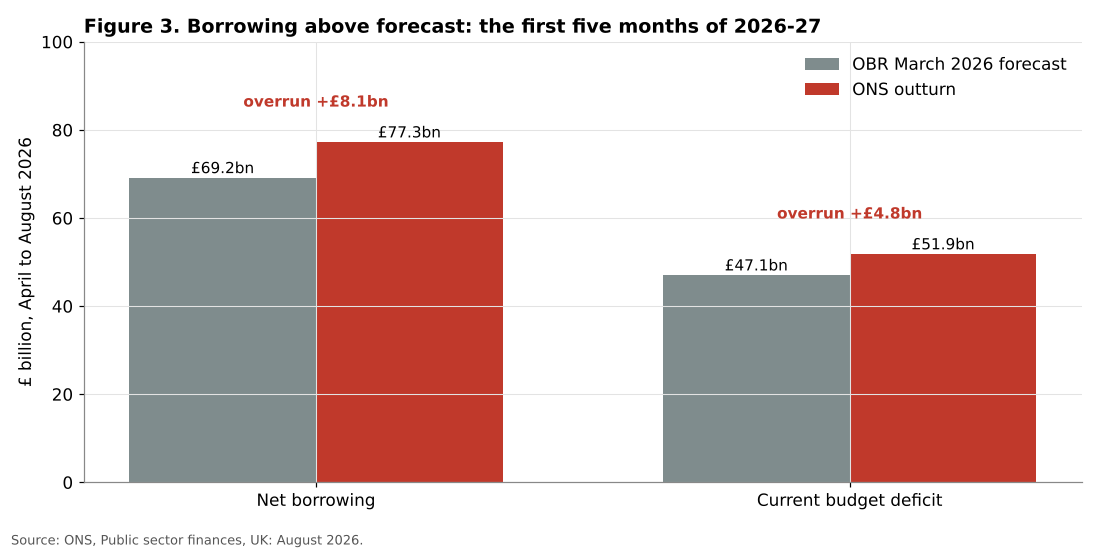
The problem is not the trend, but the comparison with the forecast. Borrowing in April to August was £77.3 billion, compared with £69.2 billion forecast by the OBR: an overrun of £8.1 billion, or about 11.7 percent. The current budget deficit was £51.9 billion, £4.8 billion higher than forecast. Central government spending was £546.3 billion, £7.3 billion above the OBR’s forecast of £539.0 billion. In August alone, borrowing of £18.3 billion was £3.5 billion higher than forecast and the second highest August figure on record, after 2020.
Using the seasonal profile of the previous year, the author estimates that full-year borrowing in 2026-27 could be about £131 billion, or about 4.0 percent of GDP. This would be slightly lower than in 2025-26, but higher than the OBR expected in March. These monthly overruns are not in themselves decisive for the fiscal rules, which apply to 2029-30, but they matter because they suggest that the starting point for the new forecast will be weaker than assumed.
5.4 The erosion of headroom
Figure 4 presents an indicative bridge between the OBR’s March 2026 headroom and estimates of current headroom reported before the Budget.
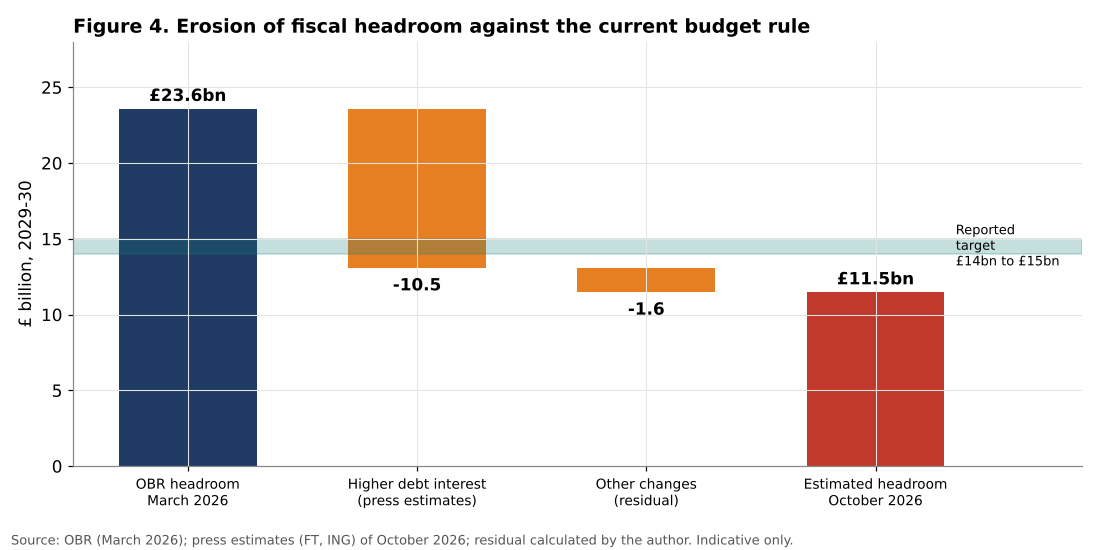
In March 2026, the OBR estimated headroom against the stability rule at about £23.6 billion in 2029-30. Since then, the main change has been the rise in interest rates. Estimates reported by the Financial Times and by analysts at ING suggest that higher market expectations for Bank Rate (about 1 percentage point higher than in March) and higher gilt yields (about 70 basis points higher at the 10-year horizon) could add about £10 to £11 billion a year to debt interest by 2029-30. Combined with other changes, reported estimates of current headroom are around £10 to £12 billion, before any new policy decisions. The Treasury is reported to want headroom of at least £14 to £15 billion after the Budget, to maintain credibility with markets.
The author’s bridge, using a central value of £10.5 billion for the debt interest effect and a residual of about £1.6 billion for other changes, gives estimated headroom of about £11.5 billion. These numbers are indicative, as the OBR’s new forecast will incorporate many other changes, including revisions to productivity, wages, migration and tax receipts. The OBR estimates that a change of 0.1 percentage points in nominal GDP growth in each forecast year moves borrowing in 2029-30 by about £6.4 billion, which shows how sensitive the headroom is to economic assumptions.
The gap between estimated headroom (about £11.5 billion) and the reported target (about £14 to £15 billion) is roughly £2.5 to £3.5 billion before any new spending. Any additional spending commitments, for example on defence, energy support or public services, would widen this gap and would need to be financed by higher taxes, lower spending elsewhere, or a reduction in the target headroom.
5.5 The weight of debt interest
Debt interest has become one of the largest items of public spending. Over the first five months of 2026-27, it amounted to £50.0 billion, equivalent to about 10.9 percent of total current receipts. Annualised, it would represent about £120 billion, or about 3.7 percent of GDP. This is more than the government spends on defence, and comparable to spending on education.
The effective interest rate on net debt, calculated as annualised interest divided by the stock of net debt, is about 4.0 percent. This is higher than in the 2010s, when the effective rate was much lower, and close to the expected growth rate of nominal GDP. Two features of UK public debt explain its sensitivity to interest rates. First, about a quarter of gilts are index-linked to the Retail Prices Index, so that interest payments rise immediately with inflation; in August 2026, £2.1 billion of the £8.8 billion of debt interest was due to the uplift on index-linked gilts. Second, the Bank of England’s quantitative easing programme has effectively replaced long-term fixed rate gilts with reserves paying Bank Rate, which shortens the effective maturity of the public sector’s liabilities.
5.6 The arithmetic of debt stabilisation
Figure 5 shows the primary balance required to stabilise net debt at 93.8 percent of GDP for different values of the gap between the effective interest rate and nominal growth (r – g).
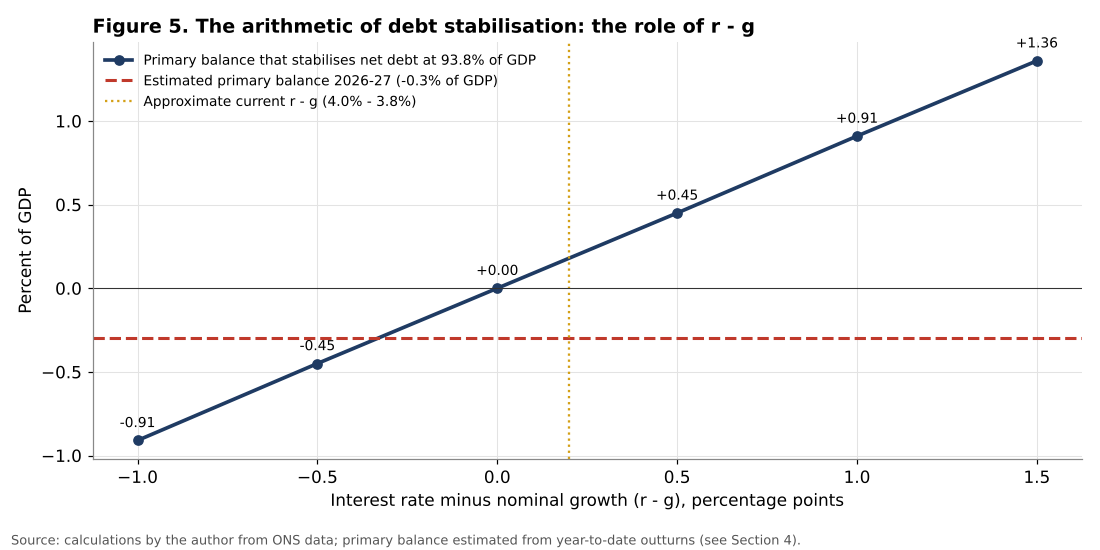
When r equals g, the debt ratio is stable with a balanced primary budget. For every percentage point by which r exceeds g, a primary surplus of about 0.9 percent of GDP is needed to keep debt stable. With an effective interest rate of about 4.0 percent and nominal growth of about 3.8 percent, the current r – g is about 0.2 points, which requires a primary surplus of about 0.2 percent of GDP.
The author’s estimate of the primary balance for 2026-27, based on projected borrowing of about £131 billion and annualised debt interest of about £120 billion, is a deficit of about 0.3 percent of GDP. The gap with the debt-stabilising primary balance is therefore about 0.5 percentage points of GDP, or about £15 to £16 billion a year. This is a manageable gap: it is of the same order of magnitude as the measures under discussion for the Budget.
However, the calculation shows the sensitivity to interest rates and growth. If r – g rose to 1.5 points, for example because of higher gilt yields and weaker nominal growth, the required primary surplus would rise to about 1.4 percent of GDP, and the adjustment needed would be about 1.7 percent of GDP, or more than £50 billion a year. Conversely, if r – g fell to -0.5 points, the current primary deficit would be sufficient to stabilise debt.
This analysis shows that the UK’s fiscal position depends less on the size of its current deficit than on the relationship between interest rates and growth. A credible fiscal strategy must therefore address both sides: limiting the risk of higher interest rates through credibility, and improving growth through investment and productivity.
5.7 Where the extra revenue comes from
The composition of receipts deserves closer attention, because it shows how the burden of fiscal adjustment is already being distributed. Of the £23.6 billion increase in current receipts in the first five months of 2026-27, income-related taxes contributed £8.1 billion, VAT £3.8 billion, Corporation Tax £4.2 billion and National Insurance contributions £3.0 billion. Together, these four taxes account for about four fifths of the increase.
Income tax receipts are rising faster than wages because personal allowances and thresholds have been frozen in cash terms for several years. Each year, as nominal earnings rise, a larger share of income falls into the taxable band and more taxpayers cross into the higher rate band. This mechanism, known as fiscal drag, raises substantial revenue without any change in tax rates. It is economically equivalent to a tax increase, but it is less visible. Its continuation is one of the main reasons why receipts are growing faster than GDP.
Corporation Tax receipts, up 10.4 percent, reflect both the increase in the main rate to 25 percent in 2023 and the strong profits of some sectors, notably banking. National Insurance receipts reflect the increase in employer contributions introduced in April 2025, whose effect is now stabilising. VAT receipts grow broadly in line with nominal consumption, which has been supported by inflation.
This composition has two implications. First, a large part of the recent fiscal adjustment has already been carried out on the revenue side, through measures that are less visible than changes in headline rates. Second, the growth of receipts depends on nominal wages and profits, which in turn depend on inflation. If inflation falls faster than expected, receipts would slow, while some spending items, such as benefits uprated with past inflation, would continue to rise. The public finances are therefore exposed to the path of inflation in both directions.
6. Discussion
6.1 The financing options
The Budget will need to finance a set of priorities within the margin available. The reported estimates of spending pressures and revenue options give a sense of the orders of magnitude involved:
| Item | Annual amount (£ bn, approx.) | Source of estimate |
|---|---|---|
| Debt interest increase by 2029-30 | 10 to 11 | FT, ING |
| Real-terms flat departmental plans | about 12 | ING |
| Defence at 3% of GDP by 2030 | about 10 | IFS |
| Increase in bank surcharge from 3% to 8% | about 2 | ING |
| National Insurance on landlords and partnerships | about 2 | ING |
| Basic rate rise with 2 point cut in National Insurance | about 6 | ING |
Table 2. Indicative pressures and options. Source: press and analyst estimates reported in October 2026; not official costings.
These figures illustrate the core difficulty. The spending pressures, taken together, amount to several tens of billions of pounds a year, while the revenue options that are consistent with the manifesto commitments raise a few billion each. Closing the gap would require either a large number of smaller tax increases, a revision of the commitment not to raise the main tax rates, a slower increase in spending, or a reduction in headroom.
6.2 Taxation
The United Kingdom’s tax burden is already historically high, after the increases of the past several years. Raising it further has economic costs, through effects on incentives to work and invest, and political costs. The options most frequently discussed include higher taxes on banks, changes to capital gains tax, higher taxes on high-value property, and broadening the base of National Insurance contributions. Each raises relatively small amounts. Changes to the main rates of income tax would raise much more, but would conflict with the manifesto commitment.
An alternative that has been discussed is a combination of an increase in the basic rate of income tax with an equivalent reduction in employee National Insurance contributions. This would shift the burden from employment income towards other forms of income, such as pensions and rental income, and would raise about £6 billion a year according to analysts. It illustrates how the structure of taxes, not just the level, can be used to raise revenue.
6.3 Public services and welfare
The fastest growing component of spending is social benefits, up 7.2 percent in the first five months of 2026-27. This reflects the uprating of pensions and benefits, and the rise in the number of people claiming disability and incapacity benefits. Reviews of the welfare system are due to report after the Budget. Changes to welfare spending are politically difficult, as illustrated by previous attempts at reform, but they represent one of the few areas where significant savings could be made.
Public services, especially the NHS, face continuing pressure from demographic change and from the cost of recovering from the pandemic. Holding departmental spending flat in real terms would require about £12 billion a year more than in the March plans, according to analysts, because of higher inflation.
6.4 Investment
The fiscal rules protect investment by allowing it to be financed by borrowing. Net investment by the public sector was £86.9 billion in 2025-26, up from £76.6 billion in 2024-25, and rose by 17.5 percent in August 2026 compared with a year earlier. Maintaining public investment is important for long-term growth, especially in a country with a long record of low investment. But the investment rule, which requires PSNFL to fall, also limits how much investment can be financed by borrowing. The trade-off between protecting investment and meeting the rules will be a key test of the Budget.
6.5 Credibility
The experience of September 2022 showed that markets can react sharply to fiscal announcements perceived as unfunded. The current government has made fiscal credibility a central part of its strategy, which explains the importance attached to headroom. But maintaining headroom through frequent small adjustments, made at each fiscal event in response to forecast changes, has its own costs: it creates uncertainty for households and businesses and encourages short-term measures. Several commentators have suggested that the fiscal framework could be reformed to reduce this sensitivity, for example by assessing the rules only once a year or by allowing a wider margin of tolerance. Any such reform would itself need to be credible.
6.6 The link with growth
The analysis of debt dynamics shows that growth is the most powerful long-term determinant of debt sustainability. Each 0.1 point of additional nominal growth reduces borrowing in 2029-30 by about £6.4 billion according to the OBR. Measures that raise productivity, such as public investment, planning reform, skills and support for innovation, are therefore fiscal measures as well as growth measures. The next two articles in this series examine two sectors that will determine growth: services, which account for the bulk of the economy, and construction, which is central to the government’s housing and infrastructure ambitions.
6.7 An international perspective
The United Kingdom is not unique in facing high debt and rising interest costs. Most advanced economies emerged from the pandemic with debt ratios higher than before, and many face similar pressures from defence, ageing populations and the energy transition. According to IMF data cited by official sources, the average general government debt ratio of the G7 economies is well above 100 percent of GDP, higher than the UK figure on the general government definition.
What distinguishes the United Kingdom is less the level of its debt than three structural features: the high share of index-linked debt, which makes interest costs sensitive to inflation; the dependence on foreign investors for a significant part of gilt demand, which makes yields sensitive to global conditions; and a fiscal framework based on a single target year, which makes policy sensitive to forecast revisions. Several of these features have advantages, such as the long average maturity of conventional gilts and the depth of the domestic pension fund market. But together they mean that the United Kingdom has less room for error than some of its peers, a lesson reinforced by the experience of 2022.
7. Scenarios to 2030-31
7.1 Three paths for net debt
Figure 6 shows three illustrative scenarios for public sector net debt as a share of GDP.
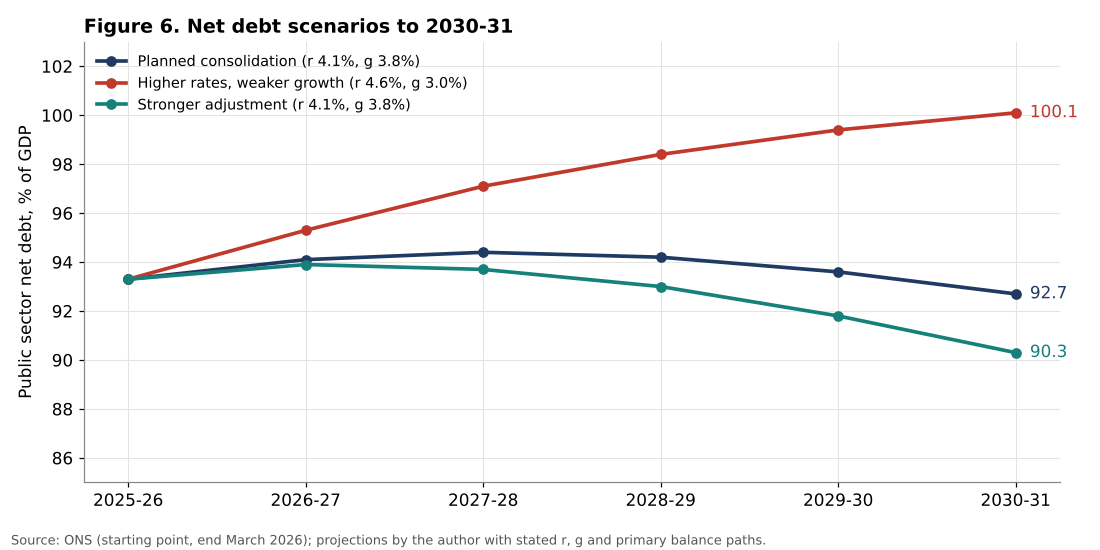
Scenario 1: Planned consolidation. The effective interest rate is 4.1 percent and nominal growth 3.8 percent. The primary balance improves gradually from a deficit of 0.5 percent of GDP in 2026-27 to a surplus of 1.2 percent in 2030-31, in line with a path that meets the stability rule. Net debt peaks at about 94.4 percent of GDP in 2027-28 and falls to about 92.7 percent by 2030-31.
Scenario 2: Higher rates, weaker growth. The effective interest rate rises to 4.6 percent and nominal growth slows to 3.0 percent, for example because of a prolonged energy shock and tighter monetary policy. The primary balance improves more slowly, reaching a surplus of only 0.8 percent of GDP by 2030-31. Net debt rises continuously, to about 100 percent of GDP by 2030-31.
Scenario 3: Stronger adjustment. With the same interest rate and growth as scenario 1, the government implements a larger and earlier fiscal consolidation, reaching a primary surplus of 1.8 percent of GDP by 2030-31. Net debt falls to about 90 percent of GDP.
7.2 Interpretation
The difference between the scenarios at the end of the period is about 10 percentage points of GDP, or about £320 billion at current prices. The comparison between scenarios 1 and 2 shows that most of the difference comes from the macroeconomic environment rather than from fiscal policy itself: a gap of 1.6 points between interest rates and growth, sustained over five years, adds about 7 points of GDP to the debt ratio even with a gradually improving primary balance.
The comparison between scenarios 1 and 3 shows the effect of fiscal policy: an additional primary surplus of about 0.6 percent of GDP a year reduces debt by about 2.4 points of GDP after five years. This is a meaningful but not dramatic effect, which illustrates why governments find it difficult to reduce debt quickly through fiscal policy alone.
7.3 Indicators to watch
The author suggests monitoring five indicators:
1. The OBR’s estimate of headroom against the stability rule in the 28 October forecast. 2. The 10-year and 30-year gilt yields, and the market path for Bank Rate. 3. Monthly borrowing compared with the new forecast, starting with the September data on 21 October. 4. The growth of income tax receipts, which reflects fiscal drag and wage growth. 5. The OBR’s assumption for productivity growth, which drives the medium-term forecast.
8. Conclusion
The United Kingdom’s public finances in 2026 are characterised by a paradox. On the one hand, the fiscal position is not deteriorating rapidly: receipts are growing faster than spending, borrowing is broadly stable, and the primary deficit is small. On the other hand, the margin available under the fiscal rules is very thin, and the debt path is highly sensitive to interest rates and growth.
The main findings of this article are:
1. Net debt was 93.8 percent of GDP at the end of August 2026, the highest level since the early 1960s; PSNFL, the measure targeted by the investment rule, was 82.3 percent and rising. 2. Borrowing in April to August 2026 was £77.3 billion, about 11.7 percent above the OBR forecast. On the seasonal profile of the previous year, full-year borrowing could be about £131 billion, or 4.0 percent of GDP. 3. Debt interest absorbed about 10.9 percent of current receipts in the first five months of the year, and the effective interest rate on net debt is about 4 percent, close to nominal growth. 4. Headroom against the stability rule appears to have fallen from about £23.6 billion in March to about £10 to £12 billion before new policy decisions, mainly because of higher debt interest. 5. The primary balance needed to stabilise debt is about 0.9 percent of GDP for each point of r – g. At current values, the gap is about 0.5 percent of GDP, but it could exceed 1.5 percent if interest rates rise further relative to growth.
The choice between taxation, public services and investment is therefore constrained not only by the level of debt, but by its cost and by the uncertainty surrounding that cost. The Budget of 28 October will need to finance new priorities with limited resources, while maintaining credibility with markets. Whatever the mix of measures chosen, the most important factor for the medium-term health of the public finances will be the ability to raise growth and to keep the cost of borrowing under control.
Need this analysis for your organisation?
We prepare confidential briefings, executive talks and studies on countries, markets and policies, built on the same method as this article.
Request a briefingSupport independent analysis
Our studies are free to read and carry no advertising. If this one was useful, a small contribution helps us publish the next.
Support our workGo further: books by Global Strategy Files


Frequently asked questions
How large is UK public debt in 2026?
UK public sector net debt is close to 94 percent of GDP ahead of the Autumn Budget of 28 October 2026, a level last seen in the early 1960s, and central government debt interest reached 50.0 billion pounds in the first five months of 2026-27.
Is UK government borrowing above forecast?
Yes. Public sector net borrowing reached 77.3 billion pounds in the first five months of the 2026-27 financial year, 8.1 billion pounds or about 12 percent more than the Office for Budget Responsibility forecast in March 2026.
What is the main risk for UK public finances?
The main risk is sensitivity rather than runaway deficits. Receipts are growing faster than spending and the primary deficit is small, but with the effective interest rate close to nominal growth, small changes in market rates or growth move debt by several points of GDP.
What is at stake in the UK Autumn Budget 2026?
The central question is the credibility of a medium-term fiscal path, not any single tax or spending measure. Higher interest costs, equal to about 11 percent of current receipts, absorb most of the headroom available under the fiscal rules.
Methodological note
All calculations in this article were carried out by the author using the ONS statistical bulletin “Public sector finances, UK: August 2026” (22 September 2026) and its tables. The implied nominal GDP is calculated from net debt in pounds and as a percentage of GDP. Full-year borrowing for 2026-27 is projected using the share of April to August in full-year borrowing in 2025-26 (59.2 percent). Debt interest is annualised from the year-to-date figure. The debt-stabilising primary balance uses the standard debt dynamics equation. The headroom bridge uses the OBR March 2026 figure and press estimates of the effect of higher interest rates, reported by the Financial Times and ING in October 2026; it is indicative. The debt scenarios are illustrative and do not constitute forecasts. All 2025-26 and 2026-27 data are provisional.
References
Blanchard, O. (2019). Public Debt and Low Interest Rates. American Economic Review, 109(4), 1197 to 1229.
Bohn, H. (1998). The Behavior of U.S. Public Debt and Deficits. Quarterly Journal of Economics, 113(3), 949 to 963.
Herndon, T., Ash, M. and Pollin, R. (2014). Does High Public Debt Consistently Stifle Economic Growth? A Critique of Reinhart and Rogoff. Cambridge Journal of Economics, 38(2), 257 to 279.
House of Commons Library (2026). Public finances: Economic indicators. Research Briefing SN02812. London.
Office for Budget Responsibility (2025). Fiscal risks and sustainability, July 2025. London.
Office for Budget Responsibility (2026). Economic and fiscal outlook, March 2026. London.
Office for National Statistics (2026). Public sector finances, UK: August 2026. Statistical bulletin, 22 September 2026. Newport.
Portes, J. and Wren-Lewis, S. (2015). Issues in the Design of Fiscal Policy Rules. The Manchester School, 83(S3), 56 to 86.
Reinhart, C. M. and Rogoff, K. S. (2010). Growth in a Time of Debt. American Economic Review, 100(2), 573 to 578.
