
The Missing First Rung: Young Graduates, AI and the Erosion of the Degree’s Protection

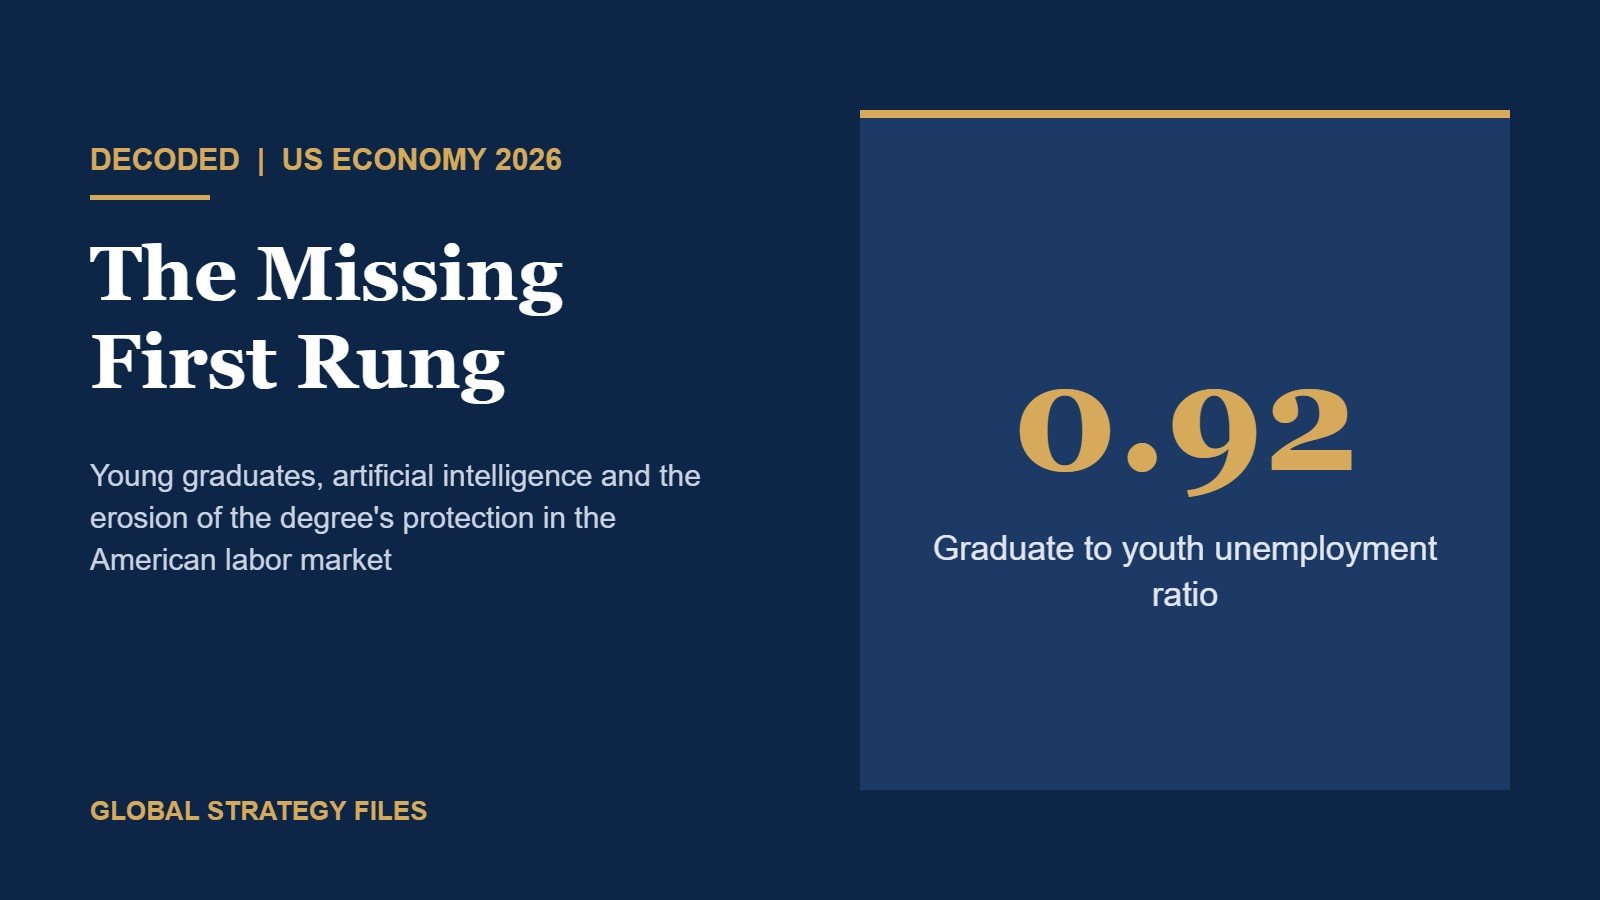
Driss EFFINA, PhD Independent Researcher, Global Strategy Files. Decoded, 11 November 2026. Reading time: about 9 minutes.
Key takeaways
- The unemployment rate of bachelor’s degree holders aged 20 to 24 averaged 6.65% in 2026, against 5.1% in 2019, while the rate for all 20 to 24 year olds rose only from 6.7% to 7.2%.
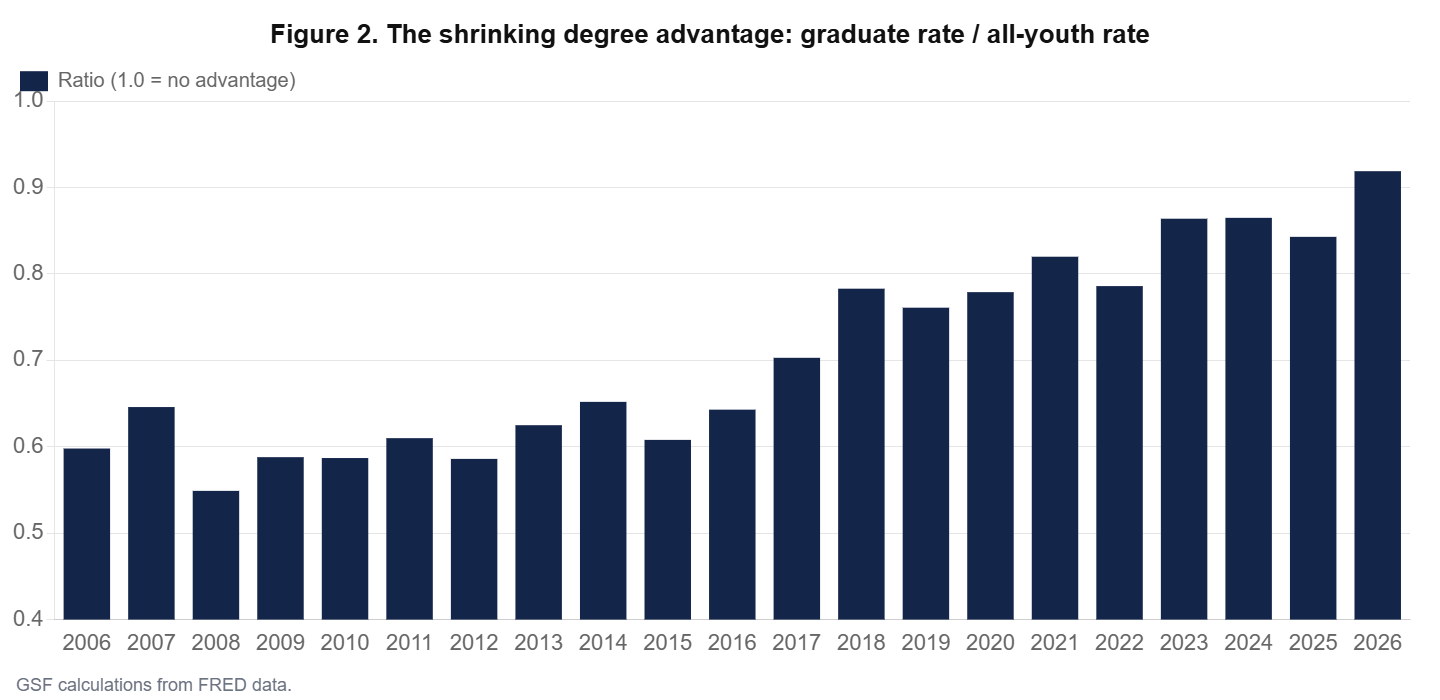
- The degree’s protection is eroding. A young graduate’s unemployment rate was about 60% of the youth average from 2006 to 2016; it reached 92% in 2026, the highest ratio in our twenty-year series.
- Using the 2006 to 2019 relationship between graduate and youth unemployment, the 2026 rate should be about 5.0%. The actual rate is 1.7 points higher. This unexplained gap has widened every year since 2022.
- Graduate-intensive sectors have stalled: since 2022, employment in information is down 9.5%, professional and business services flat, finance and real estate up 0.6%, while education and health grew 14.6%.
- The hiring rate fell to about 3.3% in 2025 and 2026, the lowest since 2012 to 2013. A low-hiring economy penalises entrants above all.
- Artificial intelligence can explain at most part of the 1.7-point gap. Recent studies find no statistically significant AI effect on unemployment of recent graduates in summer 2026, but they do find reduced entry-level hiring in exposed occupations.
A diploma that protects less
For most of the past half century, a college degree has been the most reliable insurance against unemployment in the United States. In recessions and recoveries alike, young graduates found work faster than their peers without degrees. That regularity is weakening. In 2026, recent graduates face one of the most difficult entry-level markets in more than a decade, and the debate has focused on a single culprit: artificial intelligence, which is said to be removing the first rung of the white-collar career ladder.
This article measures the erosion with official data and attempts to separate three explanations: the general cooling of the youth labor market, the stagnation of the sectors that hire graduates, and a residual that could reflect AI. Our estimates rely on the Current Population Survey and the establishment survey of the Bureau of Labor Statistics, available on FRED.
The facts
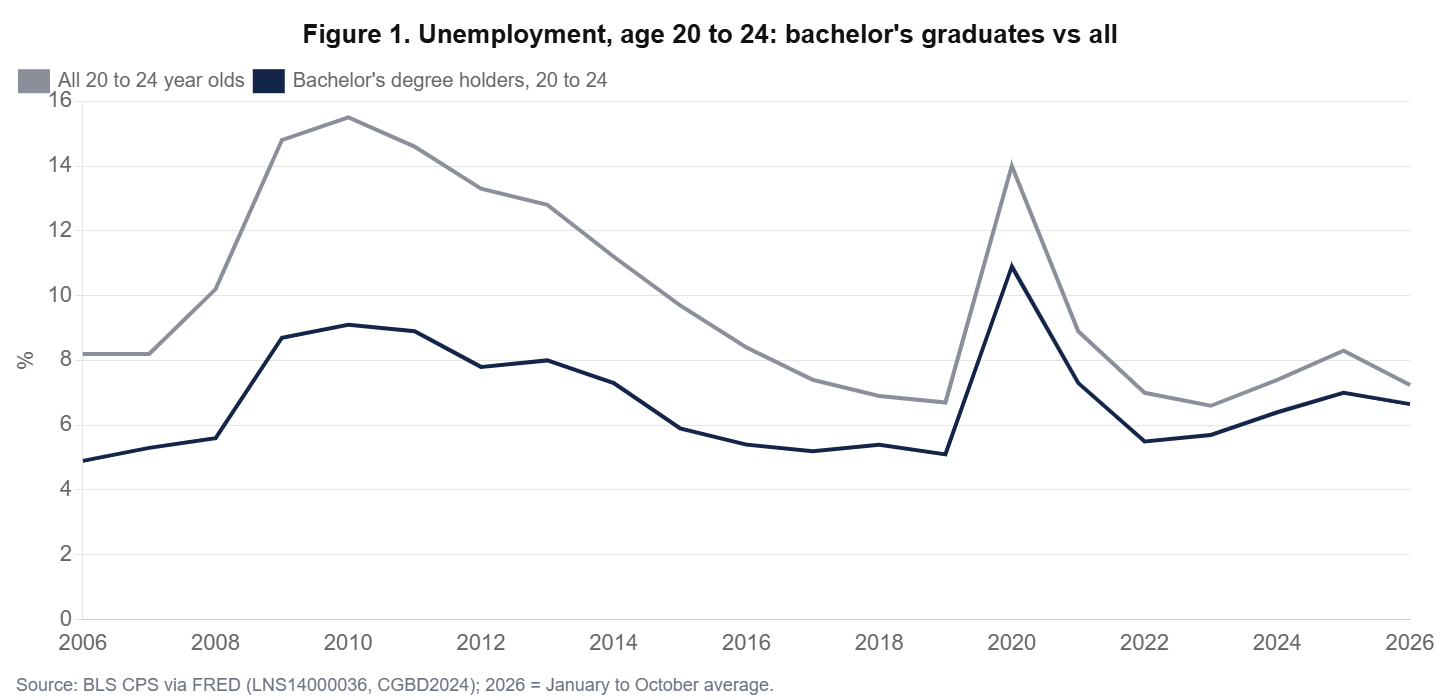
Figure 1 compares the unemployment rate of bachelor’s degree holders aged 20 to 24 with the rate for all 20 to 24 year olds. Graduates have always done better, but the gap has narrowed. In 2010, at the bottom of the Great Recession, graduates had an unemployment rate of 9.1% against 15.5% for all young people. In 2019, the figures were 5.1% and 6.7%. In 2026, they are 6.65% and 7.24%. The New York Fed, which uses a broader definition of recent graduates aged 22 to 27, reports an unemployment rate of 5.6% to 5.7% and an underemployment rate of 41.5%, meaning that four in ten work in jobs that do not require a degree.
The clearest way to see the change is the ratio of the two rates (Figure 2). Between 2006 and 2016, a young graduate’s unemployment rate was about 0.55 to 0.65 times the youth average. The ratio rose to about 0.78 in 2018 to 2022, to 0.86 in 2023 and 2024, and to 0.92 in 2026. On this measure, the degree’s protective effect against unemployment at the start of a career has largely disappeared.
How much is the cycle?
Part of the rise in graduate unemployment simply reflects a cooler youth labor market. To separate this cyclical component, we estimate the historical relationship between the two rates over 2006 to 2019, a period that contains a deep recession and a long expansion. The estimated equation is: graduate rate = 1.39 + 0.49 x youth rate. Graduates’ unemployment moves about half as much as the youth rate.
Applied to 2026, the equation predicts a graduate unemployment rate of 4.97%. The actual average is 6.65%. The unexplained gap, 1.68 points, is the largest outside the pandemic year 2020, and it has grown every year since 2022: 0.65 points in 2022, 1.05 in 2023, 1.35 in 2024, 1.51 in 2025 (Figure 4). Something has changed in the way the labor market treats young graduates, beyond the cycle.
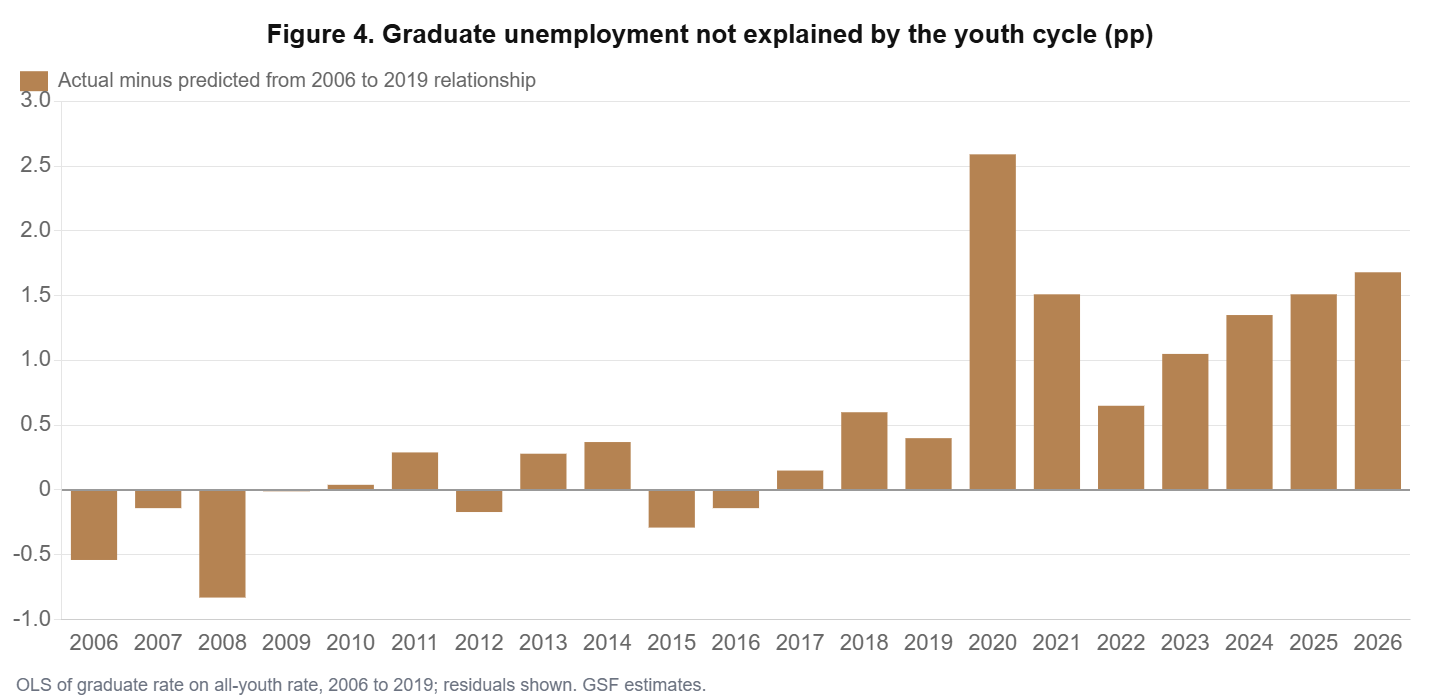
Table 1. Decomposing the change in graduate unemployment, 2019 to 2026 (percentage points)
| Component | Contribution | Interpretation |
|---|---|---|
| Change in graduate rate, 2019 to 2026 | +1.55 | From 5.10% to 6.65% |
| Cyclical: change in youth rate times 0.49 | +0.27 | Youth rate from 6.7% to 7.24% |
| Shift in the residual (2026 minus 2019) | +1.28 | Structural deterioration specific to graduates |
Table 1 shows that the cycle explains only about a sixth of the deterioration since 2019. The rest, about 1.3 points, is specific to graduates.
The sectors that stopped hiring
Where do graduates traditionally find their first jobs? Disproportionately in information, finance, and professional and business services, which include consulting, accounting, law, engineering and computer services. Figure 3 compares employment in these sectors with education and health, which hire many graduates but also many workers without degrees. The contrast is striking. Since 2022, employment in information is down 9.5%, professional and business services are flat (minus 0.4%), and finance and real estate are up only 0.6%. Education and health grew 14.6%.
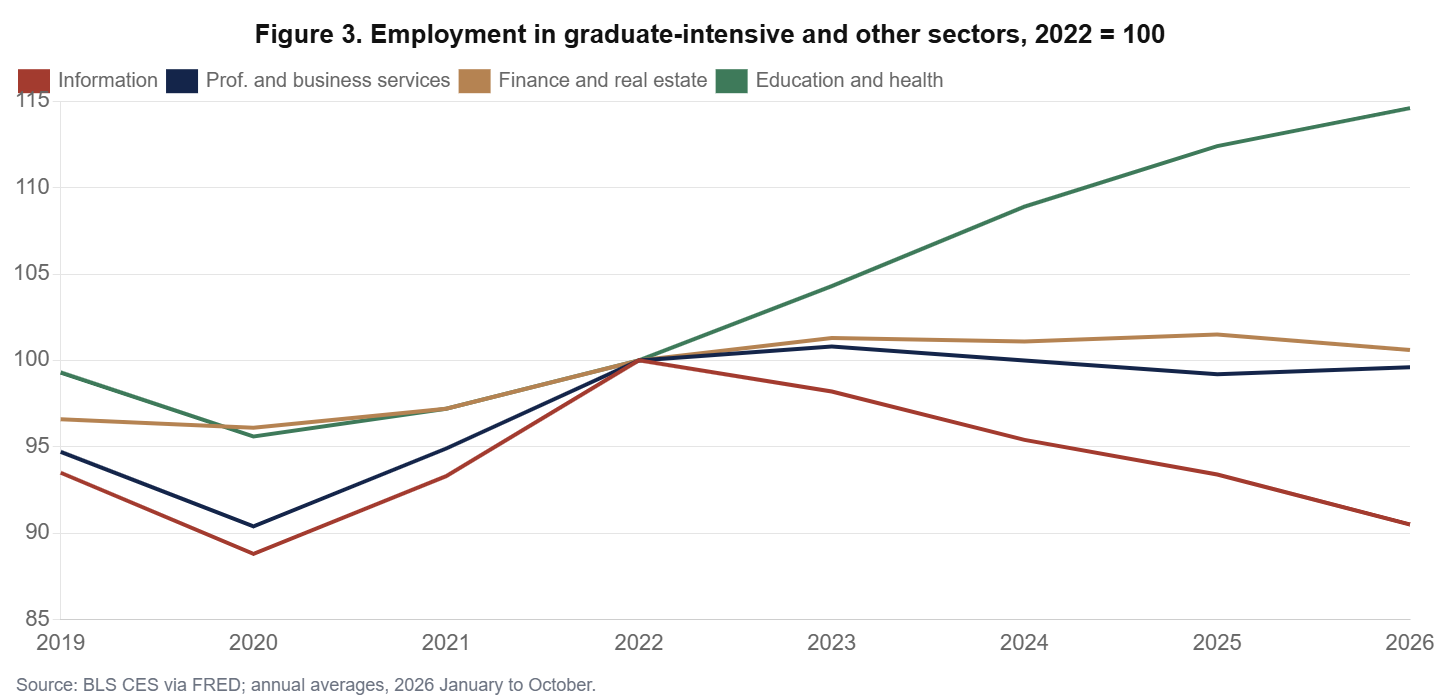
Analysis cited by the Kelly Services briefing shows the same pattern from another angle: between 2023 and 2025, industries employing the largest shares of graduates shed an average of 9,000 jobs a month, against gains of 44,000 a month before the pandemic. Meanwhile, the economy’s overall hiring rate fell to 3.3% to 3.4%, the lowest since 2012 to 2013. In a low-hiring, low-firing economy, insiders keep their jobs and outsiders, above all new entrants, wait longer at the door.
And artificial intelligence?
Artificial intelligence is the explanation most often offered, and it is plausible: many entry-level tasks, such as summarising documents, drafting, basic coding and data processing, are exactly what generative models do well. Surveys report that a fifth of firms have frozen some entry-level hiring because of AI. Unemployment among recent computer science and computer engineering graduates, at about 7% to 8%, is now among the highest of all majors.
The evidence is nonetheless mixed. A September 2026 study by Robert Fairlie and Jane Wu, using CPS microdata for June to August 2026, finds no statistically significant increase in recent graduate unemployment attributable to AI exposure. A CESifo paper finds that the summer 2026 rate of 7.3% was within the range of the previous four years. A Dallas Fed study, by contrast, finds that AI reduces entry-level hiring while raising wages for experienced workers in the same exposed occupations, and research from the London School of Economics suggests that remote work is an even better predictor of the decline in entry-level hiring.
Our reading reconciles these results. AI and remote work reduce the demand for junior staff in specific occupations, which shows up in hiring and postings before it shows up in unemployment, because graduates move to other jobs, often ones that do not require their degree. That is consistent with an underemployment rate above 40% and with the steady widening of our residual. AI is therefore best seen as one force behind the 1.3-point structural shift, alongside the stagnation of graduate-intensive sectors and the rapid growth in the number of graduates competing for fewer junior roles. On current evidence it cannot be the whole story, and it would be a mistake to treat it as the only one.
Table 2. Three explanations and what the data say
| Explanation | Evidence for | Evidence against | GSF assessment |
|---|---|---|---|
| Youth labor market cycle | Youth rate up from 6.7% to 7.2% | Explains only 0.3 of 1.55 points | Minor |
| Stagnant graduate-intensive sectors | Information -9.5%, PBS flat since 2022 | Health hiring strong | Major |
| Artificial intelligence | Lower entry hiring in exposed jobs; CS majors | No significant unemployment effect yet | Real but partial |
| Supply of graduates | More graduates per junior post | Slow-moving | Contributing |
Which degrees, which places
The deterioration is not uniform. Data compiled from the New York Fed for 2026 show that some majors fare much worse than others: anthropology graduates had the highest unemployment rate of recent graduates, at 7.9%, followed by computer engineering at 7.8% and computer science at 7.0%. The presence of the two computing majors near the top is new: a decade ago they were among the safest choices. Underemployment varies even more: about two thirds of recent graduates in criminal justice and performing arts work in jobs that do not require a degree. Nursing, engineering fields outside computing and education remain among the most protected, consistent with the strength of health and education employment.
Geography adds another layer. Entry-level openings are concentrated in a few large metropolitan labor markets, where competition has intensified. New York City illustrates the trend: the number of available entry-level jobs fell by 37% between 2022 and 2024, a loss of nearly 30,000 positions, while the number of recent graduates working in the city rose from about 490,000 to 565,000 in a year. More graduates are competing for fewer junior posts in the places where graduate careers have traditionally started.
Table 3. Labor market indicators for young graduates, 2019 and 2026
| Indicator | 2019 | 2026 | Change |
|---|---|---|---|
| Unemployment, bachelor’s degree, age 20 to 24 (%) | 5.1 | 6.65 | +1.55 |
| Unemployment, all 20 to 24 (%) | 6.7 | 7.24 | +0.54 |
| Ratio graduates / all youth | 0.76 | 0.92 | +0.16 |
| Unemployment, bachelor’s degree, age 25 to 34 (%) | 2.3 | 3.5 | +1.2 |
| Unemployment, bachelor’s or more, 25 and over (%) | 2.1 | 2.75 | +0.65 |
| JOLTS hires rate, all industries (%) | 3.9 | 3.3 | -0.6 |
The table also shows that the deterioration extends beyond the very first years: unemployment among graduates aged 25 to 34 rose from 2.3% to 3.5%. The squeeze on junior roles is not only a problem of the first job; it slows progression in the early years of a career as well.
Scenarios for the class of 2027
Three forces will shape the prospects of the next cohort. If the hiring rate recovers toward 3.8%, its 2023 level, and professional and business services keep adding jobs as in October 2026, the cyclical component would improve and graduate unemployment could fall back toward 6%. If hiring stays near 3.3% and AI adoption accelerates in exposed occupations, the structural residual could widen further, pushing the rate toward 7.5%. A recession would raise all rates, but historically graduates have suffered less than others in downturns, so the ratio of graduate to youth unemployment could paradoxically fall even as conditions worsen.
Table 4. Indicative scenarios for bachelor’s graduates aged 20 to 24 in 2027
| Scenario | Youth unemployment | Structural residual | Graduate unemployment |
|---|---|---|---|
| Hiring recovery | 6.8% | 1.4 | about 6.1% |
| Low hiring, faster AI adoption | 7.3% | 2.1 | about 7.1% |
| Recession | 9.5% | 1.7 | about 7.8% |
Why it matters for the economy
The erosion of the first rung has consequences beyond the young people concerned. Graduates who start in jobs below their qualifications earn less for years, a scarring effect documented after the 2008 crisis. Their ability to repay student loans, now in repayment again and with high delinquency rates, depends on their early earnings. Household formation and home buying are delayed. And a labor market that trains fewer juniors today will have fewer experienced professionals tomorrow, which could slow the productivity gains that AI is supposed to deliver.
For employers, the challenge is to redesign entry-level roles around the new tools rather than eliminate them. For universities, it is to prepare graduates for the tasks that complement AI. For policymakers, the most effective lever may be the most traditional one: a labor market in which hiring picks up again. The October 2026 jobs report, with 165,000 new jobs and professional and business services adding 70,000, offers a first hint that the door may be opening slightly.
The low-hiring economy
The most important background condition for young graduates is the slow pace of hiring across the whole economy. The JOLTS hires rate, the number of hires as a share of employment, fell from 4.3% in 2020 and 2021 to 3.3% to 3.4% in 2024 to 2026, its lowest level since 2012 to 2013 (Figure 5). Layoffs have remained historically low as well. The result is a labor market in which those who have jobs keep them, and those looking for a first job face long searches.
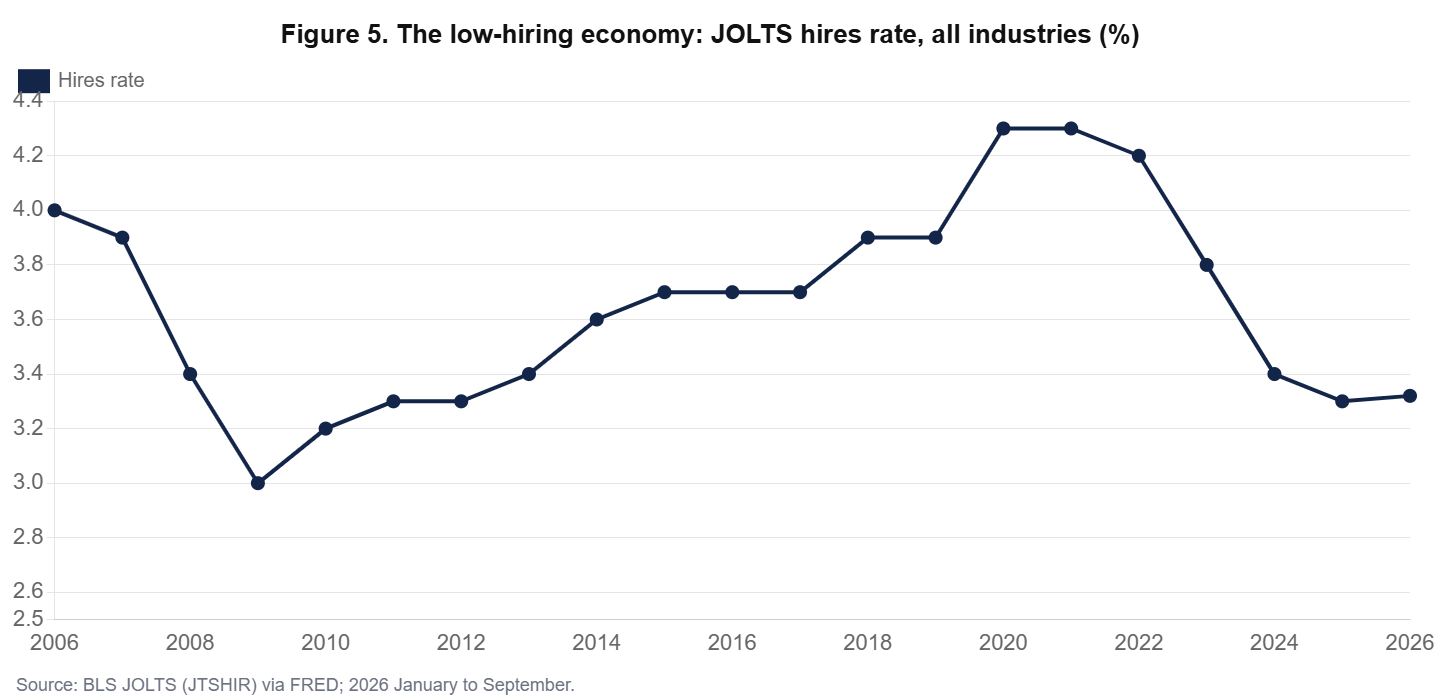
Several forces explain the low-hiring equilibrium. After the hiring spree of 2021 and 2022, many firms found themselves overstaffed, especially in technology and finance, and have since hired cautiously. Uncertainty about tariffs, interest rates and the effect of AI on future staffing needs encourages firms to delay hiring decisions. And lower immigration and an ageing workforce have reduced the number of job changes that create openings in a chain. New entrants are the group most exposed to this kind of market, because they cannot rely on a network or a track record to find the few openings available.
The October 2026 jobs report offered a hint of change, with 165,000 jobs created and upward revisions to previous months. Professional and business services added 70,000 jobs, the sector most associated with graduate hiring. If that pace continues, the cyclical part of graduates’ difficulties would ease. The structural part, linked to the reorganisation of junior work, would remain.
Conclusion
The American college degree still protects, but much less than it used to. Young graduates’ unemployment is now 92% of the youth average, against about 60% a decade ago, and 1.7 points above what the historical cycle would predict. The main driver is the stagnation of the sectors that hire graduates, in a low-hiring economy; artificial intelligence plays a real but partial role, more visible in hiring than in unemployment so far. The missing first rung is a structural problem that will not fix itself with the next upturn.
Robustness and limits
Our cyclical model rests on fourteen annual observations, and its parameters are imprecise. We checked the result in two ways. Estimating the relationship over 2010 to 2019 only, which excludes the onset of the Great Recession, gives a slightly flatter slope of 0.47 and a predicted 2026 graduate rate of 5.19%, leaving an unexplained gap of 1.46 points instead of 1.68. Using instead the average ratio of graduate to youth unemployment over 2006 to 2016, about 0.61, predicts a 2026 graduate rate of 4.40% and a gap of 2.25 points. The structural deterioration therefore lies between about 1.5 and 2.2 points, depending on the benchmark; it is large under every specification.
The CPS sample of bachelor’s graduates aged 20 to 24 is small, so annual rates move by several tenths of a point for purely statistical reasons. The 2026 figure is a ten-month average, and the definition differs from the New York Fed’s series on recent graduates aged 22 to 27. Finally, rising underemployment means that unemployment understates the deterioration: a graduate working as a barista is employed in these statistics.
Table A1. Data appendix: graduate and youth unemployment and the cyclical model
| Year | Graduates 20 to 24 (%) | All 20 to 24 (%) | Ratio | Predicted (%) | Residual (pp) |
|---|---|---|---|---|---|
| 2006 | 4.90 | 8.20 | 0.60 | 5.44 | -0.54 |
| 2008 | 5.60 | 10.20 | 0.55 | 6.43 | -0.83 |
| 2010 | 9.10 | 15.50 | 0.59 | 9.06 | +0.04 |
| 2012 | 7.80 | 13.30 | 0.59 | 7.97 | -0.17 |
| 2014 | 7.30 | 11.20 | 0.65 | 6.93 | +0.37 |
| 2016 | 5.40 | 8.40 | 0.64 | 5.54 | -0.14 |
| 2018 | 5.40 | 6.90 | 0.78 | 4.80 | +0.60 |
| 2019 | 5.10 | 6.70 | 0.76 | 4.70 | +0.40 |
| 2020 | 10.90 | 14.00 | 0.78 | 8.31 | +2.59 |
| 2021 | 7.30 | 8.90 | 0.82 | 5.79 | +1.51 |
| 2022 | 5.50 | 7.00 | 0.79 | 4.85 | +0.65 |
| 2023 | 5.70 | 6.60 | 0.86 | 4.65 | +1.05 |
| 2024 | 6.40 | 7.40 | 0.86 | 5.05 | +1.35 |
| 2025 | 7.00 | 8.30 | 0.84 | 5.49 | +1.51 |
| 2026 (Jan to Oct) | 6.65 | 7.24 | 0.92 | 4.97 | +1.68 |
Methodological note
Data: BLS CPS unemployment rates for bachelor’s degree holders aged 20 to 24 (CGBD2024) and all persons aged 20 to 24 (LNS14000036); CES employment by sector (USINFO, USPBS, USFIRE, USEHS); JOLTS hires rate (JTSHIR); all via FRED, annual averages, 2026 January to October. The cyclical model is an OLS regression of the graduate rate on the youth rate over 2006 to 2019 (14 observations); its residuals are reported for all years. Small-sample uncertainty is substantial; results should be read as indicative.
GO DEEPER
Artificial Intelligence and Durable American Growth
Can the AI investment boom turn into lasting productivity and jobs? A 300-page research book with data, models and scenarios by Dr. Driss Effina.
$30
Sources
- Federal Reserve Bank of New York, The Labor Market for Recent College Graduates; Fairlie and Wu, The Early Impacts of AI on Employment among Recent College Graduates, IZA DP 18945, September 2026; CESifo working paper as reported by TechSpot, 2026; Federal Reserve Bank of Dallas, February 2026; Kelly Services, Need to Know briefing, April 2026; ABC News, May 2026; BLS Employment Situation, October 2026.
- Driss EFFINA, PhD | Independent Researcher, Global Strategy Files | globalstrategyfiles.com
Driss EFFINA, PhD
The opening pages of our four country reports: United States, United Kingdom, Japan and China. A free PDF, sent to your inbox.
You will also receive occasional analysis from Global Strategy Files. Unsubscribe in one click, at any time.