
The Refund Economy: Did No Tax on Tips and Overtime Change How Americans Work and Spend?

Driss EFFINA, PhD Independent Researcher, Global Strategy Files. Decoded, 11 November 2026. Reading time: about 8 minutes.
Key takeaways
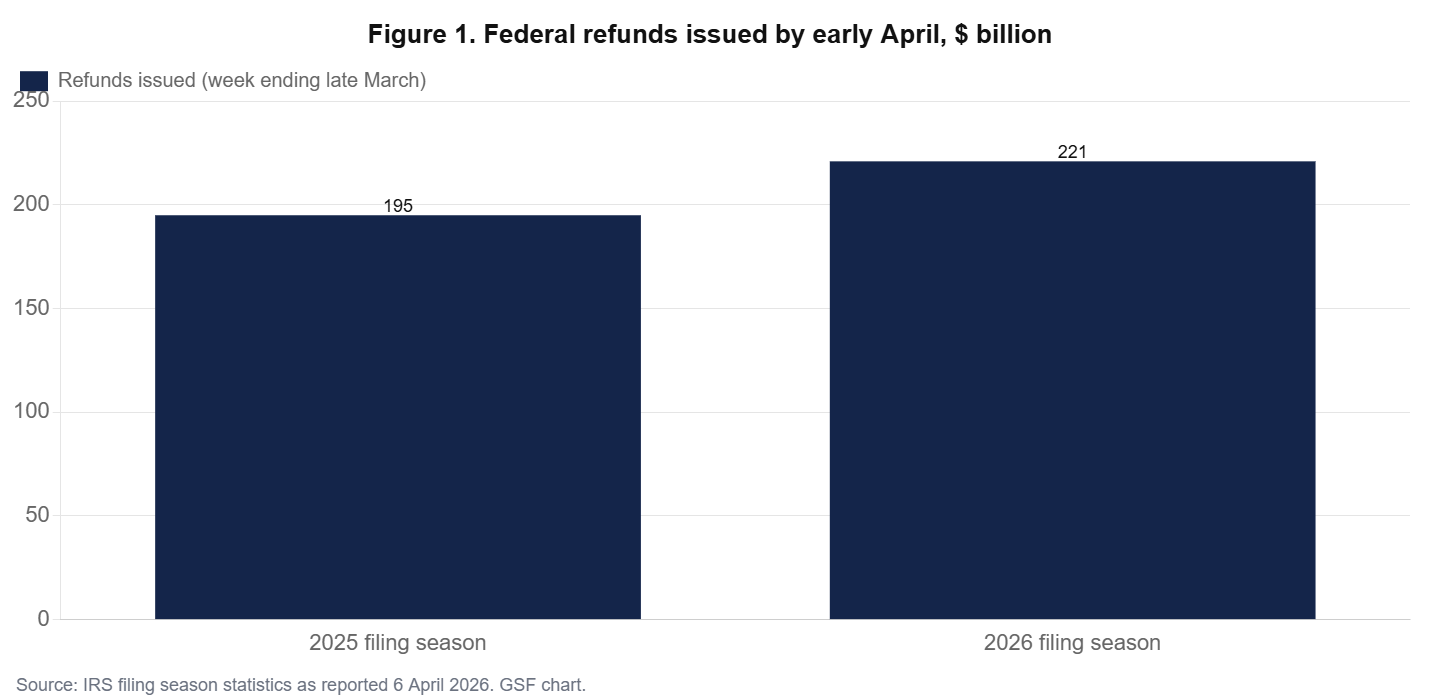
- By early April 2026 the IRS had issued $221 billion of refunds, against $195 billion a year earlier (+13%). The average refund was about 11% larger.
- 53 million filers claimed at least one of the four new deductions. Using Treasury’s counts and averages, these deductions total about $347 billion of deducted income, worth roughly $41 to $77 billion in tax, in line with Treasury’s average tax cut of $800 per beneficiary (about $42 billion).
- The senior deduction is the largest by far ($225 billion deducted), followed by overtime ($78 billion), tips ($43 billion) and car loan interest ($2 billion).
- Manufacturing overtime rose from 3.7 to 4.1 hours a week between early 2025 and late 2026. Our model shows that half to three quarters of that rise is explained by the longer workweek of the industrial upturn; at most 0.1 to 0.2 hour a week could reflect the new tax incentive.
- Spending did respond. The personal saving rate fell from 5.6% in January to 4.4% in April to June and 3.8% in September, as households spent refunds while real incomes were squeezed by the energy shock.
A filing season unlike any other
The One Big Beautiful Bill Act, signed in July 2025, applied retroactively to the whole of tax year 2025. Its main provisions for households, a larger standard deduction and child tax credit, and four new deductions for tips, overtime, seniors and interest on loans for US-assembled cars, were therefore not reflected in most paychecks in 2025. They arrived in a single block in the spring of 2026, in the form of larger refunds. The administration had promised average refunds more than $1,000 higher. The actual increase was smaller but substantial.
This article asks three questions. How large was the refund wave, and who received it? Did the new deductions change behaviour, as their supporters argued they would, by encouraging overtime and tipped work? And did the refunds support consumer spending in a year of high energy prices? The answers matter for 2027, because the same deductions will be claimed again next spring, now that they are better understood.
The size of the wave
IRS filing season statistics show that refunds issued through the week ending 27 March 2026 totalled $221 billion, against $195 billion at the same point in 2025 (Figure 1). The average refund was $3,521, up 11.1%. At the close of the season, Treasury reported an average refund above $3,400, up 11%, and said 53 million filers had claimed at least one of the new deductions, with an average tax cut above $800 for those beneficiaries.
Treasury published the number of claimants and the average deduction for each provision (Table 1). We use these figures to estimate the total amounts deducted and the corresponding tax cut, applying marginal rates of 12% and 22%, which bracket the situation of most claimants.
Table 1. The four new deductions in the 2026 filing season
| Deduction | Claimants (millions) | Average deduction | Total deducted ($ bn) | Tax cut at 12% ($ bn) | Tax cut at 22% ($ bn) |
|---|---|---|---|---|---|
| Enhanced deduction for seniors | 30 | $7,500 | 225.0 | 27.0 | 49.5 |
| No tax on overtime | 25 | $3,100 | 77.5 | 9.3 | 17.1 |
| No tax on tips | 6 | $7,100 | 42.6 | 5.1 | 9.4 |
| Car loan interest | 1 | $1,800 | 1.8 | 0.2 | 0.4 |
| Total | 53 (unique filers) | 346.9 | 41.6 | 76.4 |
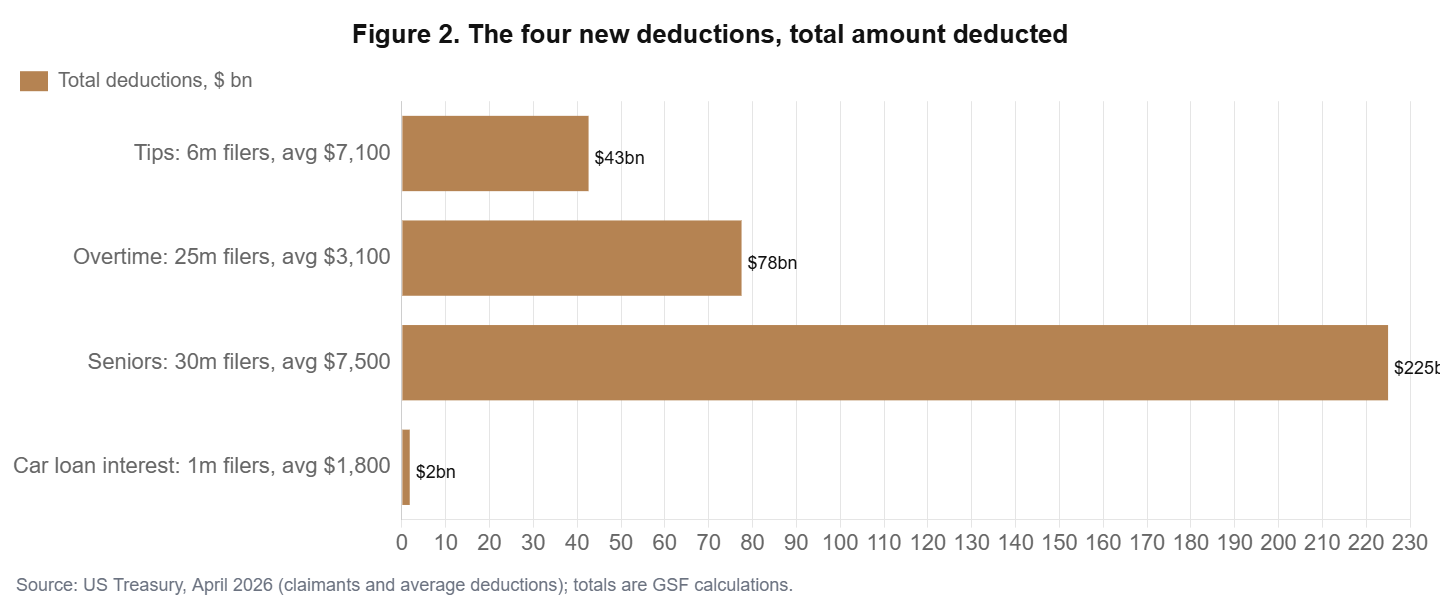
The result is instructive. The deductions that dominated the political debate, tips and overtime, account for about a third of the total. The largest provision by far is the senior deduction, claimed by 30 million people. The lower end of our range, about $42 billion, matches Treasury’s figure of 53 million beneficiaries with an average cut of $800, which suggests that most claimants are in the 10% and 12% brackets.
Did the overtime deduction make people work more?
Supporters of the overtime deduction argued that it would encourage longer hours. The deduction covers only the premium part of overtime pay, the half in time-and-a-half, up to $12,500 for a single filer, and phases out at higher incomes. Its incentive effect on hours is therefore modest in theory. What do the data show?
Average weekly overtime in manufacturing, the best monthly measure available, rose from about 3.7 hours in the first half of 2025 to 4.1 hours in the second half of 2026. That looks like a response. But overtime also moves with the business cycle, and the manufacturing workweek lengthened over the same period, from about 41.0 to 41.8 hours, as factory output and employment recovered. To separate the two, we estimate the relationship between overtime and the average workweek from January 2023 to June 2025, before the law, and use it to predict overtime afterwards (Figure 3).
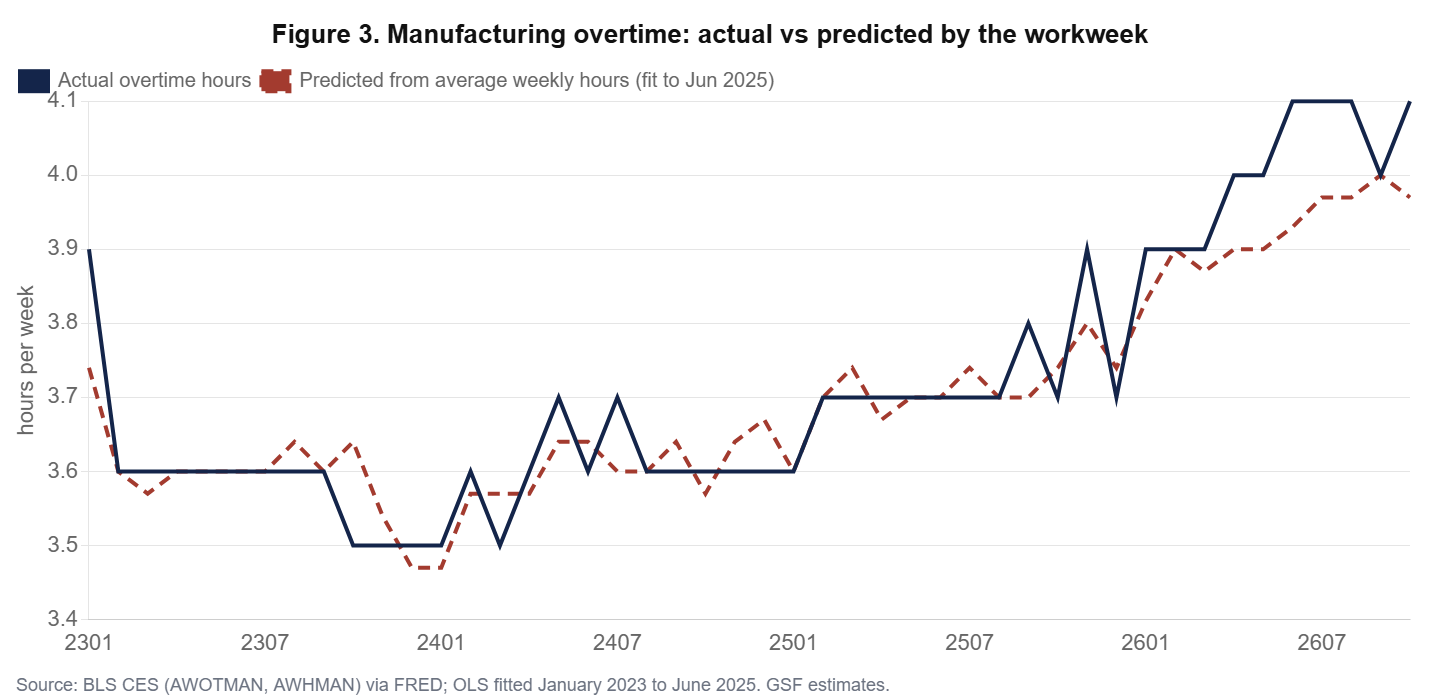
The model fits the pre-law period closely: each additional hour in the workweek comes with about a third of an hour of overtime. After July 2025, actual overtime runs slightly above the prediction. In the last six months to October 2026, the gap averages about 0.11 hour a week, against essentially zero in the six months before the law. In other words, of the 0.38-hour increase in overtime, about 0.27 hour is explained by the stronger workweek and at most 0.11 hour, roughly a quarter, could reflect the tax incentive; alternative specifications raise that share to about a half (see the robustness section). Even that upper bound is generous, since other factors, such as defence and reshoring orders, may have raised overtime independently.
Table 2. Overtime and the workweek in manufacturing (hours per week)
| Period | Average workweek | Actual overtime | Predicted overtime | Unexplained |
|---|---|---|---|---|
| January to June 2025 (before the law) | 40.95 | 3.68 | 3.69 | -0.00 |
| May to October 2026 | 41.77 | 4.07 | 3.96 | +0.11 |
| Change | +0.82 | +0.38 | +0.27 | +0.11 |
Our conclusion is that the overtime deduction functioned mainly as a transfer to people who already worked overtime, not as a labor supply incentive. The same is likely true of tips: employment in food services and drinking places grew about 0.5% between October 2025 and October 2026, slower than the 0.7% of the previous twelve months, which does not suggest a shift of workers toward tipped occupations.
Did the refunds support spending?
Refunds are cash. Research on earlier tax seasons shows that lower-income households spend a large share of their refunds within weeks. In 2026 the refunds arrived as an energy shock was squeezing real incomes, with gasoline and household energy prices sharply higher. Figure 4 shows retail sales and the personal saving rate. Nominal retail sales rose about 2.9% between January to February and March to May 2026, against about 0.9% over the same months of 2025, although part of that difference reflects higher fuel prices. The saving rate fell from 5.6% in January to 4.4% from April to June and 3.8% in September, its lowest level in our sample.
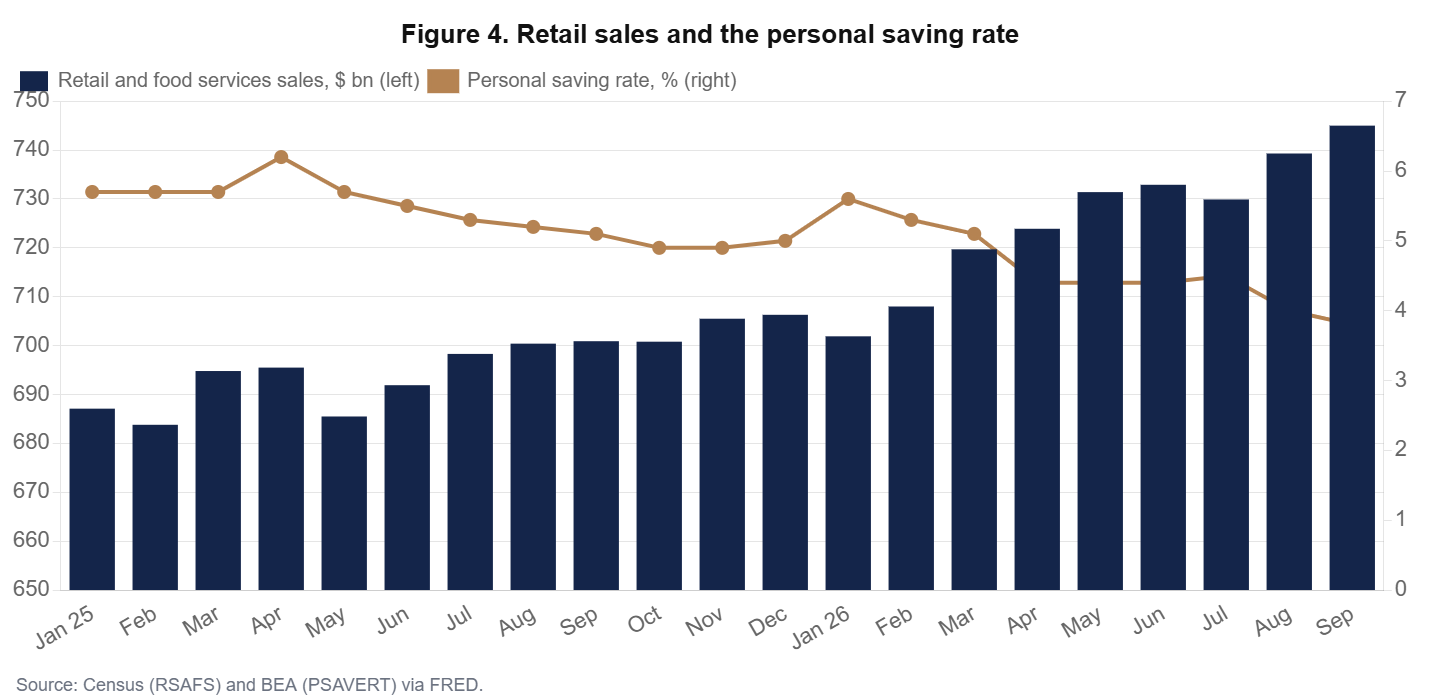
The combination tells a coherent story. Households used the larger refunds to maintain spending in the face of higher prices, rather than to rebuild savings. The tax cuts thus acted as a cushion against the energy shock, which helps explain the strength of consumption in the national accounts, with GDP growth of 3.4% at an annual rate in the third quarter. The flip side is that the cushion has been used: with saving near 4%, households enter 2027 with less room to absorb further shocks.
Who benefits
The distribution of the new deductions follows the design of each provision. The senior deduction, $6,000 per person aged 65 and over, phases out at higher incomes and goes mainly to middle-income retirees; with 30 million claimants and an average deduction of about $7,500 per return, it is the most widely shared. The overtime deduction benefits workers in manufacturing, transportation, health care and public safety whose employers pay time-and-a-half; it is capped and phased out above $150,000 of income for single filers. The tips deduction is narrow: about 3% of filers, generally younger and lower-income, according to the National Taxpayers Union, with a large average benefit for those who qualify.
What these provisions have in common is that they distinguish between workers with similar incomes according to the form of their pay or their age. A nurse paid overtime and a teacher without overtime, both earning $70,000, receive different tax treatment; so do a 66-year-old and a 64-year-old with the same income. That is a deliberate policy choice, defended as a reward for hard work and support for seniors, but it adds complexity to the tax code. The IRS website recorded 52.5% more visits in the early filing season than a year earlier, a rough indicator of the extra effort taxpayers needed to understand the new rules.
Table 3. Design features of the four deductions
| Deduction | Maximum | Main beneficiaries | Behavioural intent |
|---|---|---|---|
| Seniors | $6,000 per person 65+ | Middle-income retirees | Income support |
| Overtime | $12,500 single, $25,000 joint (premium part only) | Hourly workers with overtime | Encourage longer hours |
| Tips | $25,000 | Restaurant, hospitality and personal service workers | Reward tipped work |
| Car loan interest | $10,000 a year | Buyers of new US-assembled vehicles | Support domestic auto industry |
The macroeconomic effect in perspective
How large was the fiscal impulse? A tax cut of $40 to $75 billion is between 0.13% and 0.24% of GDP, concentrated in the spring of 2026. If households spent half of it within a few months, consistent with the decline in the saving rate, the boost to consumption would have been about 0.1 point of GDP in the first half of 2026. That is noticeable but not large; the energy shock that hit real incomes in the same months was of a similar or larger order. The refund wave therefore cushioned the shock rather than creating a boom.
The timing matters for monetary policy. The Federal Reserve held rates at 3.75% to 4% in October, with two members preferring a hike, and markets now expect an increase in December. Household spending supported by lower saving rather than by real income growth is less durable. If the 2027 refund season provides a smaller boost, as we expect, consumption growth could slow just as tighter monetary policy takes effect.
The cost and the 2027 season
The four deductions cost the Treasury roughly $40 to $75 billion in tax year 2025 on our estimates, and a similar amount each year they remain in force. They expire after 2028 under current law. In the 2027 filing season, the effect on refunds will be smaller, because many workers have adjusted their withholding and employers now report qualified tips and overtime separately. Refunds should therefore grow less than in 2026, and the spending impulse from the spring will be weaker, at a time when the Federal Reserve is tightening policy.
Lessons for tax design
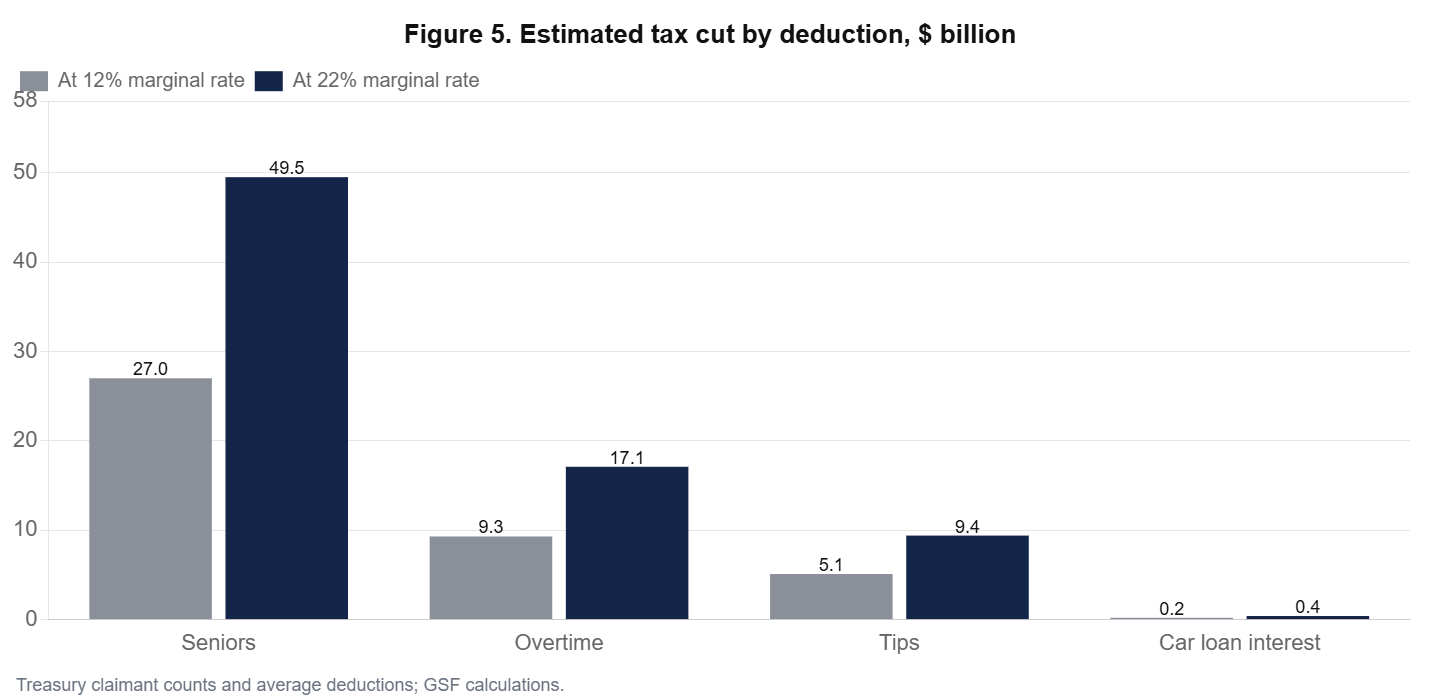
Figure 5 shows the estimated tax cut from each deduction at the two marginal rates. The senior deduction dominates under both assumptions. The overtime and tips deductions, which received most of the attention, together cost between about $14 and $27 billion. The car loan interest deduction is almost negligible in aggregate.
Three lessons follow for the design of future tax policy. First, targeted deductions are an imprecise way to support household incomes: they reach only those with the qualifying type of income, require new reporting by employers and add complexity for taxpayers. A broader instrument, such as a larger standard deduction or a refundable credit linked to earnings, would reach more workers with similar incomes at the same cost. Second, incentive effects should be tested rather than assumed: our analysis finds at most a small effect of the overtime deduction on hours, which is consistent with the design of the provision. Third, timing matters: by delivering a year of tax cuts in a single block of refunds, the retroactive application of the law created a temporary spending impulse, which may have been welcome in 2026 but complicates the reading of the economy and of monetary policy.
These lessons do not settle the political question. Supporters of the deductions value their symbolism and their direct link to work and age; critics emphasise their cost and their uneven treatment of similar taxpayers. Both will have more data in 2027, when IRS statistics on the distribution of claims by income become available.
Conclusion
The 2026 filing season delivered a refund wave of about $26 billion more than in 2025 by the start of April, and a broader tax cut of about $40 to $75 billion through the four new deductions, most of it going to seniors. The deductions did support spending at a difficult moment, mainly by lowering savings. But they did not visibly change how Americans work: the rise in overtime is largely explained by the industrial cycle. For economic policy, the lesson is that targeted deductions sold as work incentives behave mostly like transfers. Judged as transfers, their distribution, favouring seniors and workers with overtime or tips over other workers with similar incomes, is the relevant question for the debate on their renewal after 2028.
Robustness and limits
The overtime result is sensitive to the estimation window, and we report that sensitivity rather than hide it. Our main model, fitted on January 2023 to June 2025, gives a slope of 0.33 and an unexplained gap of 0.11 hour in the last six months. January 2023, however, is an outlier with unusually high overtime. Excluding it, or fitting the model on 2024 and early 2025 only, gives a flatter slope of about 0.27 and an unexplained gap of about 0.18 hour. On those specifications, about half of the rise in overtime, rather than a quarter, is not explained by the workweek. The range of plausible estimates is therefore 0.1 to 0.2 hour a week, a quarter to a half of the observed increase.
Even the upper end is modest. Two tenths of an hour a week is about twelve minutes, and other forces were pushing overtime up in 2026: defence orders, reshoring and the recovery of manufacturing employment from early 2026. A cleaner test would compare workers eligible for the deduction with similar workers who are not, for example by income level or state, using microdata that will become available in 2027. Until then, the evidence is compatible with a small incentive effect and inconsistent with a large one.
Table A1. Data appendix: manufacturing hours since the law was signed (hours per week)
| Month | Average workweek | Actual overtime | Predicted overtime | Gap |
|---|---|---|---|---|
| Jul 25 | 41.1 | 3.7 | 3.74 | -0.04 |
| Aug | 41.0 | 3.7 | 3.70 | +0.00 |
| Sep | 41.0 | 3.8 | 3.70 | +0.10 |
| Oct | 41.1 | 3.7 | 3.74 | -0.04 |
| Nov | 41.3 | 3.9 | 3.80 | +0.10 |
| Dec | 41.1 | 3.7 | 3.74 | -0.04 |
| Jan 26 | 41.4 | 3.9 | 3.83 | +0.07 |
| Feb | 41.6 | 3.9 | 3.90 | +0.00 |
| Mar | 41.5 | 3.9 | 3.87 | +0.03 |
| Apr | 41.6 | 4.0 | 3.90 | +0.10 |
| May | 41.6 | 4.0 | 3.90 | +0.10 |
| Jun | 41.7 | 4.1 | 3.93 | +0.17 |
| Jul | 41.8 | 4.1 | 3.97 | +0.13 |
| Aug | 41.8 | 4.1 | 3.97 | +0.13 |
| Sep | 41.9 | 4.0 | 4.00 | +0.00 |
| Oct | 41.8 | 4.1 | 3.97 | +0.13 |
Methodological note
Refund totals and averages are from IRS weekly filing statistics as reported in April 2026, and Treasury’s end-of-season release. Tax cut ranges apply 12% and 22% marginal rates to Treasury’s claimant counts and average deductions. The overtime model regresses AWOTMAN on AWHMAN by OLS over January 2023 to June 2025 (30 months) and compares fitted and actual values after the law. Retail sales (RSAFS) are nominal and include gasoline stations. All monthly data via FRED.
GO DEEPER
The 2026 US Economy Trilogy (3 books, PDF)
Growth from the AI investment boom, the Federal Reserve and the credit economy, and what inflation leaves in the household budget: the forces behind this article, analysed in three research books by Dr. Driss Effina. About 900 pages in English PDF.
$59 instead of $90
Sources
- US Department of the Treasury, Over 53 Million Filers Claimed At Least One of President Trump’s Signature New Tax Cuts, April 2026; IRS filing season statistics as reported by CPA Practice Advisor (February to April 2026) and Forbes (March 2026); National Taxpayers Union, 2026.
- BLS average weekly overtime and hours in manufacturing (AWOTMAN, AWHMAN), food services employment (CES7072200001); Census retail sales (RSAFS); BEA personal saving rate (PSAVERT); BEA GDP advance estimate for Q3 2026.
- Driss EFFINA, PhD | Independent Researcher, Global Strategy Files | globalstrategyfiles.com
Driss EFFINA, PhD
The opening pages of our four country reports: United States, United Kingdom, Japan and China. A free PDF, sent to your inbox.
You will also receive occasional analysis from Global Strategy Files. Unsubscribe in one click, at any time.