
The Uninsured Return: What the End of the Enhanced ACA Subsidies Did to Coverage and Costs


Driss EFFINA, PhD Independent Researcher, Global Strategy Files. Decoded, 11 November 2026. Reading time: about 10 minutes.
Key takeaways
- Average paid enrollment in the ACA Marketplaces is on course to fall from 22.3 million in 2025 to about 17.5 million in 2026, a loss of roughly 4.8 million covered people in a single year, the largest since the exchanges opened.
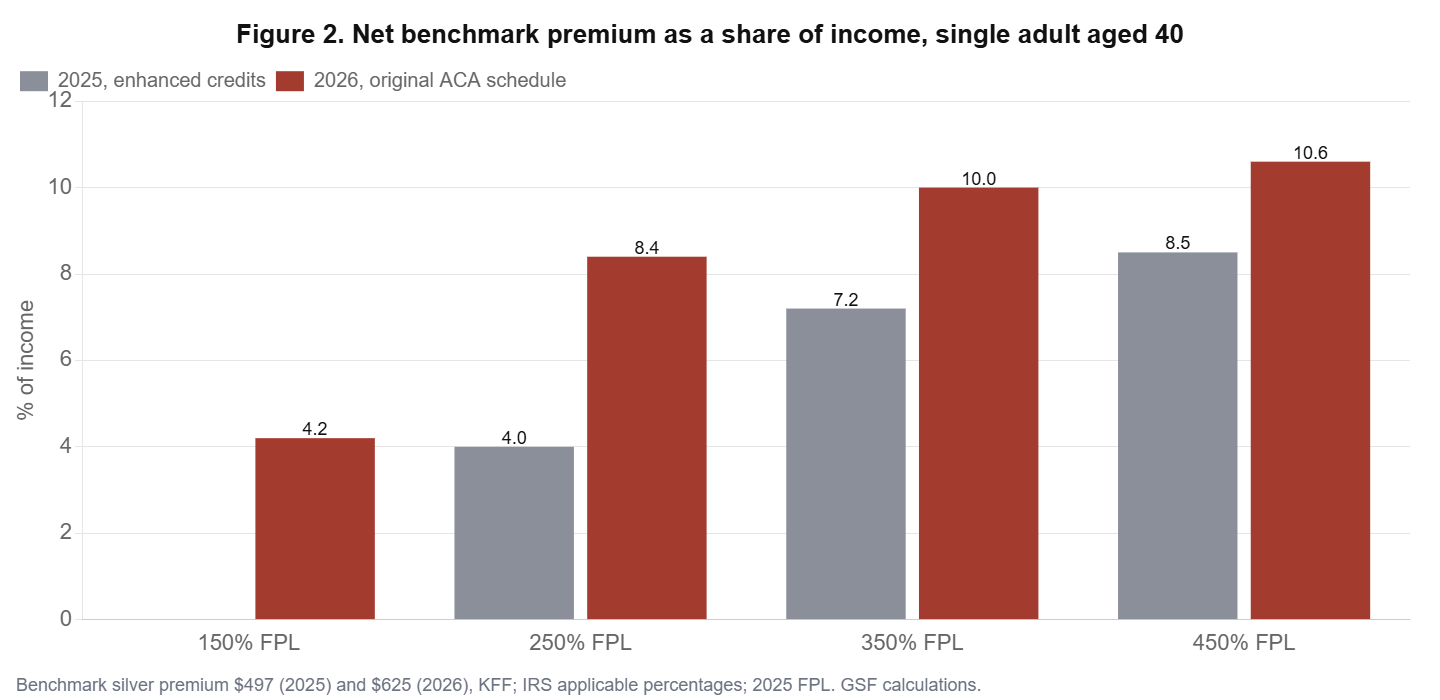
- For a single adult aged 40, the net cost of the benchmark plan rose from 4.0% to 8.4% of income at 250% of the poverty line, and from 7.2% to 10.0% at 350%. Above 400% of the poverty line the subsidy disappears entirely.
- The cliff is brutal for older buyers. A 60-year-old earning just above $62,600 now pays about $15,900 a year for the benchmark plan, against about $6,200 for someone earning a dollar less: a $9,700 penalty for one extra dollar of income.
- Comparing the 58% rise in the average net premium with the drop in enrollment yields an arc elasticity of about minus 0.37: each 10% increase in what households pay costs the Marketplace almost 4% of its members.
- Because the people who leave are younger and healthier, the remaining pool becomes more expensive. Our model puts the adverse selection premium at 7% to 12%, roughly consistent with the 13% average benchmark increase announced for 2027.
- New Mexico, which replaced the federal credits with state money, saw enrollment rise 14% in February while the national figure fell 12%. It is the clearest natural experiment of 2026.
A coverage shock that the macro data do not see
At midnight on 31 December 2025 the enhanced premium tax credits created in 2021 and extended in 2022 expired. Congress did not renew them. The decision did not register in GDP, payrolls or the consumer price index, which measures health insurance through an indirect method. Yet it is one of the largest changes in household finances of 2026: for the roughly 22 million Americans who bought subsidized coverage on the exchanges in 2025, the net cost of the same plan more than doubled on average, by about 114% according to KFF.
This article measures the consequences with public data from CMS, KFF and the Internal Revenue Service schedules. We compute what typical households now pay, estimate how strongly enrollment reacts to price, test the experience of New Mexico against the rest of the country, and model how the departure of healthier customers is feeding a second round of premium increases in 2027. The question is not whether the subsidies should have been extended, a choice on which reasonable people disagree, but what their expiry is actually doing.
The size of the retreat
The exchanges grew rapidly under the enhanced credits. Plan selections during open enrollment rose from 12.0 million in 2021 to 24.3 million in 2025. In 2026 they fell for the first time, to 23.1 million, but sign-ups understate the change because many people selected a plan and then never paid for it. By February, paid enrollment was 2.6 million below its level a year earlier, a drop of 12%. Using the attrition patterns reported by insurers, KFF estimates that average paid enrollment over 2026 will be about 17.5 million, and possibly as low as 16.5 million (Figure 1). The Congressional Budget Office had projected 16.9 million.

The broader individual market, which includes plans bought directly from insurers, fell 18% year on year to 20.5 million people in June 2026, the steepest decline since 2015. A KFF survey of 2025 enrollees conducted in February and March found that 9% had already become uninsured. Enrollment fell in every state except New Mexico.
What households now pay
The ACA subsidy works by capping the share of income a household pays for the benchmark silver plan. Under the enhanced schedule, people below 150% of the poverty line paid nothing, and nobody paid more than 8.5% of income, whatever their earnings. The original schedule, now back in force with 2026 indexing, starts at 2.10% of income and rises to 9.96% between 300% and 400% of the poverty line. Above 400%, there is no subsidy at all. At the same time, the average benchmark premium for a 40-year-old rose 26%, from $497 to $625 a month.
Table 1 applies the two schedules to typical households, using the 2025 poverty guidelines that govern 2026 coverage ($15,650 for a single person and $32,150 for a family of four) and the federal default age curve.
Table 1. Annual net cost of the benchmark silver plan, 2025 rules versus 2026 rules
| Household | Income (% FPL) | Income ($) | 2025 net cost | 2026 net cost | 2025 % income | 2026 % income |
|---|---|---|---|---|---|---|
| Single, age 40 | 150% | 23,475 | 0 | 984 | 0.0 | 4.2 |
| Single, age 40 | 250% | 39,125 | 1,565 | 3,302 | 4.0 | 8.4 |
| Single, age 40 | 350% | 54,775 | 3,971 | 5,456 | 7.2 | 10.0 |
| Single, age 40 | 450% | 70,425 | 5,964 | 7,500 | 8.5 | 10.6 |
| Single, age 60 | 450% | 70,425 | 5,986 | 15,927 | 8.5 | 22.6 |
| Family of four | 250% | 80,375 | 3,215 | 6,784 | 4.0 | 8.4 |
| Family of four | 350% | 112,525 | 8,158 | 11,207 | 7.2 | 10.0 |
| Family of four | 450% | 144,675 | 12,297 | 23,979 | 8.5 | 16.6 |
Three patterns emerge. At low incomes the increase is large in relative terms but modest in dollars: a single adult at 150% of the poverty line now pays about $82 a month instead of nothing, which is nonetheless enough to deter enrollment among people with little cash flexibility. In the middle, the burden roughly doubles as a share of income (Figure 2). At the top, the change is not a slope but a cliff.
The 400% cliff
For older buyers above 400% of the poverty line, the end of the cap is dramatic, because their unsubsidized premiums are high. A single 60-year-old earning $62,500 pays about $6,200 a year in 2026; the same person earning $62,700 pays the full benchmark premium of about $15,900 (Figure 3). The marginal tax rate implied by that dollar of income is several thousand percent. The households most exposed are early retirees, self-employed professionals and small business owners in their late 50s and early 60s, living in high-premium states such as Wyoming, West Virginia or Alaska. They are not poor, but many are now paying a fifth or more of their income for health insurance, or going without it.

How strongly does enrollment react to price?
CMS data show that the average premium paid after tax credits rose from $113 to $178 a month, an increase of 58%. If average paid enrollment falls by 21.5%, the midpoint of the range estimated by the actuarial firm Wakely, the implied arc elasticity of enrollment with respect to the net premium is about minus 0.37. In plain terms, each 10% rise in what households pay drives almost 4% of members out of the market.
That elasticity is moderate, which is what economic theory predicts: health insurance is valued, and most of those who stay are people who expect to use care. But it is large enough to change the composition of the pool, and that is where the second-round effects begin.
New Mexico as a natural experiment
New Mexico is the only state that fully replaced the expired federal enhancements with its own funds. Its Marketplace enrollment rose 14% in February 2026, while national paid enrollment fell 12%. The gap of about 26 percentage points is a raw comparison, not a full causal estimate, since New Mexico also ran outreach campaigns and has a specific population. But the sign and size are informative: when net prices are held down, enrollment grows even in a year when it is falling everywhere else. The experiment has a price: the state funded the backfill in a special legislative session, at a time when its analysts already expected new federal Medicaid and nutrition rules to add about $620 million of recurring costs in fiscal 2027. Other states can now observe both the price and the result.
The adverse selection premium
Insurers anticipated what would happen. In their 2026 filings they added about four percentage points to premiums because they expected healthier customers to leave. A KFF survey confirms the pattern: younger enrollees were much more likely to drop coverage than those aged 50 and over. When low-cost members leave, the average cost of those who remain rises, and so does next year’s premium.
We quantify the mechanism with a simple model. Suppose 21.5% of 2025 members leave and their average claims cost is a fraction of the cost of those who stay. If leavers cost 50% as much as stayers, the average cost of the pool rises by 12.0%; at 60% it rises by 9.4%; at 70%, by 6.9% (Figure 4). These figures are of the same order as the 13% average increase in benchmark premiums announced for 2027, after 26% in 2026. Selection is not the only driver, since hospital prices, drug costs and utilization also matter, but it plausibly explains half or more of the 2027 increase.

There is a fiscal irony here. Because the federal tax credit is tied to the benchmark premium, higher premiums automatically raise the subsidy paid for every person who remains. Part of the budget saving from ending the enhancements is therefore clawed back by the adverse selection it causes. The people who absorb the full cost are those above 400% of the poverty line, who receive no credit, and the newly uninsured.
Where the bill goes next
Coverage losses do not make medical needs disappear. Uninsured people use less care, delay treatment and, when they do need hospital care, often cannot pay. Using a conservative range of $1,000 to $1,600 of uncompensated care per newly uninsured person per year, a loss of 4.8 million covered lives implies roughly $4.8 billion to $7.7 billion a year of additional uncompensated care, with a central estimate near $6.2 billion. That cost falls on hospitals, especially rural and safety-net hospitals with thin margins, and through them on state budgets and on the premiums of privately insured patients.
Table 2. Who absorbs the cost of the subsidy expiry
| Group | Mechanism | Order of magnitude |
|---|---|---|
| Subsidized enrollees who stay | Net premiums more than double on average | +114% (KFF) |
| Enrollees above 400% FPL | Loss of all credits; full premium | Up to 20%+ of income for older buyers |
| Newly uninsured | Loss of coverage, higher out-of-pocket risk | About 4.8 million people |
| Hospitals | Additional uncompensated care | $4.8 bn to $7.7 bn a year |
| Remaining pool | Adverse selection | +7% to +12% on claims cost |
| Federal budget | Savings partly offset by higher benchmark | Credit per enrollee rises |
Who has left the market
The aggregate decline hides a strong pattern by age, income and geography. Younger enrollees were the most likely to drop coverage: in the KFF survey of 2025 Marketplace customers, the share who had become uninsured was markedly lower among those aged 50 and over (7%) than in the population of enrollees as a whole (9%). Those who left were also more likely to have incomes just above the old zero-premium threshold, for whom a premium of $50 to $100 a month replaced a free plan, and middle-income buyers above 400% of the poverty line, who lost all help.
Geography mattered through two channels. First, premium increases were much larger in states using HealthCare.gov, where benchmark premiums rose about 30%, than in states running their own exchanges, where they rose 17%. Arkansas recorded the largest increase in benchmark premiums, 69%, followed by Washington, Tennessee, Mississippi and Illinois. Second, a handful of states recorded enrollment drops of more than 15%: Arizona, Delaware, Indiana, North Carolina, Ohio, Oklahoma, Oregon and West Virginia. These states combine large premium increases, a high share of enrollees just above the old thresholds and, in several cases, no state-funded supplement.
Among those who stayed, many switched to cheaper plans with higher deductibles. The lowest-cost bronze plan averaged $456 a month for a 40-year-old in 2026, against $625 for the benchmark silver plan, but bronze plans carry much larger deductibles and no cost-sharing reductions. This migration is the main reason the average Marketplace deductible rose 37%, to a record $3,786. It means that the coverage statistics overstate the protection that remains: a growing share of enrollees are insured against catastrophic costs but face thousands of dollars of out-of-pocket spending before their coverage pays for ordinary care.
Table 3. Three snapshots of the 2026 Marketplace
| Indicator | 2025 | 2026 | Change |
|---|---|---|---|
| Average benchmark premium, age 40 ($ per month) | 497 | 625 | +26% |
| Average premium paid after credits ($ per month) | 113 | 178 | +58% |
| Average Marketplace deductible ($) | about 2,759 | 3,786 | +37% |
| Average paid enrollment (millions) | 22.3 | about 17.5 | about -21% |
| Share of enrollees receiving a subsidy | 93% | 87% | -6 points |
Scenarios for 2027 and 2028
What happens next depends on whether Congress acts and on how fast the selection spiral turns. We consider three scenarios, using the enrollment elasticity estimated above and the 13% benchmark increase announced for 2027. Their purpose is to frame the range of outcomes, not to forecast a legislative result.
In the status quo, the 2027 benchmark increase raises the cost of the benchmark plan for the roughly 13% of enrollees who receive no subsidy by 13%. Applying our elasticity of minus 0.37, that alone would reduce their enrollment by about 5%, or a fraction of a percentage point of total enrollment. The larger effect is continued attrition among subsidized enrollees who struggle to pay, which insurers expect to keep pushing premiums up. Average paid enrollment would plausibly drift toward 16 to 17 million in 2027.
In a targeted fix, Congress restores a cap on the benchmark premium as a share of income for households above 400% of the poverty line. Because these households are older on average and face the steepest cliff, the fix would bring back a disproportionate share of relatively healthy middle-aged buyers, which would also slow the selection spiral. Its cost would be much lower than a full restoration because the number of people concerned is limited.
In a full restoration, the enhanced schedule returns, zero-premium plans reappear for low-income enrollees and the cap of 8.5% of income applies to everyone. Enrollment would likely recover most of its 2026 loss within two open enrollment periods, as it rose by almost 10 million people between 2021 and 2025 under the same schedule. The fiscal cost would be the highest of the three options.
Table 4. Scenario matrix for the Marketplace, 2027 to 2028
| Scenario | Net premium for typical enrollee | Enrollment direction | Selection spiral | Fiscal cost |
|---|---|---|---|---|
| Status quo | Stable for subsidized, +13% for unsubsidized | 16 to 17 million in 2027 | Continues | Lowest |
| Targeted cliff fix | Capped above 400% FPL | Partial recovery among older buyers | Slows | Moderate |
| Full restoration | Back to 0% to 8.5% of income | Recovery toward 2025 levels | Reverses | Highest |
What to watch
- Open enrollment for 2027, which began on 1 November: the number of plan selections and, above all, the share of new and returning enrollees who pay their first premium.
- Effectuated enrollment reports from CMS in the first half of 2027, the only reliable measure of how many people actually keep coverage.
- Uncompensated care reported by hospital systems and state hospital associations, especially in states with the largest enrollment drops.
- State supplements: whether other states follow New Mexico, and at what cost.
- 2028 rate filings, due in spring 2027, which will show whether insurers see the pool stabilising or deteriorating further.
Options and their arithmetic
The debate in the new Congress is likely to revolve around three options. A full restoration of the enhanced credits would bring back most of the lost enrollment but at a substantial fiscal cost. A targeted fix that only restores a cap on premiums as a share of income above 400% of the poverty line, for example at 8.5% or 10%, would remove the cliff at a fraction of the cost, because it affects a smaller group whose premiums would otherwise be prohibitive. A third path, already chosen by New Mexico, is for states to fund their own supplements. Our analysis suggests that the cliff fix offers the highest ratio of coverage retained per dollar for older middle-income households, while low-income enrollment is most sensitive to the restoration of zero-premium plans.
Whatever the choice, timing matters. Each year without a decision deepens the selection spiral, making the eventual repair more expensive. The 2027 premium increase shows that the market is already pricing the departure of its healthiest customers.
Conclusion
The end of the enhanced ACA subsidies has produced the largest single-year decline in Marketplace coverage on record, roughly 4.8 million people, concentrated among younger, healthier and price-sensitive buyers. For those who remain, net costs have roughly doubled; for older buyers above 400% of the poverty line, they have tripled. The market is now in a classic adverse selection dynamic in which each round of departures raises the next round of premiums. The policy saving is real but smaller than it looks, because higher benchmark premiums inflate the credits paid to those who stay, and because hospitals and states inherit part of the bill. The coming year will show whether Washington treats the cliff as a design flaw to fix or as a price signal to accept.
Robustness and limits
Three caveats qualify the results. First, the 2026 enrollment figure is an estimate: KFF’s central figure of 17.5 million could be revised once CMS publishes full-year effectuated enrollment, and the range runs from 16.5 to about 18 million. With a decline of 17% instead of 21.5%, the implied elasticity would be about minus 0.30; with 26%, about minus 0.45. The qualitative conclusion, a moderate but significant price response, holds across the range.
Second, the average premium after credits mixes two effects: the expiry of the enhanced schedule and the shift of enrollees toward cheaper bronze plans. Because some people downgraded rather than paid more, the 58% rise understates the increase for those who kept the same plan, which KFF puts at 114%. Using that larger figure would lower the elasticity to about minus 0.19. The true price response probably lies between the two.
Third, our adverse selection model is deliberately simple. It treats leavers and stayers as two groups with fixed relative costs, ignores changes in utilisation by those who remain, and assumes that insurers fully reprice in one year. In reality, risk adjustment between insurers, reinsurance programs in some states and lags in claims data all spread the effect over time. The range of 7% to 12% should therefore be read as the medium-term pressure on premiums rather than the increase in any single year.
Table A1. Data appendix: applicable percentage of income for the benchmark plan
| Household income (% of poverty line) | 2025 (enhanced schedule) | 2026 (original schedule, indexed) |
|---|---|---|
| Below 133% | 0% | 2.10% |
| 133% to 150% | 0% | 3.14% to 4.19% |
| 150% to 200% | 0% to 2.0% | 4.19% to 6.60% |
| 200% to 250% | 2.0% to 4.0% | 6.60% to 8.44% |
| 250% to 300% | 4.0% to 6.0% | 8.44% to 9.96% |
| 300% to 400% | 6.0% to 8.5% | 9.96% |
| Above 400% | 8.5% | No subsidy |
Methodological note
Net premiums are computed as the minimum of the benchmark premium and the applicable percentage of income, using the ARPA schedule for 2025 and the IRS schedule for 2026 (2.10% to 9.96%), linearly interpolated within bands. Poverty guidelines for 2025 apply to 2026 coverage. Age 60 premiums use the federal default age curve (2.714 against 1.278 at age 40). The elasticity is an arc elasticity combining CMS average net premiums and the Wakely midpoint of the enrollment decline. The adverse selection model assumes 21.5% of members leave with relative costs of 50% to 70%. Uncompensated care uses an assumed $1,000 to $1,600 per newly uninsured person. All model outputs are illustrative.
GO DEEPER
The 2026 US Economy Trilogy (3 books, PDF)
Growth from the AI investment boom, the Federal Reserve and the credit economy, and what inflation leaves in the household budget: the forces behind this article, analysed in three research books by Dr. Driss Effina. About 900 pages in English PDF.
$59 instead of $90
Sources
- KFF, What We Know So Far About 2026 ACA Marketplace Enrollment, Premiums, and Deductibles, 19 May 2026; KFF, ACA Insurers Are Raising Premiums by an Estimated 26%; Peterson-KFF Health System Tracker, How much and why ACA Marketplace premiums are going up in 2027; KFF survey of 2025 Marketplace enrollees, March 2026.
- CMS, Health Insurance Exchanges 2026 Open Enrollment Report; IRS applicable percentage table for 2026; HHS poverty guidelines 2025; Commonwealth Fund, June 2026; Pew Charitable Trusts, How States Are Assessing the Impact of Federal Policy Changes, November 2025.
- Driss EFFINA, PhD | Independent Researcher, Global Strategy Files | globalstrategyfiles.com
Driss EFFINA, PhD
The opening pages of our four country reports: United States, United Kingdom, Japan and China. A free PDF, sent to your inbox.
You will also receive occasional analysis from Global Strategy Files. Unsubscribe in one click, at any time.