
Australia’s Return to Monetary Tightening in 2026: Why the Reserve Bank Raised Rates Four Times and What It Means for Households

Australia’s Return to Monetary Tightening in 2026: Why the Reserve Bank Raised Rates Four Times and What It Means for Households
Driss EFFINA, PhD Independent Researcher, Global Strategy Files Reading time: about 26 minutes
Key takeaways
- The RBA raised the cash rate to 4.60 percent on 29 September 2026, its fourth increase since February and the highest since November 2011.
- Underlying trimmed mean inflation rose from 2.7 percent in mid-2025 to 3.6 percent in mid-2026, after the RBA had cut rates three times.
- A Taylor-type rule places the appropriate cash rate between 4.45 and 5.45 percent, with a central value of about 4.95 percent.
- The four 2026 increases add about A$446 to monthly repayments on a typical new mortgage of A$731,000.
Abstract
On 29 September 2026, the Monetary Policy Board of the Reserve Bank of Australia (RBA) raised the cash rate target by 25 basis points to 4.60 percent, its fourth increase since February and the highest level since November 2011. Less than a year earlier, the RBA had completed three rate cuts that brought the cash rate down to 3.60 percent. This article examines the reasons for this rapid reversal and its consequences, using data from the RBA statistical tables, the Australian Bureau of Statistics (ABS), the minutes of the September 2026 meeting and the Cotality housing value index. The author constructs five indicators: the real cash rate, a Taylor-type policy rule with a range of neutral rate assumptions, a decomposition of unit labour costs into wages and productivity, the cost of the tightening for a typical mortgage, and three scenarios for the cash rate to the end of 2027. The results show that the 2025 easing cycle began when inflation had not yet durably returned to target, and that underlying inflation rose again from 2.7 percent in mid-2025 to 3.6 percent in mid-2026. The real cash rate, at about 1 percentage point, is moderately restrictive but no higher than at the end of 2024. The policy rule places the appropriate cash rate between 4.45 and 5.45 percent, with a central value of about 4.95 percent, which suggests that the current setting is within the range but at its lower half. The main structural problem is productivity: labour productivity per hour in the non-farm sector is about 5.7 percent below its early 2022 level, so that wage growth of only about 3.2 percent produces unit labour cost growth of 3.5 percent, above what is consistent with the inflation target. For a typical mortgage of A$731,000, the four increases of 2026 add about A$446 to monthly repayments. The article concludes that Australian monetary policy faces a supply-side constraint that interest rates cannot solve, and that the risk of further increases remains significant as long as productivity does not recover.
Keywords: Australia, Reserve Bank of Australia, monetary policy, inflation, cash rate, Taylor rule, productivity, unit labour costs, housing market, mortgages
JEL codes: E31, E43, E52, E58, J24, R31
1. Introduction
Central banks rarely reverse direction within a few months. When they do, it usually means that their earlier assessment of the economy proved wrong, or that a new shock changed the outlook. In 2026, the Reserve Bank of Australia did both.
In 2025, after holding the cash rate at 4.35 percent for more than a year, the RBA cut it three times: in February, May and August, to 3.60 percent. Inflation appeared to be returning to the target band of 2 to 3 percent, and the labour market was gradually loosening. By early 2026, the picture had changed. Underlying inflation had stopped falling and begun to rise again. In February 2026, the RBA raised the cash rate to 3.85 percent, then to 4.10 percent in March and 4.35 percent in May. After two meetings without change in June and August, it raised the rate again on 29 September to 4.60 percent.
Several factors contributed to this reversal. The escalation of the conflict in the Middle East pushed oil prices above US$105 a barrel. The global boom in investment in artificial intelligence raised prices for some technology goods and inputs and added to demand. And domestically, capacity pressures turned out to be greater than the RBA had estimated, notably because of weak productivity.
This article analyses the 2026 tightening cycle using official data and the author’s own calculations. It asks four questions. Was the 2025 easing premature? How restrictive is monetary policy now? What is the role of productivity in the persistence of inflation? And what are the consequences for households, especially mortgage borrowers?
Section 2 presents the institutional and economic context. Section 3 reviews the literature. Section 4 describes the data and methods. Section 5 presents the results. Section 6 discusses them. Section 7 presents scenarios. Section 8 concludes.
2. Context
2.1 The institutional framework
The Reserve Bank of Australia has an inflation target of 2 to 3 percent, with the midpoint of 2.5 percent as the explicit focus since the reforms that followed the independent Review of the Reserve Bank of Australia published in 2023. Since March 2025, monetary policy decisions are taken by a dedicated Monetary Policy Board, separate from the board responsible for governance. The RBA also has a mandate for full employment, which it interprets as the maximum level of employment consistent with low and stable inflation.
Australian monetary policy has a specific transmission channel: the very high share of variable rate mortgages. Most Australian home loans are at variable rates or at fixed rates for short periods of two to three years. Changes in the cash rate therefore pass rapidly into household mortgage payments, much faster than in countries such as the United States, where thirty-year fixed rate mortgages dominate. This “cash flow channel” makes Australian monetary policy powerful, but also makes its effects highly visible to the public.
2.2 The 2022 to 2024 cycle
After keeping the cash rate at a record low of 0.10 percent during the pandemic, the RBA began raising rates in May 2022, as inflation rose rapidly. In thirteen increases between May 2022 and November 2023, the cash rate went from 0.10 to 4.35 percent. Headline inflation peaked at 7.9 percent at the end of 2022, and trimmed mean inflation, the RBA’s preferred measure of underlying inflation, at 6.8 percent.
Compared with other advanced economy central banks, the RBA raised rates less: the US Federal Reserve and the Bank of England both raised their policy rates to above 5 percent. The RBA justified this approach by the speed of transmission through variable rate mortgages and by its wish to preserve as much as possible of the gains in employment. Unemployment fell to about 3.5 percent in 2022 and 2023, the lowest level in almost fifty years.
2.3 The 2025 easing
Inflation fell gradually in 2024 and early 2025. Trimmed mean inflation fell to 2.9 percent in the first quarter of 2025 and 2.7 percent in the second quarter, within the target band for the first time since 2021. On this basis, the RBA cut the cash rate by 25 basis points in February, May and August 2025.
2.4 The 2026 reversal
From the third quarter of 2025, inflation rose again. Trimmed mean inflation increased to 2.9 percent in the third quarter of 2025, 3.3 percent in the fourth quarter, 3.5 percent in the first quarter of 2026 and 3.6 percent in the second quarter. Headline inflation reached 4.1 percent in the first quarter of 2026. The monthly CPI indicator, which now provides a complete monthly measure, peaked at 4.6 percent year on year in March 2026, and was 4.0 percent in August.
The September 2026 minutes describe the situation in detail. The July CPI was stronger than expected, particularly for market services. Petrol and diesel prices were 13 percent higher than assumed in the August forecasts. The share of items in the CPI basket with prices rising by more than 2.5 percent was well above average. RBA staff judged that the upside surprise more likely reflected domestic capacity pressures than the pass-through of the Middle East shock. Unit labour cost growth was above the rate consistent with the inflation target, because of weak productivity rather than strong wage growth. Short-term inflation expectations were elevated, and firms’ medium-term expectations had drifted higher.
The Board considered two options: keeping the rate at 4.35 percent or raising it by 25 basis points. A larger increase was not discussed. It decided unanimously to raise the rate, and stated that it would raise it further if required.
3. Literature review
The analysis draws on four strands of literature.
The first concerns policy rules. Taylor (1993) showed that US monetary policy could be well described by a simple rule in which the policy rate responds to inflation and to the output gap. Clarida, Galí and Gertler (1999) placed such rules in a new Keynesian framework and emphasised the importance of responding more than one for one to inflation (the “Taylor principle”). Orphanides (2003) showed that the use of real time data and uncertainty about the output gap and the neutral rate considerably complicate the use of such rules. In the Australian context, RBA research has used a variety of rules as cross-checks rather than as prescriptions.
The second strand concerns the neutral interest rate, the rate that is neither expansionary nor contractionary. McCririck and Rees (2017), in an RBA Bulletin article, estimated that the neutral real rate in Australia had fallen substantially since the global financial crisis, in line with international trends documented by Holston, Laubach and Williams (2017) for the United States and other economies. Since 2023, several central banks have suggested that the neutral rate may have risen again, which is relevant for assessing how restrictive policy is.
The third strand concerns the post-pandemic inflation episode. Bernanke and Blanchard (2023) showed that the initial surge of inflation in the United States came mainly from price shocks (energy, food, supply chain bottlenecks), while the persistence of inflation was linked to tight labour markets. This framework helps distinguish between the temporary effects of energy shocks and more persistent domestic pressures, which is precisely the distinction the RBA made in September 2026.
The fourth strand concerns the transmission of monetary policy through housing and mortgages. La Cava, Hughson and Kaplan (2016) documented the household cash flow channel in Australia, showing that households with variable rate mortgages adjust their consumption significantly when interest rates change. More broadly, the RBA’s Financial Stability Reviews regularly assess the share of borrowers facing cash flow shortfalls.
Finally, the Productivity Commission’s five-year productivity inquiry, published in 2023, documented the slowdown of Australian productivity growth over the previous decade and its consequences for wages and living standards. This issue is central to the present analysis and to the next articles in this series.
4. Data and methodology
4.1 Data
The data come mainly from the RBA statistical tables, downloaded in October 2026:
- the cash rate target and its history;
- Table G1 (consumer price inflation, quarterly) and Table G4 (monthly CPI indicator);
- Table H5 (labour force, monthly);
- Table H4 (wages, labour costs and productivity);
- Table H1 (GDP);
- Table F6 (housing lending rates);
- Table F2 (government bond yields);
- Table E2 (household finance ratios).
The analysis also uses the Monetary Policy Board statement and minutes of 29 September 2026, the transcript of the Governor’s media conference, the Cotality home value index for September 2026 and the summary of the August 2026 Statement on Monetary Policy forecasts.
4.2 Real cash rate
The real cash rate is calculated as the nominal cash rate at the end of each quarter minus year-ended trimmed mean inflation for the same quarter. This is an ex post measure, which uses observed inflation rather than expected inflation. For the third quarter of 2026, for which trimmed mean inflation will only be published at the end of October, the latest available value (3.6 percent, June quarter) is used.
4.3 Policy rule
The author uses a Taylor-type rule adapted to Australia, in which the unemployment gap replaces the output gap:
Rule rate = r + π + 0.5 × (π – 2.5) – 1.0 × (u – u*)*
where r* is the neutral real interest rate, π is year-ended trimmed mean inflation, 2.5 is the midpoint of the target, u is the unemployment rate and u* is the rate of unemployment consistent with stable inflation. The coefficient of -1.0 on the unemployment gap corresponds approximately to a coefficient of 0.5 on the output gap combined with an Okun’s law coefficient of about 2. The author assumes u* = 4.5 percent, close to recent RBA estimates, and uses three values of r*: 0.5, 1.0 and 1.5 percent. The result is a range rather than a point estimate.
4.4 Unit labour costs
Unit labour cost growth is approximately equal to the growth of average earnings per hour minus the growth of labour productivity per hour. The author uses the non-farm series from RBA Table H4 to show the contribution of each component.
4.5 Mortgage repayments
Monthly repayments are calculated for a principal and interest loan of A$731,000 (the average new mortgage size cited by the trade union federation ACTU at the time of the September decision) over 30 years, using the standard annuity formula. Interest rates are the average outstanding variable rate for owner-occupiers from RBA Table F6: 5.50 percent in January 2026 and 6.20 percent in August 2026. The author assumes that the September increase passes fully into variable rates, giving 6.45 percent, and calculates two further cases corresponding to cash rates of 4.85 and 5.10 percent.
4.6 Limitations
The policy rule is a simple benchmark, not a prescription. The neutral rate and u* are uncertain. The productivity series is volatile and has been affected by composition effects since the pandemic. The mortgage calculation applies to a new loan and does not represent the average outstanding loan, which is smaller. The scenarios are illustrative.
5. Results
5.1 The cycle in perspective
Figure 1 shows the cash rate together with headline and trimmed mean inflation from 2019 to 2026.
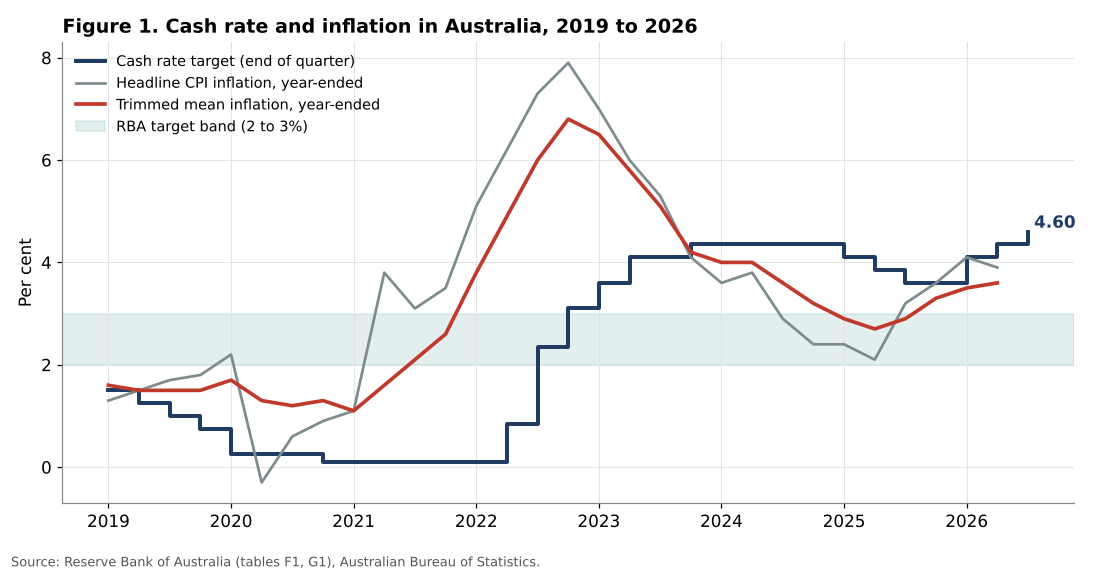
Three phases appear clearly. From 2019 to early 2022, the cash rate fell to 0.10 percent while inflation was below target and then started rising. From 2022 to 2024, the cash rate rose rapidly to 4.35 percent, as inflation peaked and then declined. From 2025 onward, a short easing phase was followed by a new tightening phase.
The key observation is the timing of the 2025 easing. When the RBA cut in February 2025, trimmed mean inflation was 3.2 percent (December quarter 2024), still above the target band. When it cut in May and August 2025, trimmed mean inflation was 2.9 and 2.7 percent: within the band, but above the 2.5 percent midpoint. Inflation then rose again without having reached the midpoint.
| Quarter | Cash rate (end) | Headline CPI | Trimmed mean |
|---|---|---|---|
| 2024 Q4 | 4.35 | 2.4 | 3.2 |
| 2025 Q1 | 4.10 | 2.4 | 2.9 |
| 2025 Q2 | 3.85 | 2.1 | 2.7 |
| 2025 Q3 | 3.60 | 3.2 | 2.9 |
| 2025 Q4 | 3.60 | 3.6 | 3.3 |
| 2026 Q1 | 4.10 | 4.1 | 3.5 |
| 2026 Q2 | 4.35 | 3.9 | 3.6 |
| 2026 Q3 | 4.60 | n.a. | n.a. |
Table 1. Cash rate and year-ended inflation, percent. Source: RBA, ABS.
The monthly CPI indicator shows the dynamics of 2025 and 2026 more precisely. Year-ended inflation was 1.9 percent in June 2025, then rose to 3.0 percent in July, 3.6 percent in September, 3.8 percent in December, 4.6 percent in March 2026, and has since stabilised between 3.5 and 4.2 percent, at 4.0 percent in August 2026.
Part of the increase in headline inflation in the second half of 2025 was due to the end of temporary government electricity rebates, which had artificially lowered measured prices in 2024 and early 2025. But the rise of trimmed mean inflation, which excludes the most extreme price changes, shows that the pressures were broader.
5.2 How restrictive is policy?
Figure 2 shows the real cash rate, defined as the cash rate minus trimmed mean inflation.
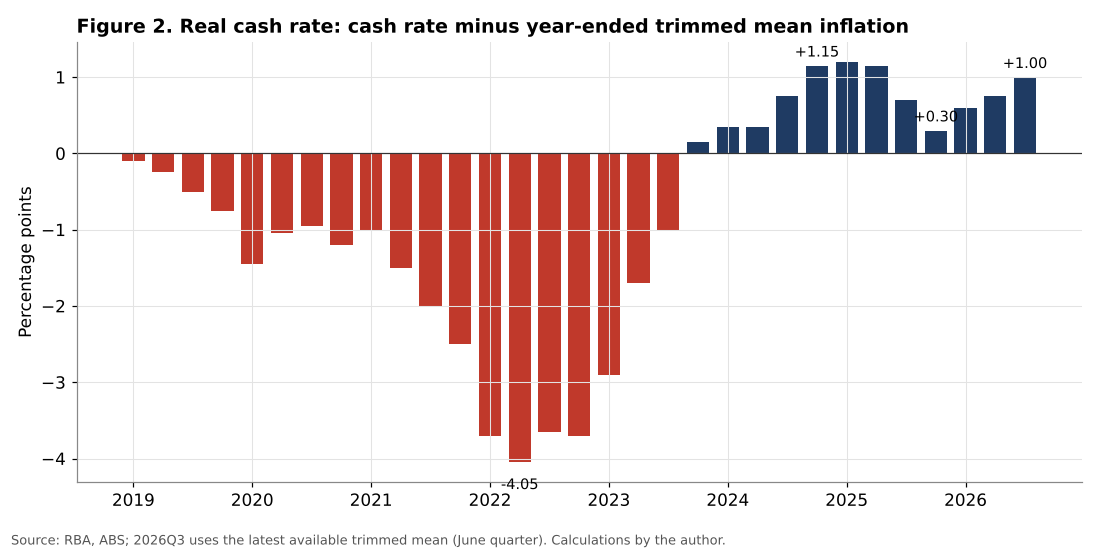
The real cash rate was negative from 2019 to the third quarter of 2023, reaching about -4 percentage points in 2022, when inflation was high and the cash rate was still rising. It became positive at the end of 2023 and peaked at about +1.2 points in late 2024 and early 2025.
The 2025 cuts, combined with rising inflation, reduced the real cash rate to +0.3 points at the end of 2025. In other words, monetary policy had become much less restrictive at the very time inflation was rising again. The four increases of 2026 brought the real cash rate back to about +1.0 point in the third quarter of 2026, roughly the level of late 2024.
This measure suggests that the current level of restriction is moderate: it is similar to the level that prevailed at the end of the previous cycle, which brought inflation down from 4 to 3 percent but not lower. If the neutral real rate is around 1 percent, as several estimates suggest, a real cash rate of 1 percent means that policy is roughly neutral rather than restrictive. If the neutral rate is lower, around 0.5 percent, policy is slightly restrictive. The RBA itself stated in September that the cash rate was near the top of the range of model-based estimates of the neutral rate, but that these estimates were highly uncertain and that the global neutral rate may have risen.
5.3 What does a policy rule suggest?
Figure 3 compares the actual cash rate with the range given by the Taylor-type rule.
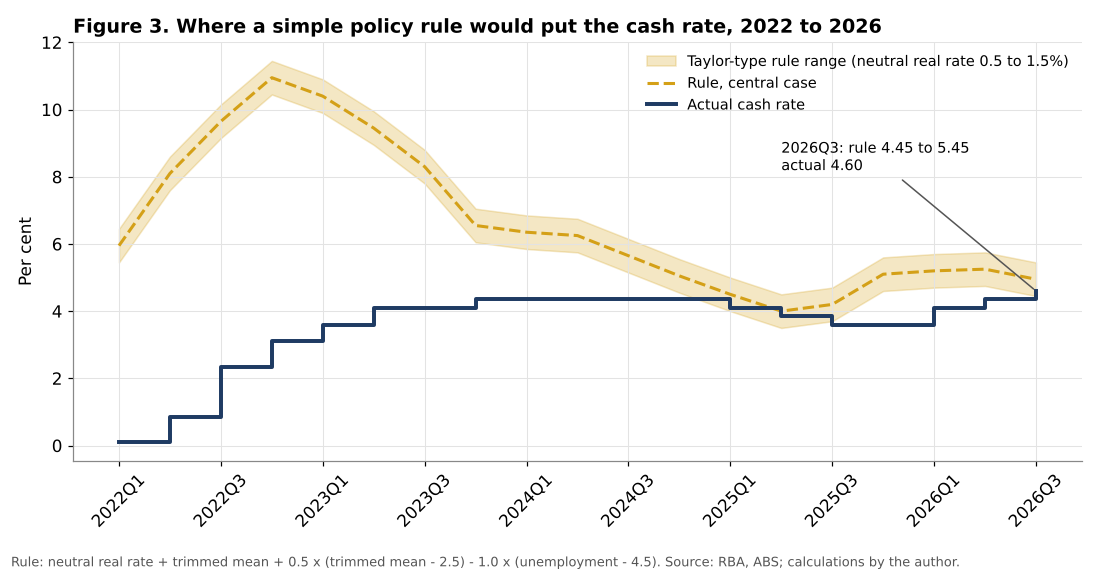
The results are instructive. In 2022 and 2023, the rule called for a cash rate between 6 and 11 percent, far above the actual rate. This reflects the combination of very high inflation and very low unemployment. The RBA chose a much more gradual path, justified by the speed of transmission through variable rate mortgages and by the view that much of the inflation came from temporary supply shocks. In retrospect, this choice was broadly vindicated: inflation fell without a recession, and unemployment rose only gradually.
In 2025, the actual rate came close to the rule: the cuts were broadly in line with the rule’s central value in the first half of the year. But from the third quarter of 2025, the rule moved up as inflation rose, while the actual rate continued to fall. In the fourth quarter of 2025 and the first quarter of 2026, the gap between the rule’s central value and the actual rate reached about 1.1 to 1.5 percentage points.
In the third quarter of 2026, the rule gives a range of 4.45 to 5.45 percent, with a central value of 4.95 percent. The actual rate of 4.60 percent is within the range, but in its lower half. The rise in unemployment to 4.7 percent in August and September reduces the rule’s prescription, as the unemployment gap becomes positive. This suggests that the rate is now close to an appropriate level, but that a further increase of 25 basis points would not be out of line with a simple rule.
5.4 The productivity problem
Figure 4 decomposes unit labour cost growth.
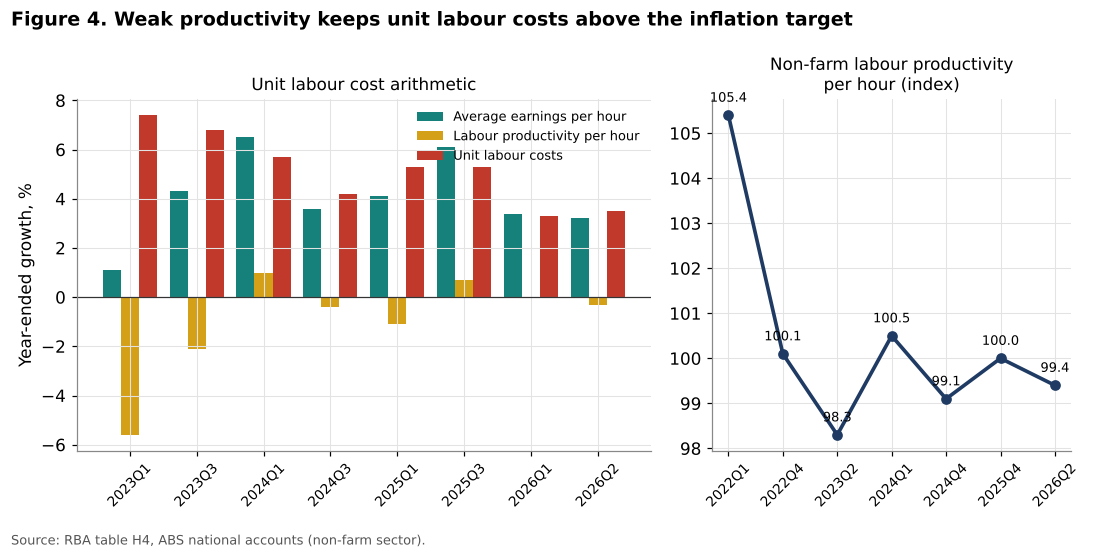
Unit labour costs are the most direct measure of domestic cost pressure. They rise when wages grow faster than productivity. In an economy with an inflation target of 2.5 percent and trend productivity growth of about 1 percent, wage growth of about 3.5 percent is compatible with the target. The problem in Australia is not that wages are growing too fast: the Wage Price Index rose by 3.2 percent over the year to the June quarter of 2026, and average earnings per hour in the non-farm sector by 3.2 percent. The problem is that productivity is not growing at all.
Labour productivity per hour in the non-farm sector fell by 0.3 percent over the year to June 2026, after zero growth in the year to March. The level of productivity is about 5.7 percent lower than in the first quarter of 2022. Part of this fall reflects the unwinding of pandemic composition effects: during lockdowns, low-productivity jobs disappeared temporarily, which artificially raised measured average productivity. But even compared with 2019, productivity has barely increased.
The result is that unit labour costs grew by 3.5 percent over the year to June 2026, compared with about 2.5 percent that would be consistent with the target if profit margins were stable. With trend productivity growth of 1 percent, the same wage growth of 3.2 percent would produce unit labour cost growth of only about 2.2 percent. In 2023, unit labour cost growth was close to 7 percent, because wage growth accelerated while productivity fell sharply. It has slowed since then, but the improvement has come from slower wage growth rather than higher productivity.
This is the main structural finding of the article. Australian inflation is persistent not because the labour market is excessively tight, but because the economy is not becoming more efficient. With zero productivity growth, any positive real wage growth adds to unit labour costs. Monetary policy can slow wage growth by raising unemployment, but it cannot raise productivity. The RBA Governor said as much in her September press conference, describing productivity as a key constraint and noting that productivity policy lies outside the central bank’s remit.
5.5 Labour market and activity
Figure 5 shows the unemployment rate and the growth of real GDP and real GDP per capita.
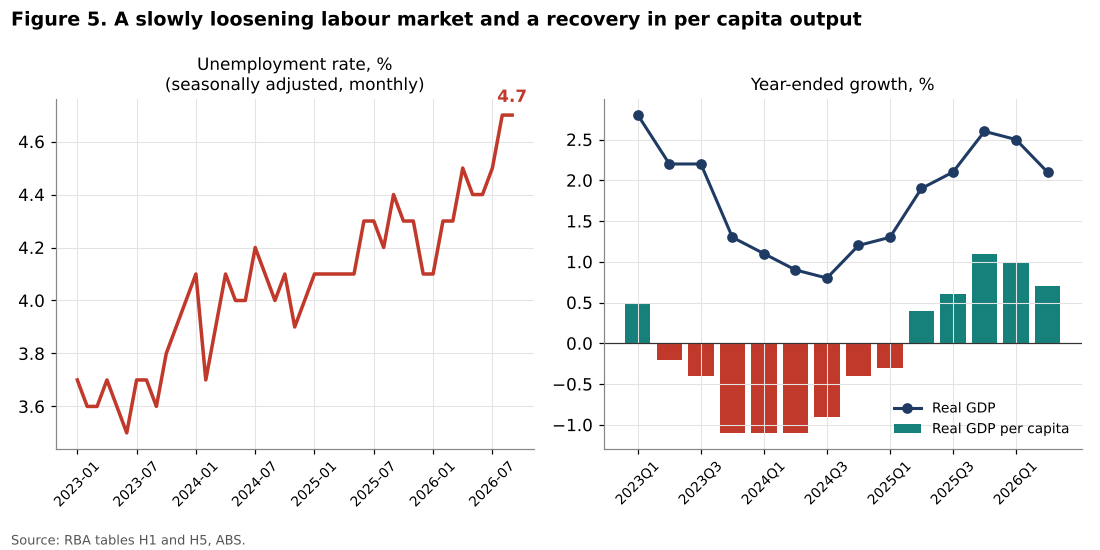
The unemployment rate has risen gradually from about 3.5 percent in mid-2023 to 4.1 percent at the end of 2025 and 4.7 percent in August and September 2026, according to the latest seasonally adjusted data. The Governor noted that more than a million jobs were created over the period of rising unemployment, which reflects strong population growth: the labour force grew faster than employment. The rise in unemployment is therefore a gradual loosening, not a sudden deterioration. The minutes also noted that changes in survey methodology call for caution in interpreting the most recent figures.
Real GDP growth has recovered from a low of 0.8 percent over the year to the third quarter of 2024 to 2.6 percent at the end of 2025, then slowed to 2.1 percent in the June quarter of 2026. Real GDP per capita, a better measure of living standards, fell for eight consecutive quarters on a year-ended basis, from mid-2023 to early 2025, a “per capita recession” driven by population growth that outpaced output. It has since returned to modest positive growth, 0.7 percent over the year to June 2026.
The composition of growth matters. The minutes report that private business investment rose by more than 10 percent over the year, driven in part by investment in data centres linked to the global AI boom, while household consumption slowed to below-trend growth in the first half of 2026. Business credit growth is “very strong and broad-based”. This configuration, strong investment and weak consumption, suggests that the economy is not simply overheating: demand is shifting from households to businesses, partly because of a global investment cycle that monetary policy in Australia cannot control.
5.6 Financial conditions
The cash rate is not the only measure of financial conditions. Australian government bond yields have risen significantly over the past year. The 10-year yield rose from about 4.29 percent in October 2025 to about 5.31 percent in October 2026, an increase of about one percentage point. The 2-year yield rose from 3.55 to 4.92 percent, reflecting market expectations of further rate increases. The minutes note that the rise in global bond yields has been driven mainly by real yields, while long-term inflation expectations remain broadly anchored.
The Australian dollar has appreciated by about 5 percent since the start of the year, to just under 70 US cents, and the RBA judges its real trade-weighted value to be somewhat above its estimated equilibrium range. An appreciation tightens financial conditions by lowering import prices and reducing the competitiveness of exporters. The minutes note that holding rates could have allowed the exchange rate to fall and loosen financial conditions, which was one of the arguments for raising rates.
Equity prices fell by about 5 percent between the August and September meetings. Corporate funding remains readily available, and non-bank lending, including private credit, has grown strongly from a low base.
5.7 The housing market
The housing market is the sector most sensitive to interest rates, and it has reacted quickly. According to the Cotality home value index, national dwelling values fell by 1.1 percent in September 2026, the sixth consecutive monthly decline, and are 5.2 percent below their record high of March 2026. Values in the combined capitals are 1.8 percent lower than a year earlier, while regional values are still 5.6 percent higher.
The adjustment is uneven across cities:
| City | Change over 12 months to September 2026 |
|---|---|
| Darwin | +11.9% |
| Perth | +10.1% |
| National | 0.0% |
| Canberra | -1.6% |
| Melbourne | -6.2% |
| Sydney | -7.0% |
Table 2. Annual change in dwelling values. Source: Cotality Home Value Index, September 2026.
Sydney values are 8.6 percent below their peak earlier in the year. The fall is spreading: values declined over the three months to September in 97 percent of capital city suburbs. Activity has fallen even more than prices: estimated sales volumes in the three months to September were 19.1 percent lower than a year earlier, total listings in the capitals were 23.1 percent higher, and the median time to sell rose from 23 to 39 days.
New housing loan commitments have fallen sharply, led by investors. The RBA expects the wealth effects of falling prices on consumption to be relatively modest, and its stress tests suggest that negative equity would remain rare even with a 20 percent fall in prices. Household debt has fallen relative to income, from 186.8 percent of disposable income in early 2019 to 176 percent in 2025, before rising slightly to 178.4 percent in mid-2026.
The housing correction illustrates the speed of transmission in Australia: four rate increases were enough to reverse a market that had reached a record high in March. It also illustrates a dilemma. Australia has a structural shortage of housing, and a downturn combined with high construction costs could further reduce new building, worsening the shortage in the medium term.
5.8 The cost for borrowers
Figure 6, left panel, shows the effect of the tightening on a typical new mortgage.
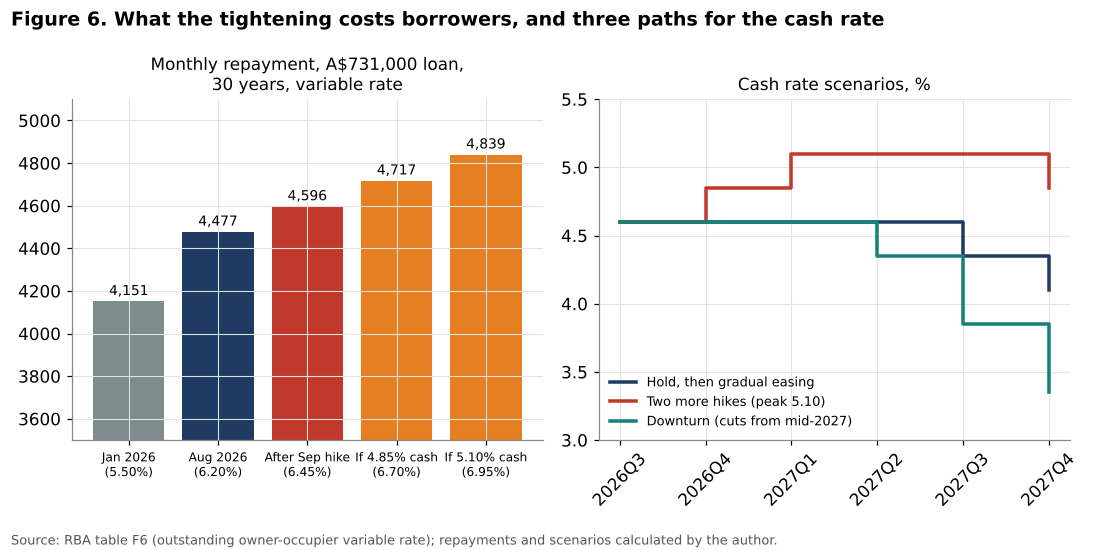
For a principal and interest loan of A$731,000 over 30 years, the monthly repayment was about A$4,151 at the January 2026 average variable rate of 5.50 percent. At the August rate of 6.20 percent, it was A$4,477. After full pass-through of the September increase, at 6.45 percent, it becomes about A$4,596. The four increases of 2026 therefore add about A$446 per month, or more than A$5,300 per year, to the repayment of such a loan. Each additional 25 basis point increase adds about A$120 per month.
These results are consistent with the estimates published by the ACTU at the time of the September decision (about A$110 per month for this increase and A$460 for the four increases combined). Cotality estimated that the four increases have reduced the borrowing capacity of a typical household by almost A$90,000, or about 9 percent, which helps explain the speed of the housing market adjustment.
According to the RBA, scheduled mortgage payments represent about 10 percent of household disposable income, close to the 2024 peak. Less than 2 percent of owner-occupier borrowers are estimated to face a cash flow shortfall, and arrears remain low. The financial system is therefore not under stress, but the burden on indebted households is significant.
6. Discussion
6.1 Was the 2025 easing a mistake?
With hindsight, the 2025 easing appears premature. The RBA cut when underlying inflation was still above the midpoint of the target and before confirming that the decline was durable. The policy rule analysis shows that the gap between the rule and the actual rate opened in the second half of 2025.
However, this judgement must be qualified. At the time, the RBA faced a weakening economy, a per capita recession and rising unemployment. Inflation was within the target band. The new shocks of 2026, notably the oil price surge and the AI-related cost pressures, could not be fully anticipated. And the cuts were small: 75 basis points in total, against 425 basis points of increases in the previous cycle.
The more important lesson is about the nature of inflation. The RBA’s staff analysis in September 2026 concluded that domestic capacity pressures were more important than external shocks. This means that the economy’s supply capacity is lower than previously thought: the level of activity and employment consistent with stable inflation is lower. The main reason is the weakness of productivity.
6.2 The limits of monetary policy
The analysis highlights a fundamental limit of monetary policy in Australia. If productivity does not grow, the only way to bring unit labour cost growth back to a level consistent with the target is to reduce wage growth. And the only way monetary policy can reduce wage growth is to raise unemployment. In other words, without a productivity recovery, the return of inflation to target requires either a deterioration of the labour market or a fall in real wages.
This is a socially costly adjustment. Real wages in Australia have already fallen significantly during the inflation episode of 2022 and 2023, and have only partly recovered. A further period of high rates and rising unemployment would weigh on households who have already absorbed several years of cost of living pressure.
The alternative is a recovery of productivity, through structural reforms (competition, regulation, skills, investment in technology), business investment, and the diffusion of new technologies, including artificial intelligence. The RBA Governor noted that AI could eventually raise productivity, but that the timing was uncertain. In the meantime, the AI boom is adding to demand and costs rather than to supply.
6.3 The external dimension
Australia’s tightening is not isolated. The minutes note that higher energy prices have raised inflation abroad, that central banks have begun to tighten, and that markets expect tightening in most major advanced economies in 2026 and 2027. Global bond yields have risen sharply. If the global neutral rate has risen, the Australian cash rate, which looked restrictive in 2024, may now be less restrictive in relative terms.
At the same time, Australia benefits from the strength of its trading partners in Asia, where the AI boom is boosting growth. Australian exports of critical minerals, examined in a later article in this series, are part of this dynamic. This external strength supports national income but also adds to domestic demand pressures.
6.4 The housing dilemma
The rapid fall in housing prices is a sign that monetary policy is working, but it also raises questions. The RBA judges that the effects on consumption will be modest, and that the financial system is resilient. However, the housing downturn could interact with other negative shocks. And in the medium term, a fall in construction activity would worsen the structural shortage of housing, which contributes to high rents, a significant component of inflation. This issue is explored in detail in the next article in this series, on the Australian housing correction.
6.5 Communication and credibility
The rapid reversal from cuts to increases raises a question of credibility. Some observers have argued that the RBA lost credibility by cutting too early. Others argue that the speed of the reversal demonstrates the RBA’s commitment to the inflation target. The Governor’s statements in September, that the RBA has limited tolerance for entrenched inflation and will raise rates further if needed, were intended to reinforce the anchoring of inflation expectations, which the minutes describe as a key consideration. The fact that firms’ medium-term inflation expectations had drifted higher is a warning sign that the RBA cannot ignore.
7. Scenarios to the end of 2027
7.1 Three paths
Figure 6, right panel, presents three illustrative paths for the cash rate from the third quarter of 2026 to the end of 2027.
Scenario 1: Hold, then gradual easing. Underlying inflation peaks in the second half of 2026 and declines gradually as oil prices stabilise and the housing correction weighs on demand. The RBA holds the cash rate at 4.60 percent until mid-2027, then cuts by 25 basis points in the third quarter and again in the fourth quarter of 2027, to 4.10 percent. This scenario is broadly consistent with the August 2026 forecasts of the RBA, which assumed a peak cash rate of about 4.5 percent and a return of trimmed mean inflation to the midpoint of the target by late 2027.
Scenario 2: Two more increases. The September quarter CPI, published at the end of October, confirms that underlying inflation remains around 3.5 to 3.7 percent. The RBA raises the rate in November 2026 and again in early 2027, to a peak of 5.10 percent, and holds it until late 2027. This scenario corresponds to the expectations priced by bond markets in October 2026, which anticipated two more increases, and to the forecasts of several private sector economists who expected an increase on 3 November 2026. For a typical new mortgage of A$731,000, it would bring the monthly repayment to about A$4,840, almost A$690 more than in January 2026.
Scenario 3: Downturn. The combination of the housing correction, rising unemployment and high energy prices produces a sharper slowdown in consumption. Unemployment rises above 5 percent in 2027. Inflation falls faster than expected. The RBA holds the rate until early 2027, then cuts it by 25 basis points in the second quarter and by 50 basis points in each of the third and fourth quarters, to 3.35 percent at the end of 2027.
7.2 Assessment
On the basis of the evidence presented in this article, the author considers scenario 2 to be the most likely in the short term, for three reasons. First, the policy rule places the appropriate rate around 4.95 percent, above the current level. Second, the decomposition of unit labour costs shows no sign of improvement in productivity, which means that domestic cost pressures will persist. Third, the RBA has explicitly stated its limited tolerance for persistent inflation and its readiness to raise rates further.
However, the downside risks are real. The rise in unemployment to 4.7 percent, the rapid housing correction and the possibility of a further oil price shock that would depress demand more than it raises prices could lead the RBA to stop sooner. The September quarter CPI, due at the end of October 2026, will be decisive.
7.3 Indicators to watch
The author suggests monitoring five indicators:
1. Quarterly trimmed mean inflation, especially for market services. 2. The monthly unemployment rate, with a threshold of about 5 percent beyond which the downside scenario becomes more likely. 3. Non-farm labour productivity per hour and unit labour costs in the quarterly national accounts. 4. The Cotality home value index and new housing loan commitments. 5. Oil prices and the exchange rate of the Australian dollar.
8. Conclusion
The return of monetary tightening in Australia in 2026 is the result of a combination of external shocks and a domestic structural weakness. The external shocks, notably the rise in oil prices linked to the Middle East conflict and the cost pressures of the global AI investment boom, are real but partly temporary. The domestic weakness, the stagnation of productivity, is persistent.
The main conclusions of the analysis are:
1. The 2025 easing came before underlying inflation had durably returned to the midpoint of the target. Trimmed mean inflation rose from 2.7 percent in mid-2025 to 3.6 percent in mid-2026. 2. The real cash rate, at about 1 percentage point, is moderately restrictive and no higher than at the end of 2024. 3. A Taylor-type rule places the appropriate cash rate between 4.45 and 5.45 percent, with a central value of 4.95 percent. The current rate of 4.60 percent is within the range but in its lower half. 4. Labour productivity is about 5.7 percent below its level of early 2022 and has not grown over the past year. With wage growth of about 3.2 percent, unit labour costs are growing at 3.5 percent, above the rate compatible with the target. 5. The four increases of 2026 add about A$446 per month to the repayment of a typical new mortgage of A$731,000. Housing values have fallen by 5.2 percent since March.
Monetary policy can slow demand, but it cannot create supply. As long as Australian productivity does not recover, the RBA will face a difficult trade-off between inflation and employment, and the cash rate is likely to remain high. The structural answer lies outside the central bank: in reforms that raise the economy’s capacity to produce more with the same resources. That question is the subject of a later article in this series.
Need this analysis for your organisation?
We prepare confidential briefings, executive talks and studies on countries, markets and policies, built on the same method as this article.
Request a briefingSupport independent analysis
Our studies are free to read and carry no advertising. If this one was useful, a small contribution helps us publish the next.
Support our workGo further: books by Global Strategy Files


Frequently asked questions
Why did the Reserve Bank of Australia raise rates in 2026?
The RBA raised the cash rate four times in 2026, to 4.60 percent, because underlying inflation rose again from 2.7 percent in mid-2025 to 3.6 percent in mid-2026. Higher oil prices, AI-related cost pressures and weak productivity added to domestic capacity pressures.
How much do the 2026 rate rises cost Australian mortgage holders?
For a typical new mortgage of A$731,000 over 30 years, the four rate increases of 2026 add about A$446 to monthly repayments, or more than A$5,300 a year. Each further 25 basis point increase adds about A$120 a month.
Is Australian monetary policy restrictive in 2026?
Moderately. The real cash rate, the cash rate minus trimmed mean inflation, is about 1 percentage point, similar to the end of 2024. A Taylor-type rule suggests an appropriate rate of 4.45 to 5.45 percent, so the current 4.60 percent sits in the lower half of that range.
Why is productivity a problem for Australian inflation?
Non-farm labour productivity per hour is about 5.7 percent below its early 2022 level and has not grown over the past year. As a result, wage growth of only about 3.2 percent produces unit labour cost growth of 3.5 percent, above what is consistent with the inflation target.
Methodological note
All calculations were carried out by the author using data from the statistical tables of the Reserve Bank of Australia (F1, F2, F6, G1, G4, H1, H4, H5, E2), accessed in October 2026, together with the RBA’s statement, minutes and media conference of 29 September 2026 and the Cotality Home Value Index for September 2026. The real cash rate uses year-ended trimmed mean inflation. The policy rule uses r* of 0.5, 1.0 and 1.5 percent, u* of 4.5 percent and coefficients of 0.5 on the inflation gap and 1.0 on the unemployment gap. Mortgage repayments use the standard annuity formula for a 30-year principal and interest loan of A$731,000. The scenarios are illustrative and do not constitute forecasts or financial advice.
References
Australian Bureau of Statistics (2026). Consumer Price Index, Australia; Monthly Consumer Price Index Indicator; Labour Force, Australia; Wage Price Index, Australia; Australian National Accounts. Canberra.
Wilkins, C., de Brouwer, G. and Fry-McKibbin, R. (2023). Review of the Reserve Bank of Australia: An RBA Fit for the Future. Commonwealth of Australia, Canberra.
Bernanke, B. and Blanchard, O. (2023). What Caused the US Pandemic-Era Inflation? NBER Working Paper 31417.
Clarida, R., Galí, J. and Gertler, M. (1999). The Science of Monetary Policy: A New Keynesian Perspective. Journal of Economic Literature, 37(4), 1661 to 1707.
Cotality (2026). Australian Housing Values Down for Sixth Straight Month in September. Home Value Index, October 2026.
Holston, K., Laubach, T. and Williams, J. C. (2017). Measuring the Natural Rate of Interest: International Trends and Determinants. Journal of International Economics, 108, S59 to S75.
La Cava, G., Hughson, H. and Kaplan, G. (2016). The Household Cash Flow Channel of Monetary Policy. Reserve Bank of Australia Research Discussion Paper 2016-12.
McCririck, R. and Rees, D. (2017). The Neutral Interest Rate. Reserve Bank of Australia Bulletin, September Quarter 2017, 9 to 18.
Orphanides, A. (2003). Historical Monetary Policy Analysis and the Taylor Rule. Journal of Monetary Economics, 50(5), 983 to 1022.
Productivity Commission (2023). 5-year Productivity Inquiry: Advancing Prosperity. Inquiry Report No. 100. Canberra.
Reserve Bank of Australia (2026). Statement by the Monetary Policy Board: Monetary Policy Decision. Media Release, 29 September 2026.
Reserve Bank of Australia (2026). Minutes of the Monetary Policy Meeting of the Monetary Policy Board, 29 September 2026.
Reserve Bank of Australia (2026). Media Conference: Monetary Policy Decision, 29 September 2026.
Reserve Bank of Australia (2026). Statement on Monetary Policy, August 2026.
Reserve Bank of Australia (2026). Statistical Tables F1, F2, F6, G1, G4, H1, H4, H5 and E2. Sydney.
Taylor, J. B. (1993). Discretion versus Policy Rules in Practice. Carnegie-Rochester Conference Series on Public Policy, 39, 195 to 214.
