
Inflation and Purchasing Power in Brazil, 2019 to 2026: What the IBGE Data Really Show


Inflation and Purchasing Power in Brazil, 2019 to 2026: What the IBGE Data Really Show
Driss EFFINA, PhD Independent Researcher, Global Strategy Files Reading time: about 26 minutes
Key takeaways
- Brazil's IPCA rose 0.82 percent in September 2026, bringing twelve month inflation to 4.58 percent, above the 4.5 percent ceiling.
- Consumer prices have risen 50.9 percent since December 2018, so 100 reais now buy what 66.3 reais bought then.
- The minimum wage gained 11.9 percent in real terms since 2019, and real income from work rose 17.4 percent from its 2022 low to 2025.
- The real Selic rate is about 8.8 percent ex post and 9.5 percent ex ante, among the highest in the world.
Abstract
On 9 October 2026, the Brazilian Institute of Geography and Statistics (IBGE) reported that the broad consumer price index (IPCA) rose by 0.82 percent in September 2026, the largest increase for a month of September since 2021, bringing twelve-month inflation to 4.58 percent, just above the 4.5 percent ceiling of the tolerance band around the 3 percent target. This article uses the full monthly IPCA series from January 2019 to September 2026, together with IBGE labour market data from the continuous household survey (PNAD Contínua), the official minimum wage decrees and the Selic rate decisions of the Banco Central do Brasil, to measure how inflation has affected the purchasing power of Brazilian households. The author computes a chained price index, the real value of the minimum wage, the real Selic rate, the frequency of target breaches and three scenarios for the end of 2026. Five results stand out. First, consumer prices have risen by 50.9 percent since December 2018, so that one hundred reais of that date now buy what 66.3 reais bought then. Second, twelve-month inflation has been above the ceiling of the tolerance band in 43 of the 93 months observed and at or below the target in only 18. Third, despite this, the minimum wage has gained 11.9 percent in real terms since 2019, and average real income from work rose by 17.4 percent between its 2022 low and 2025, so that the purchasing power of workers has improved. Fourth, the real Selic rate, at about 8.8 percent ex post and 9.5 percent ex ante, is among the highest in the world, which reflects the difficulty of anchoring expectations. Fifth, on plausible assumptions for the last quarter, inflation would end 2026 between 4.7 and 5.4 percent, above the ceiling in all but the most benign case. The article concludes that Brazil’s problem is less the level of inflation than its persistence above target, which imposes a very high cost in terms of interest rates on the economy.
Keywords: Brazil, inflation, IPCA, purchasing power, minimum wage, real income, Selic, inflation targeting, Banco Central do Brasil
JEL codes: E31, E52, E58, J31, O54
1. Introduction
For a country that experienced hyperinflation until the Real Plan of 1994, inflation is never a purely technical subject. In Brazil, the memory of prices that changed several times a day still shapes household behaviour, wage negotiations and political debate. Since 1999, monetary policy has been organised around an inflation targeting regime, which has kept inflation within single digits in most years. But Brazil has rarely achieved the precise target set by the National Monetary Council, and it has done so at the cost of real interest rates that are among the highest in the world.
The September 2026 figure brought this issue back to the front pages. After a deflation of 0.32 percent in August, caused by a temporary discount on electricity bills funded by the Itaipu hydroelectric plant, prices rose by 0.82 percent in September, as the discount ended and food and fuel prices rose. Twelve-month inflation moved back above the 4.5 percent ceiling of the tolerance band. At the same time, the Banco Central do Brasil had been gradually lowering its policy rate since March 2026, from 15.00 to 13.75 percent, and the market expected further cuts.
This article does not seek to forecast the next monthly figure. Its aim is to place the current situation in a longer perspective, using official IBGE data and the author’s own calculations, and to answer four questions. How much purchasing power has the real lost since 2019? How often has inflation been within the target? Have wages kept up with prices? And how costly, in terms of interest rates, is the fight against inflation?
The article is organised as follows. Section 2 presents the institutional context. Section 3 reviews the literature. Section 4 describes the data and methods. Section 5 presents the results. Section 6 discusses them. Section 7 presents scenarios for the end of 2026. Section 8 concludes.
2. Context
2.1 The inflation targeting regime
Brazil adopted inflation targeting in June 1999, after the devaluation of the real. The National Monetary Council (Conselho Monetário Nacional, CMN) sets the target and the tolerance band, and the Banco Central do Brasil (BCB) uses the Selic rate to achieve it. The reference index is the IPCA, compiled by IBGE, which measures the prices paid by households with incomes of one to forty minimum wages in the main metropolitan areas.
Until 2024, the target applied to calendar years: 4.25 percent in 2019, 4.0 percent in 2020, 3.75 percent in 2021, 3.5 percent in 2022, 3.25 percent in 2023 and 3.0 percent in 2024, each with a tolerance band of 1.5 percentage points on either side. From January 2025, Brazil moved to a “continuous target”: the target of 3.0 percent, with a band from 1.5 to 4.5 percent, applies to twelve-month inflation measured every month. If inflation remains outside the band for six consecutive months, the Governor of the BCB must write an open letter to the Minister of Finance explaining the reasons and the measures to be taken. This mechanism was triggered for the first time in 2025, when twelve-month inflation stayed above 4.5 percent for the first half of the year.
The BCB has been formally autonomous since 2021, with governors appointed for fixed terms that do not coincide with the presidential term.
2.2 Recent monetary policy
After the post-pandemic inflation surge, which brought twelve-month inflation to 12.13 percent in April 2022, the BCB raised the Selic to 13.75 percent in 2022. It began cutting in August 2023, reaching 10.50 percent in 2024, then reversed course as inflation and expectations rose again in the second half of 2024. The Selic was raised to 15.00 percent by June 2025, its highest level in almost twenty years, and kept there until early 2026.
In 2026, the BCB began a gradual easing cycle, cutting the Selic by 25 basis points at each of five meetings: to 14.75 percent in March, 14.50 percent in April, 14.25 percent in June, 14.00 percent in August and 13.75 percent in September. In the minutes of its September meeting, the Monetary Policy Committee (Copom) noted that expectations remained unanchored, that this required restrictive interest rates for longer, and that it saw an upward asymmetry in the balance of risks. Its own reference scenario projected inflation of 5.2 percent for 2026 and 3.9 percent for 2027, with 3.2 percent in the relevant horizon of the first quarter of 2028.
2.3 Incomes and the labour market
The Brazilian labour market has been exceptionally strong since 2022. According to the PNAD Contínua, the annual average unemployment rate fell from 7.8 percent in 2023 to 6.6 percent in 2024 and 5.6 percent in 2025, the lowest since the survey began in 2012. In the quarter to August 2026, unemployment was 5.3 percent. The number of employed people reached a record 103 million in 2025.
The minimum wage, which sets the floor for formal wages and indexes pensions and many social benefits, is adjusted each January under a rule that combines the previous year’s inflation, measured by the INPC, with the real GDP growth of two years earlier, subject to a cap of 2.5 percent in real terms introduced by the fiscal framework. For 2026, it was raised by 6.79 percent to R$1,621.
3. Literature review
The literature relevant to this article can be organised into four strands.
The first deals with the design and performance of Brazilian inflation targeting. Bogdanski, Tombini and Werlang (2000) describe the implementation of the regime in 1999. Minella, de Freitas, Goldfajn and Muinhos (2003) analyse how the BCB built credibility in a context of high exchange rate volatility, and show that inflation expectations became increasingly anchored in the early years of the regime.
The second strand tries to explain why Brazilian real interest rates are so high. Arida, Bacha and Lara-Resende (2005) argue that “jurisdictional uncertainty”, the risk that contracts and the value of savings are not respected, raises the premium required by savers. Segura-Ubiergo (2012), at the IMF, examines several explanations, including low national saving, fiscal dominance concerns, the large share of subsidised credit, which weakens the transmission of monetary policy, and indexation. These explanations remain relevant in 2026.
The third strand concerns the distributional effects of inflation. Easterly and Fischer (2001), using surveys from 38 countries, show that the poor are more likely than the rich to cite inflation as a major concern and that high inflation tends to reduce the income share of the poorest. In Brazil, the Institute for Applied Economic Research (Ipea) publishes a monthly indicator of inflation by income band, which shows that the gap between the inflation faced by low-income and high-income households depends mainly on food and energy prices.
The fourth strand deals with the minimum wage. Engbom and Moser (2022), using Brazilian administrative data, show that the large increases in the real minimum wage between 1996 and 2018 explain a significant part of the fall in earnings inequality in Brazil, with limited effects on employment. This result matters for interpreting the recent real gains of the minimum wage.
This article contributes to the literature by measuring, on the most recent data, the cumulative loss of purchasing power since 2019, the frequency of target breaches, the evolution of real wages and the cost of disinflation in terms of real interest rates.
4. Data and methodology
4.1 Sources
The analysis uses:
- the monthly IPCA series from IBGE, January 2019 to September 2026 (monthly change and twelve-month change);
- the targets and tolerance bands set by the CMN;
- the IBGE September 2026 IPCA release, including the breakdown by group;
- the PNAD Contínua: annual average real usual income from work for 2022, 2024 and 2025, quarterly data for the quarter to August 2025 and 2026, and unemployment rates;
- the presidential decrees setting the minimum wage for each year;
- the Selic target decided by the Copom, and the inflation projections and expectations reported in the minutes of the September 2026 meeting and in the Focus survey.
4.2 Price index
The author chains the monthly IPCA changes into an index with December 2018 = 100. The purchasing power of a sum of money is the inverse of this index.
4.3 Target breaches
For each month, twelve-month inflation is compared with the target and the tolerance band in force for that year. The author counts the months above the ceiling, the months within the band, and the months at or below the target itself.
4.4 Real minimum wage
The nominal minimum wage of each year is deflated to September 2026 prices using the chained IPCA index of the month in which the new value took effect (January in most years, February in 2020 and May in 2023, when the value was raised from R$1,302 to R$1,320). The IPCA is used rather than the INPC for consistency with the rest of the analysis; the difference between the two is small over the period.
4.5 Real Selic rate
The ex post real Selic rate is calculated with the Fisher formula: (1 + Selic) / (1 + twelve-month IPCA) minus 1. The ex ante real rate uses the Copom’s projection of 3.9 percent for 2027 inflation as a proxy for expected inflation over the next year.
4.6 Scenarios
Inflation for 2026 is estimated by combining the observed year-to-date inflation (3.95 percent from January to September) with three assumptions for cumulative inflation in October to December.
4.7 Limitations
The PNAD income series are revised and re-expressed at the prices of the latest period in each release, so values from different releases are not directly comparable; the author only compares values from the same release. The real minimum wage depends on the month chosen for deflation. The scenarios are illustrative.
5. Results
5.1 Seven years of inflation
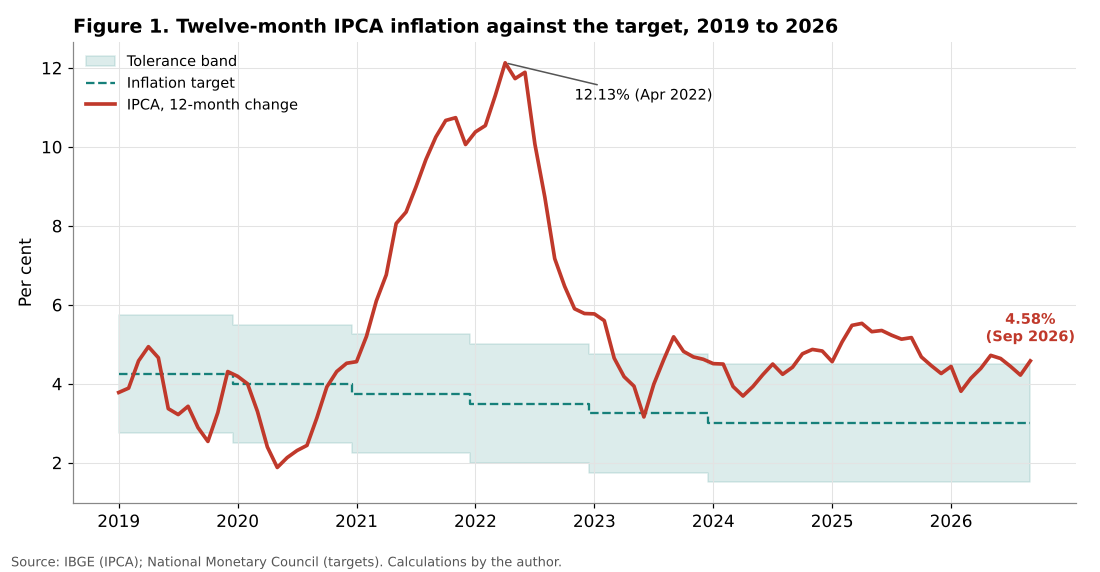
Figure 1 shows twelve-month IPCA inflation from January 2019 to September 2026, compared with the target and tolerance band.
The period can be divided into four phases.
In 2019 and 2020, inflation was moderate and mostly within the band. It fell below the floor in mid-2020, at the height of the pandemic, reaching 1.88 percent in May 2020, as demand collapsed.
From late 2020 to mid-2022, inflation rose sharply, driven by commodity prices, the depreciation of the real, the recovery of demand and, in 2021, a severe drought that raised electricity prices. Twelve-month inflation exceeded 10 percent from September 2021 to July 2022 and peaked at 12.13 percent in April 2022.
In the second half of 2022, inflation fell rapidly, helped by cuts in taxes on fuel, electricity and telecommunications decided before the presidential election. Monthly inflation was negative in July, August and September 2022. Twelve-month inflation fell to 3.16 percent in June 2023.
From 2023 to 2026, inflation has fluctuated between about 3.7 and 5.5 percent, mostly in the upper half of the band or above it. Under the continuous target that has applied since January 2025, twelve-month inflation was above the 4.5 percent ceiling from January to October 2025, and again in May, June and September 2026.
| Year | IPCA (December, 12 months) | Target | Ceiling | Outcome |
|---|---|---|---|---|
| 2019 | 4.31% | 4.25% | 5.75% | Within band |
| 2020 | 4.52% | 4.00% | 5.50% | Within band |
| 2021 | 10.06% | 3.75% | 5.25% | Above ceiling |
| 2022 | 5.78% | 3.50% | 5.00% | Above ceiling |
| 2023 | 4.62% | 3.25% | 4.75% | Within band |
| 2024 | 4.83% | 3.00% | 4.50% | Above ceiling |
| 2025 | 4.26% | 3.00% | 4.50% | Within band (continuous target) |
| 2026 (Sep) | 4.58% | 3.00% | 4.50% | Above ceiling |
Table 1. IPCA inflation and the target. Source: IBGE, CMN.
Over the 93 months from January 2019 to September 2026, twelve-month inflation was above the ceiling of the band in force in 43 months, within the band in 44 months and below the floor in 6 months. It was at or below the central target in only 18 months, almost all of them in 2019, 2020 and mid-2023. In other words, over the past seven years, Brazilian inflation has been closer to the ceiling than to the target.
5.2 The cumulative loss of purchasing power
Figure 2 shows the chained price level and the purchasing power of money.
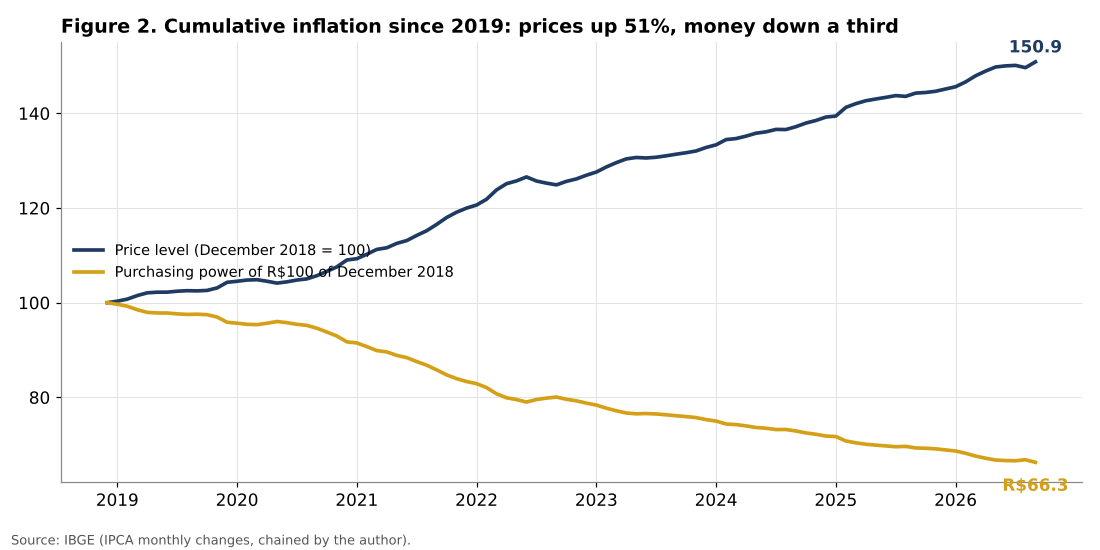
Between December 2018 and September 2026, the IPCA rose by 50.9 percent. A household that held one hundred reais in cash in December 2018 can now buy only what 66.3 reais bought at that time. In other words, money has lost about a third of its value in less than eight years.
This loss is concentrated in 2021 and 2022, when cumulative inflation exceeded 16 percent in two years. But it has continued at a steady pace since: about 4.5 percent per year on average from 2023 to 2025, and 3.95 percent in the first nine months of 2026 alone.
For households, the relevant question is not how much prices rose but whether incomes rose faster. This is the subject of the next section.
5.3 Wages and purchasing power
Figure 3 shows the nominal and real minimum wage and average real income from work.
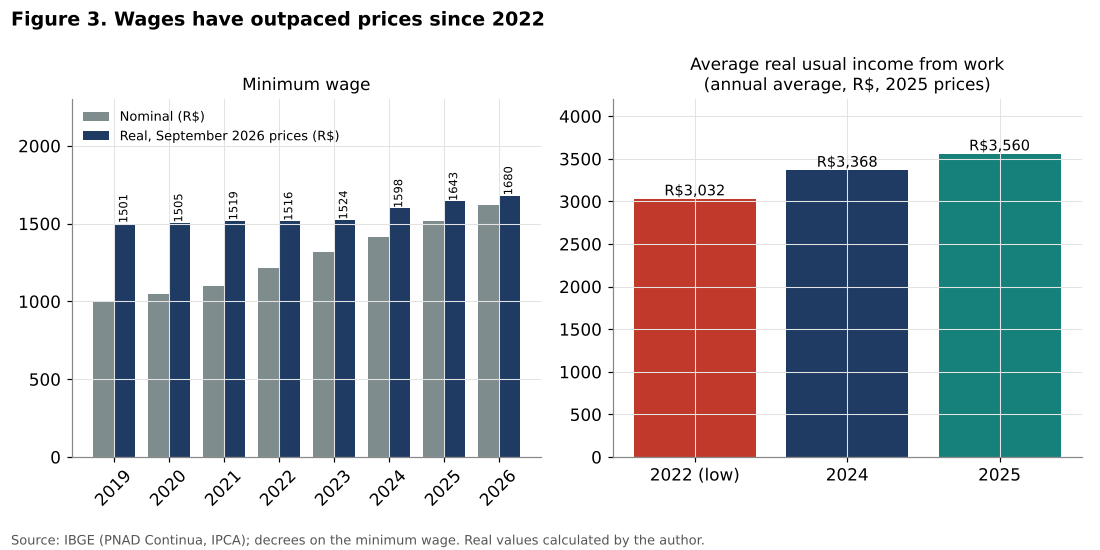
The nominal minimum wage rose from R$998 in 2019 to R$1,621 in 2026, an increase of 62.4 percent. Expressed in September 2026 prices, its real value rose from about R$1,501 in 2019 to R$1,680 in 2026, a real gain of 11.9 percent. The pattern over time is revealing. From 2019 to 2023, the real minimum wage was almost stagnant, rising only from R$1,501 to R$1,524, because adjustments mostly compensated for inflation. Since 2024, when the current rule combining inflation and GDP growth came into force, it has gained about 10 percent in real terms in three years.
| Year | Nominal minimum wage | Real value (September 2026 prices) | Real change |
|---|---|---|---|
| 2019 | R$998 | R$1,501 | |
| 2020 | R$1,045 | R$1,505 | +0.3% |
| 2021 | R$1,100 | R$1,519 | +0.9% |
| 2022 | R$1,212 | R$1,516 | -0.2% |
| 2023 | R$1,320 | R$1,524 | +0.5% |
| 2024 | R$1,412 | R$1,598 | +4.9% |
| 2025 | R$1,518 | R$1,643 | +2.8% |
| 2026 | R$1,621 | R$1,680 | +2.3% |
Table 2. Nominal and real minimum wage. Source: presidential decrees, IBGE; calculations by the author.
The calculation also shows that the purchasing power of the 2026 minimum wage has already been eroded by about 3.8 percent between December 2025 and September 2026. This is the mechanism of inflation for fixed incomes: the annual adjustment restores purchasing power in January, and inflation erodes it month after month until the next adjustment.
Average real income from work tells a similar story. According to the PNAD Contínua, average real usual income was R$3,032 in 2022, the lowest value in the series at 2025 prices, then rose to R$3,368 in 2024 and R$3,560 in 2025, an increase of 5.7 percent in one year and 17.4 percent since 2022. In the quarter to August 2026, average real income was R$3,777 at current prices, 3.7 percent higher in real terms than a year earlier. The total real income from work of all employed people (the “income mass”) reached R$361.7 billion per month on average in 2025, up 7.5 percent, and R$385.6 billion in the quarter to August 2026, up 4.8 percent in real terms year on year.
The conclusion is clear: since 2022, Brazilian workers have regained and then exceeded the purchasing power they had lost during the 2021 to 2022 inflation surge. Strong employment growth, low unemployment and the real increases of the minimum wage explain this result. The inflation of 2023 to 2026, although above target, has not prevented real income growth.
This finding is important for understanding why inflation remains persistent. Real income growth of 4 to 6 percent per year, in an economy whose productivity grows much more slowly, supports demand for services, whose prices are particularly sensitive to labour costs. The strength of the labour market is both good news for households and a source of inflationary pressure.
5.4 The cost of disinflation: real interest rates
Figure 4 shows the ex post real Selic rate at selected dates.
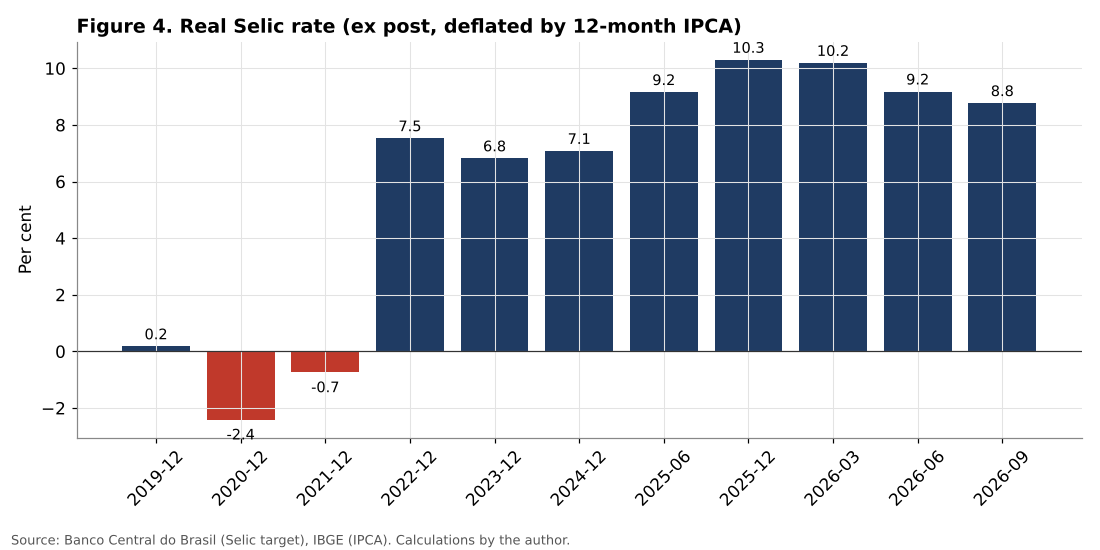
The real Selic was close to zero at the end of 2019 and negative in 2020 and 2021, when the BCB kept rates low to support the economy during the pandemic. It became strongly positive at the end of 2022, at 7.5 percent, and remained around 7 percent in 2023 and 2024. With the Selic at 15 percent and inflation falling in the second half of 2025, the real rate rose to 10.3 percent in December 2025. Despite five cuts in 2026, the ex post real rate was still about 8.8 percent in September 2026. Measured ex ante, using the Copom’s projection of 3.9 percent inflation for 2027, it was about 9.5 percent.
Real interest rates of this level are exceptional. They are higher than in almost all other major emerging economies and several times higher than the estimates of the neutral real rate for Brazil, which most analysts place between 4.5 and 5.5 percent. They imply a very restrictive monetary stance.
The cost of these rates is considerable. Brazilian public debt is largely indexed to the Selic or to inflation, so high real rates directly increase the interest bill of the government. For companies, high rates raise the cost of investment. For households, they raise the cost of consumer credit, whose rates are already among the highest in the world.
Why does the BCB need such high rates? The literature points to several factors. Expectations are poorly anchored: the Focus survey expected inflation of 4.9 percent for 2026 and 4.3 percent for 2027 in September 2026, well above the 3 percent target. Fiscal policy is expansionary, with transfers and the minimum wage rule supporting demand. Part of credit is subsidised or directed, which weakens the transmission of monetary policy. And the economy has a high degree of formal and informal indexation, which spreads past inflation into future prices.
5.5 The September 2026 jump
Figure 5 shows monthly inflation in 2026 and the contributions to the September figure.
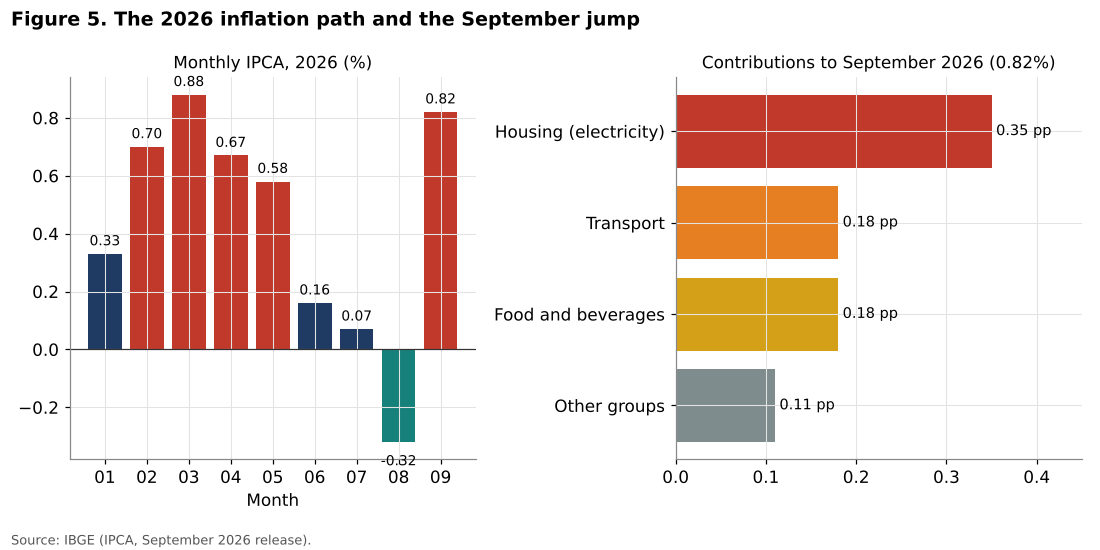
Monthly inflation was high in the first five months of 2026, between 0.33 and 0.88 percent, with peaks in February (0.70 percent, school fees and fuel) and March (0.88 percent). It then slowed sharply in June and July and turned negative in August (-0.32 percent), when consumers received the Itaipu bonus on their electricity bills. In September, the end of this bonus raised residential electricity prices by 7.98 percent, which alone contributed 0.32 percentage points to the monthly index.
Of the 0.82 percent increase in September, the housing group contributed 0.35 points, transport 0.18 points and food and beverages 0.18 points. All nine groups of the IPCA rose. Within food, food at home rose by 0.96 percent, with sharp increases for some fresh products. Within transport, airfares rose by 9.66 percent and fuels by 1.41 percent, including 3.16 percent for ethanol.
The September figure therefore combines a mechanical effect (the end of a one-off electricity discount, which had lowered the August index and was largely reversed in September) with more lasting pressures from food, fuels and services. The INPC, which measures inflation for households with incomes of one to five minimum wages, also rose by 0.82 percent and stood at 4.29 percent over twelve months, slightly below the IPCA.
5.6 Who bears inflation?
The distributional impact of inflation depends on its composition. When food and energy prices rise, low-income households, which spend a larger share of their budget on these items, face higher inflation. When services such as education, health plans or airfares rise, higher-income households are more affected. The Ipea indicator by income band showed, for example, that twelve-month inflation in November 2025 was 4.2 percent for very low-income households against 4.8 percent for high-income households, reflecting a period of falling food prices.
In 2026, the rise in food at home and electricity prices suggests that the gap may have narrowed or reversed. The fact that the INPC, which reflects lower-income households, was 4.29 percent against 4.58 percent for the IPCA in September 2026 indicates that, over twelve months, inflation has still been slightly lower for poorer households.
5.7 Measuring persistence month by month
Twelve-month rates can hide the underlying pace of inflation. To reach a 3 percent annual target, average monthly inflation must not exceed about 0.247 percent. The author counted, for each year since 2023, how many months recorded inflation at or below this threshold, and annualised the average monthly rate.
| Year | Months observed | Months at or below 0.247% | Average monthly rate | Annualised average |
|---|---|---|---|---|
| 2023 | 12 | 5 | 0.378% | 4.63% |
| 2024 | 12 | 3 | 0.394% | 4.83% |
| 2025 | 12 | 5 | 0.349% | 4.27% |
| 2026 (Jan to Sep) | 9 | 3 | 0.432% | 5.31% |
Table 3. Monthly inflation compared with the pace consistent with the 3 percent target. Source: IBGE; calculations by the author.
In none of the last four years did more than five months record inflation compatible with the target. In 2026, only three months out of nine did so, and two of these (July and August) were affected by temporary factors, including the electricity discount. The annualised average pace of the first nine months of 2026, 5.31 percent, is the highest of the four years. Part of this pace reflects the seasonal concentration of price increases in the first quarter, when school fees and many administered prices are adjusted, so it should not be read as a forecast for the full year. But it confirms that the underlying pace of inflation has not been moving towards the target.
Shorter windows give a mixed picture. The annualised rate over the last three months (July to September 2026) was only 2.29 percent, but this figure is depressed by the August deflation. Over six months it was 4.02 percent, and over twelve months 4.58 percent. Excluding the electricity effect, the underlying pace appears to be between 4 and 5 percent per year.
The author also measured the first-order autocorrelation of monthly inflation, a simple indicator of inertia. Over the whole period from 2019 to 2026, the correlation between inflation in one month and in the next month was 0.48, reflecting the long inflationary surge of 2021 and 2022, when high monthly rates followed one another. Since 2023, the autocorrelation has fallen to 0.19. This suggests that month-to-month inertia has weakened considerably, and that the persistence of twelve-month inflation above target now comes less from mechanical indexation than from a steady flow of moderate increases, especially in services and food. In other words, Brazilian inflation is not accelerating by itself; it is settling at a level that is too high.
6. Discussion
6.1 A problem of persistence rather than level
The results show that Brazil’s current inflation problem is not a problem of high inflation in the sense of the 1980s or even of 2021 and 2022. Twelve-month inflation of 4 to 5 percent is moderate by historical standards. The problem is persistence above target. In seven years, inflation has been at or below the target in only 18 months out of 93, and since the continuous target was introduced in 2025, it has been above the ceiling in 13 of 21 months.
This persistence has three consequences. It erodes the credibility of the target and contributes to the deanchoring of expectations noted by the Copom. It requires very high real interest rates to keep inflation from rising further. And it gradually erodes the purchasing power of incomes that are not indexed, notably the savings of the poorest, who hold cash or low-yield accounts.
6.2 The paradox of real income
The paradox of the 2023 to 2026 period is that inflation above target has coexisted with strong real income growth. Workers have, on average, gained purchasing power. This is mainly due to the labour market: record employment, unemployment at historic lows, and real increases of the minimum wage.
However, this paradox is not sustainable indefinitely. Real income growth that exceeds productivity growth raises unit labour costs and feeds services inflation. If monetary policy succeeds in reducing inflation, it will probably do so partly by slowing the labour market. The BCB’s own projections assume a gradual slowdown in activity.
6.3 The fiscal dimension
Brazilian fiscal policy remains a central factor. The minimum wage rule, which indexes a large share of social spending, transfers real income growth to pensioners and beneficiaries of social programmes, supporting demand. The income tax exemption for workers earning up to R$5,000 per month, in force since January 2026, has also increased disposable income. These measures improve purchasing power, but they also add to demand at a time when the BCB is trying to reduce inflation. The combination of expansionary fiscal policy and restrictive monetary policy explains why real interest rates must be so high.
6.4 The role of administered prices
Administered prices, such as electricity, fuel, public transport and health plans, play a large role in Brazilian inflation. They depend on regulatory decisions, international prices and, in the case of electricity, hydrological conditions. The Itaipu bonus of August 2026 illustrates how a regulatory decision can produce a monthly deflation followed by a sharp rebound. Administered prices rose by 1.59 percent in September 2026. Their volatility complicates the reading of inflation and the conduct of monetary policy.
6.5 Implications for policy
Three implications can be drawn.
First, the BCB is right to be cautious in its easing cycle. With inflation above the ceiling and expectations above the target, rapid cuts would risk further deanchoring. The pace of 25 basis points per meeting seems consistent with the data.
Second, a durable reduction of real interest rates requires a fiscal contribution. As long as fiscal policy supports demand and public debt grows, the BCB will need to maintain high real rates.
Third, the protection of purchasing power for the poorest depends on the minimum wage rule and social transfers. These mechanisms have worked since 2023. But their cost and their effect on inflation should be considered together.
6.6 Lessons from the continuous target
The continuous target introduced in 2025 was meant to give the BCB more flexibility, by abandoning the artificial calendar year deadline and focusing on a horizon of about eighteen months. Its first two years offer a mixed record. On the one hand, the regime has worked as designed in terms of accountability: the open letter of 2025 explained the reasons for the breach and the measures taken, and the Copom has consistently communicated its projections for the relevant horizon. On the other hand, twelve-month inflation has spent most of the period above the ceiling, which shows that a change in the formal framework does not by itself change the behaviour of prices or expectations.
The experience suggests that the credibility of the target depends less on its technical design than on the coherence between monetary and fiscal policy. As long as markets doubt the trajectory of public debt, expectations will remain above the target, and the BCB will have to compensate with higher real rates. A credible fiscal anchor would reduce the real interest rate needed to keep inflation at 3 percent, which would in turn reduce the interest bill of the state. This virtuous circle is the main lever available to Brazilian policymakers.
7. Scenarios for the end of 2026
7.1 Method
Inflation from January to September 2026 was 3.95 percent. The final figure for 2026 depends on inflation in October, November and December. For reference, inflation in these three months was 0.60 percent in 2025, when electricity and food prices were falling.
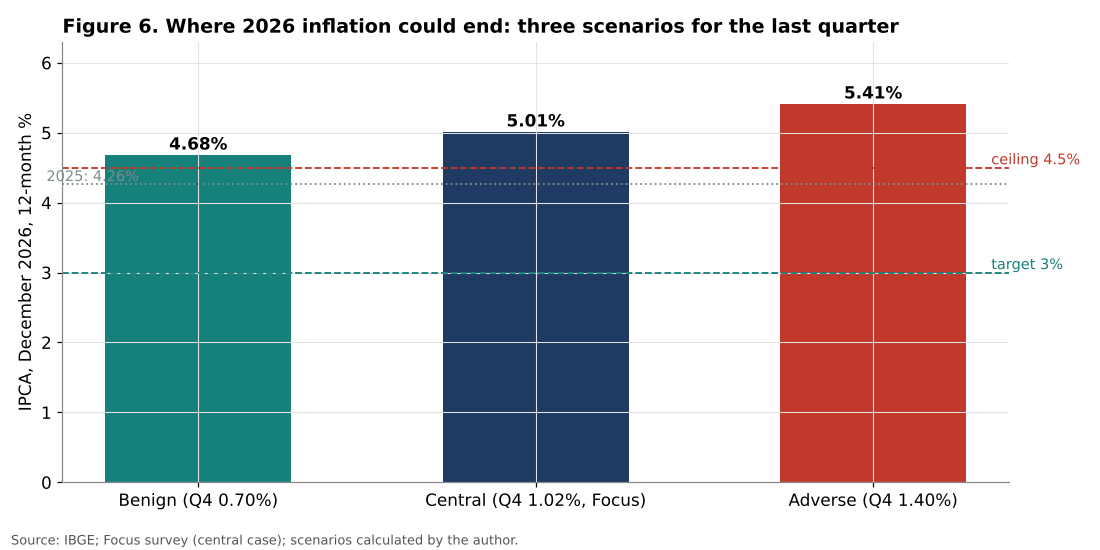
The author considers three scenarios for cumulative inflation in the last quarter:
- Benign scenario (0.70 percent): food prices stabilise, fuel prices are unchanged and electricity tariffs move to a lower cost flag. Inflation for 2026 would be about 4.68 percent.
- Central scenario (1.02 percent): consistent with the Focus survey median of 5.01 percent for 2026 in early October. Inflation for 2026 would be 5.01 percent.
- Adverse scenario (1.40 percent): food and fuel prices continue to rise and the real depreciates. Inflation for 2026 would be about 5.41 percent.
7.2 Interpretation
In all three scenarios, inflation for 2026 would be above the 2025 figure of 4.26 percent and above the 4.5 percent ceiling. Even the benign scenario implies a figure of about 4.7 percent. This means that, under the continuous target, twelve-month inflation would probably remain above the ceiling for the last months of 2026, and that a new open letter from the BCB Governor could become necessary in early 2027 if the breach lasts six consecutive months.
For monetary policy, these scenarios argue for a continued but cautious easing. The market expected a cut of 25 basis points at the Copom meeting of 4 November 2026. In the adverse scenario, the BCB could pause its easing cycle.
For households, the scenarios imply a further erosion of the purchasing power of the minimum wage before the January 2027 adjustment, of about 4.7 to 5.4 percent over the year. The INPC for the twelve months to November 2026 will determine the inflation component of the 2027 adjustment.
7.3 Indicators to monitor
The author suggests monitoring:
1. The monthly IPCA and the services and food at home components. 2. Electricity tariff flags set by the regulator ANEEL. 3. Fuel prices set by Petrobras. 4. Inflation expectations in the Focus survey for 2026, 2027 and 2028. 5. Average real income and unemployment in the PNAD Contínua.
8. Conclusion
This article has measured the evolution of inflation and purchasing power in Brazil between 2019 and 2026 using official IBGE data and the author’s own calculations. The main conclusions are:
1. Consumer prices have risen by 50.9 percent since December 2018. One hundred reais of that date are worth 66.3 reais today. 2. Inflation has been above the ceiling of the tolerance band in 43 of 93 months, and at or below the target in only 18. 3. Despite this, workers have gained purchasing power: the real minimum wage has risen by 11.9 percent since 2019, and average real income from work by 17.4 percent since 2022. 4. The cost of fighting inflation is very high: the real Selic rate is about 8.8 percent ex post and 9.5 percent ex ante. 5. In plausible scenarios, inflation for 2026 will end between 4.7 and 5.4 percent, above the ceiling of the target.
The Brazilian situation therefore combines good news and a structural weakness. The good news is that the labour market and the minimum wage policy have protected and improved the purchasing power of workers. The weakness is that inflation remains persistently above target, which forces the central bank to maintain real interest rates that weigh on investment, public finances and credit. Breaking this equilibrium requires better anchored expectations, which in turn depends on a more credible fiscal trajectory.
Need this analysis for your organisation?
We prepare confidential briefings, executive talks and studies on countries, markets and policies, built on the same method as this article.
Request a briefingSupport independent analysis
Our studies are free to read and carry no advertising. If this one was useful, a small contribution helps us publish the next.
Support our workGo further: books by Global Strategy Files

Frequently asked questions
What is inflation in Brazil in 2026?
Twelve month IPCA inflation reached 4.58 percent in September 2026, just above the 4.5 percent ceiling of the tolerance band around the 3 percent target, after prices rose 0.82 percent in the month, the largest September increase since 2021.
How much purchasing power has the Brazilian real lost since 2019?
Consumer prices in Brazil have risen by 50.9 percent since December 2018. As a result, 100 reais of that date now buy only what 66.3 reais bought then, although wages and the minimum wage have risen faster than prices.
Have Brazilian workers lost purchasing power to inflation?
No, on average they have gained. The minimum wage rose 11.9 percent in real terms since 2019, and average real income from work increased 17.4 percent between its 2022 low and 2025, despite inflation above the target ceiling in 43 of 93 months.
Where will Brazilian inflation end 2026?
On plausible assumptions for the last quarter, Brazilian inflation would end 2026 between 4.7 and 5.4 percent, above the 4.5 percent ceiling of the tolerance band in all but the most benign scenario. The problem is less the level of inflation than its persistence above target, which keeps real interest rates very high.
Methodological note
All calculations were carried out by the author from official data. The monthly IPCA series (January 2019 to September 2026) is from IBGE. The price index chains the monthly changes from December 2018 = 100. Target breaches are measured against the target and tolerance band in force in each year. The real minimum wage is calculated by deflating the nominal value with the IPCA index of the month in which the value took effect. The real Selic uses the Fisher formula. Average income data are from the PNAD Contínua releases of February 2026 and September 2026 and are only compared within the same release. The scenarios combine year-to-date inflation with assumptions for the last quarter.
References
Arida, P., Bacha, E. L. and Lara-Resende, A. (2005). Credit, Interest, and Jurisdictional Uncertainty: Conjectures on the Case of Brazil. In F. Giavazzi, I. Goldfajn and S. Herrera (eds.), Inflation Targeting, Debt, and the Brazilian Experience, 1999 to 2003. MIT Press.
Banco Central do Brasil (2026). Ata da 281ª Reunião do Comitê de Política Monetária (Copom). September 2026.
Bogdanski, J., Tombini, A. A. and Werlang, S. R. C. (2000). Implementing Inflation Targeting in Brazil. Banco Central do Brasil Working Paper Series No. 1.
Easterly, W. and Fischer, S. (2001). Inflation and the Poor. Journal of Money, Credit and Banking, 33(2), 160 to 178.
Engbom, N. and Moser, C. (2022). Earnings Inequality and the Minimum Wage: Evidence from Brazil. American Economic Review, 112(12), 3803 to 3847.
IBGE (2026). Índice Nacional de Preços ao Consumidor Amplo (IPCA), séries históricas e release de setembro de 2026. Rio de Janeiro.
IBGE (2026). Pesquisa Nacional por Amostra de Domicílios Contínua: releases of February 2026 (annual 2025) and September 2026 (quarter to August). Rio de Janeiro.
Ipea (2025). Inflação por faixa de renda, November 2025. Carta de Conjuntura. Brasília.
Minella, A., de Freitas, P. S., Goldfajn, I. and Muinhos, M. K. (2003). Inflation Targeting in Brazil: Constructing Credibility under Exchange Rate Volatility. Journal of International Money and Finance, 22(7), 1015 to 1040.
Presidência da República (2025). Decreto nº 12.797, que fixa o salário mínimo para 2026. Brasília.
Segura-Ubiergo, A. (2012). The Puzzle of Brazil’s High Interest Rates. IMF Working Paper WP/12/62. International Monetary Fund.
