
India’s Energy Dependence in 2026: Measuring the Cost of the Oil Shock and the Limits of the Transition

India’s Energy Dependence in 2026: Measuring the Cost of the Oil Shock and the Limits of the Transition
Driss EFFINA, PhD Independent Researcher, Global Strategy Files Reading time: about 26 minutes
Key takeaways
- India's crude oil import dependence rose from 83.8 percent in 2018-19 to 88.2 percent in 2024-25, far from the 67 percent official objective.
- About 44 percent of India's primary energy supply is imported once oil, gas and coal import shares are applied.
- Between April and August 2026 India paid 48 percent more for slightly less crude, as unit value rose from about US$68 to US$101 per barrel.
- Each US$10 per barrel rise in oil prices adds about US$18 billion, or 0.4 percent of GDP, to India's annual import bill.
Abstract
The conflict in the Middle East has made energy security the main external vulnerability of the Indian economy in 2026. The OECD’s Economic Outlook of June 2026 noted that energy and key inputs from the Persian Gulf had become much more expensive since February and placed energy security among the medium-term priorities for policy. India, the world’s third largest consumer of oil, imports almost nine tenths of its crude oil. This article measures India’s energy dependence and the cost of the 2026 oil shock, using data from the Petroleum Planning and Analysis Cell (PPAC), the Ministry of Statistics and Programme Implementation (MoSPI) report Energy Statistics India 2026, trade data on crude oil sources, and IMF and OECD assessments. The author computes the share of primary energy that is imported, the weight of the crude oil import bill in GDP, the unit value of imported crude, the concentration of supply sources, and the import bill in 2026-27 under three price scenarios. Five results stand out. First, crude oil import dependence rose from 83.8 percent in 2018-19 to 88.2 percent in 2024-25 and about 88 to 89 percent in 2025-26 and 2026-27, far from the official objective of 67 percent set for 2022. Second, about 44 percent of India’s primary energy supply is imported, once the import shares of oil (89 percent), gas (50 percent) and coal (24 percent) are applied to the energy mix. Third, between April and August 2026, India imported slightly less crude than a year earlier but paid 48 percent more, as the average unit value rose from about US$68 to about US$101 per barrel. Fourth, each increase of US$10 per barrel in the oil price adds about US$18 billion, or 0.4 percent of GDP, to the annual import bill. Fifth, renewable power capacity has increased more than fourfold in ten years, but the transition has so far reduced dependence on imported coal for power rather than dependence on imported oil, which is concentrated in transport and industry. The article concludes that India’s energy dependence will remain high for at least a decade, and that the priority is to reduce its macroeconomic cost through diversification, strategic reserves, efficiency and the electrification of transport.
Keywords: India, energy security, oil imports, import dependence, terms of trade, current account, energy transition, renewable energy, OECD
JEL codes: Q41, Q43, F14, F32, O53, Q48
1. Introduction
Energy is the Achilles’ heel of the Indian economy. India has large coal reserves, but limited oil and gas resources. As its economy has grown, its consumption of oil has increased much faster than domestic production, which has been declining for more than a decade. The result is a growing dependence on imports, which exposes India to the volatility of international oil prices and to geopolitical disruptions in producing regions, particularly the Persian Gulf.
In 2026, this vulnerability has become acute. The escalation of the conflict in the Middle East has raised oil prices sharply. The IMF’s World Economic Outlook of October 2026 assumes an average oil price of about US$96 per barrel in 2026, against about US$68 in 2025. The OECD Economic Outlook of June 2026 described two scenarios: one in which Gulf energy production recovers from the third quarter of 2026, and one in which supply constraints last into the second half of 2027, with weaker growth and substantially higher inflation.
For India, the consequences are already visible in the data. The crude oil import bill rose by 48 percent in the first five months of the fiscal year 2026-27. Consumer price inflation rose to 4.8 percent in August 2026, and the Reserve Bank of India raised its policy rate in October. The IMF projects that India’s current account deficit will widen from 0.7 percent of GDP in 2025 to 1.5 percent in 2026.
This article measures India’s energy dependence and the cost of the 2026 oil shock. It asks four questions. How dependent is India on imported energy, and how has this dependence evolved? How much does oil cost the economy? How diversified are India’s sources of supply? And what does the energy transition change?
Section 2 sets out the context. Section 3 reviews the literature. Section 4 describes the data and methods. Section 5 presents the results. Section 6 discusses them. Section 7 presents scenarios. Section 8 concludes.
2. Context
2.1 India’s energy system
According to MoSPI’s Energy Statistics India 2026, India’s total primary energy supply reached about 933,000 thousand tonnes of oil equivalent in 2024-25, up about 3 percent from the previous year. Coal (including lignite) accounted for 59.2 percent, crude oil for 29.8 percent and natural gas for 7.1 percent, while nuclear, hydro and other renewables accounted for the remaining 3.9 percent on the accounting basis used by MoSPI. Per capita energy consumption rose from 15,296 megajoules in 2015-16 to 18,096 megajoules in 2024-25, and per capita electricity consumption from 780 to 1,153 kilowatt hours.
The structure of energy use explains the structure of dependence. Coal is used mainly in power generation and heavy industry. Oil is used mainly in transport, petrochemicals and as liquefied petroleum gas (LPG) for cooking. Natural gas is used in fertilisers, power, city gas and industry. India’s coal is mostly domestic, but its oil and, to a lesser extent, its gas are imported.
2.2 Policy objectives
In 2015, the government set an objective of reducing oil import dependence from about 77 percent to 67 percent by 2022. This objective was not achieved: dependence continued to rise. Since then, energy policy has focused on expanding renewable power, increasing domestic gas production, promoting ethanol blending in petrol, developing electric mobility and building strategic petroleum reserves. In its updated Nationally Determined Contribution of 2022, India committed to reaching 50 percent of installed electric power capacity from non-fossil sources by 2030, a target that BloombergNEF reports was crossed in 2025.
2.3 The 2026 shock and the policy response
The 2026 disruption in the Gulf led the government to take a series of emergency measures. According to official announcements compiled by India Briefing, these included a Natural Gas Control Order in March 2026 to prioritise supplies to households and transport, a temporary exemption of customs duties on certain petrochemical products, an increase in domestic LPG production, the approval of about 300 billion rupees to offset losses on LPG sales, and the round-the-clock monitoring of petroleum stocks and of Indian-flagged vessels in the Gulf.
2.4 The OECD perspective
The OECD has repeatedly emphasised energy security as a structural issue for India. Its Economic Surveys of India have highlighted the fiscal cost of energy subsidies, the need to price energy to reflect costs, and the importance of the energy transition for both climate and macroeconomic stability. In its June 2026 Economic Outlook, the OECD placed energy security, alongside fiscal sustainability and the reduction of trade tensions, among the medium-term priorities for policymakers worldwide, in a context where the Gulf disruption had become the main global supply shock.
3. Literature review
The literature on oil and the macroeconomy has three strands relevant to India.
The first concerns the macroeconomic effects of oil price shocks. Hamilton (1983) showed that most US recessions after the Second World War had been preceded by oil price increases. Later work, including Kilian (2009), emphasised that the effects of oil price changes depend on their cause: supply shocks have different effects from demand-driven price increases. For oil-importing emerging economies, the main channels are the terms of trade, the current account, inflation and public finances, through subsidies or reduced fuel taxes.
The second strand concerns India specifically. Sensitivity analyses published by the Reserve Bank of India in its Monetary Policy Reports have suggested that a 10 percent increase in crude oil prices could raise consumer price inflation by about 0.3 percentage point and lower growth by about 0.15 point, depending on the degree of pass-through to retail prices. A simple calculation on the 2024-25 import bill shows that the same increase would widen the current account deficit by about 0.35 to 0.4 percent of GDP. The pass-through has varied over time because the government has at times absorbed price increases through lower excise duties or compensation to state-owned oil companies.
The third strand concerns energy security and the energy transition. The International Energy Agency, in its report on the Indian oil market to 2030 (IEA, 2024), projected that India would become the largest source of growth in global oil demand during this decade, driven by transport, petrochemicals and LPG. At the same time, studies of the energy transition, including the OECD Economic Surveys and the work of BloombergNEF, document the rapid growth of renewable power in India. The intersection of these two trends, rising oil demand and rapid growth of renewable electricity, defines the energy security challenge: renewables reduce the need for coal and gas in power generation, but they do not directly reduce the need for imported oil unless transport is electrified.
The present article contributes to this literature by measuring the overall share of imported primary energy, the cost of the 2026 oil shock using monthly trade data, and the sensitivity of the import bill to oil prices under explicit scenarios.
4. Data and methodology
4.1 Data
The data come from:
- PPAC data on crude oil import dependence, import volumes, import bills and domestic production, as reported in official releases and the press for the fiscal years 2018-19 to 2026-27;
- MoSPI, Energy Statistics India 2026, for the primary energy mix, import dependence by fuel in 2024-25, installed electricity capacity and per capita consumption;
- trade data on the value of crude oil imports by source country for April to January of 2024-25 and 2025-26;
- GDP data from the IMF International Financial Statistics (via FRED) and MoSPI;
- IMF and OECD Economic Outlooks for price assumptions and macroeconomic context.
4.2 Indicators
The author computes:
1. The share of imported primary energy, by multiplying the share of each fuel in primary energy supply by its import dependence and summing the results. 2. The crude oil import bill in percent of GDP, by converting nominal GDP in rupees into US dollars at approximate average annual exchange rates. 3. The average unit value of imported crude, by dividing the import bill by the volume imported, converted at 7.33 barrels per tonne. 4. The concentration of supply, measured by the shares of the main supplying countries and by the combined share of Gulf producers. 5. The import bill under three price scenarios for 2026-27, assuming imports of 245 million tonnes, nominal GDP growth of 10 percent and an exchange rate of 90 rupees per US dollar.
4.3 Limitations
The PPAC import bills cited for different years may differ slightly according to the source and the coverage (crude only or crude and products). Exchange rate conversions are approximate. The energy mix uses MoSPI’s accounting conventions, which assign a relatively small weight to primary electricity from hydro, nuclear and renewables. The scenarios are illustrative and do not account for the effect of prices on demand.
5. Results
5.1 The rise of import dependence
Figure 1 shows crude oil import dependence since 2018-19.
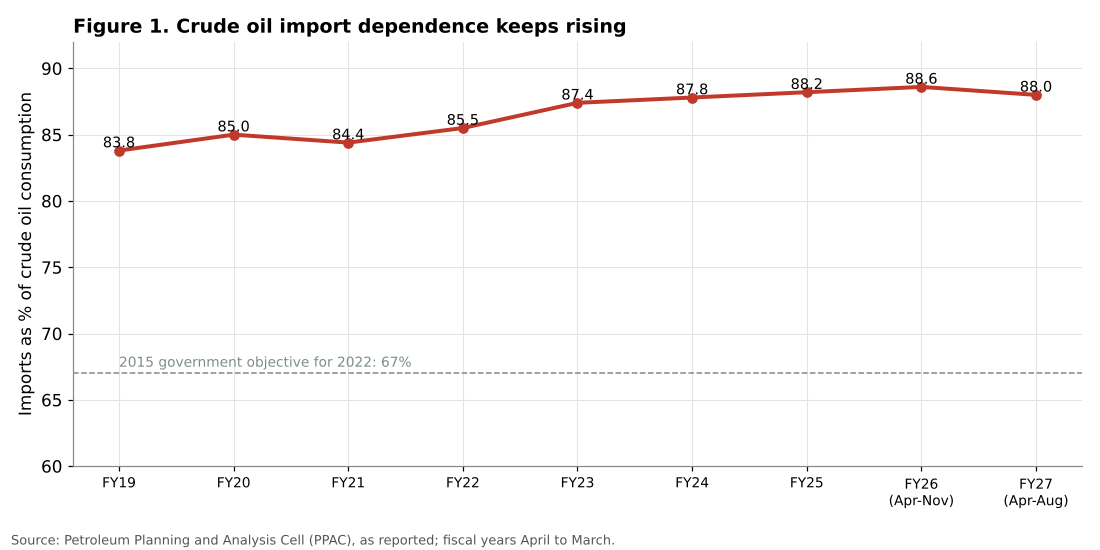
India’s dependence on imported crude oil rose from 83.8 percent in 2018-19 to 85.0 percent in 2019-20. After a slight dip in 2020-21 (84.4 percent), when the pandemic reduced demand, it rose steadily to 85.5 percent in 2021-22, 87.4 percent in 2022-23, 87.8 percent in 2023-24 and 88.2 percent in 2024-25. In the first eight months of 2025-26, it reached 88.6 percent, and in the first five months of 2026-27, about 88 percent.
The cause is simple: consumption grows while domestic production declines. Domestic crude production was 34.2 million tonnes in 2018-19 and only 28.7 million tonnes in 2024-25. In April to August 2026, it fell further, to 11.4 million tonnes, against 11.9 million a year earlier. Meanwhile, consumption of petroleum products reached a record of about 242 million tonnes in 2024-25.
The objective set in 2015, to reduce dependence to 67 percent by 2022, has therefore moved further away rather than closer. Dependence is now about 21 percentage points above that objective. In energy terms, India produces only about one barrel of crude oil for every eight it consumes.
5.2 The cost of oil
Figure 2 shows the crude oil import bill and its weight in GDP.
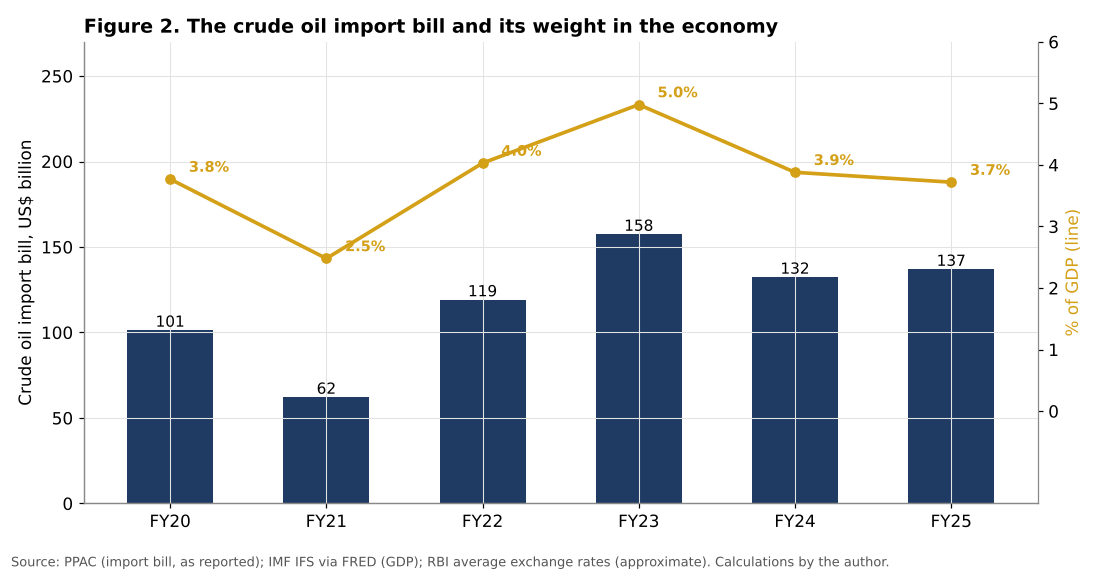
The crude oil import bill was US$101.4 billion in 2019-20. It fell to US$62.2 billion in 2020-21, when prices and demand collapsed during the pandemic, then rose to US$119.2 billion in 2021-22 and a record US$157.5 billion in 2022-23, after the invasion of Ukraine raised oil prices. It fell to US$132.4 billion in 2023-24, helped by discounted Russian crude, and was US$137.0 billion in 2024-25.
As a share of GDP, the bill ranged between 2.5 percent (2020-21) and 5.0 percent (2022-23), and was about 3.7 percent in 2024-25. These figures represent a significant drain on national income: in 2024-25, India spent on crude oil imports about as much as it earned from about two thirds of its software services exports.
| Fiscal year | Import bill (US$ bn) | Import dependence (%) | Bill, % of GDP |
|---|---|---|---|
| 2019-20 | 101.4 | 85.0 | 3.8 |
| 2020-21 | 62.2 | 84.4 | 2.5 |
| 2021-22 | 119.2 | 85.5 | 4.0 |
| 2022-23 | 157.5 | 87.4 | 5.0 |
| 2023-24 | 132.4 | 87.8 | 3.9 |
| 2024-25 | 137.0 | 88.2 | 3.7 |
Table 1. Crude oil imports. Source: PPAC as reported; GDP ratios calculated by the author.
5.3 The 2026 shock
Figure 3 compares crude oil imports in April to August 2026 with the same period of 2025.
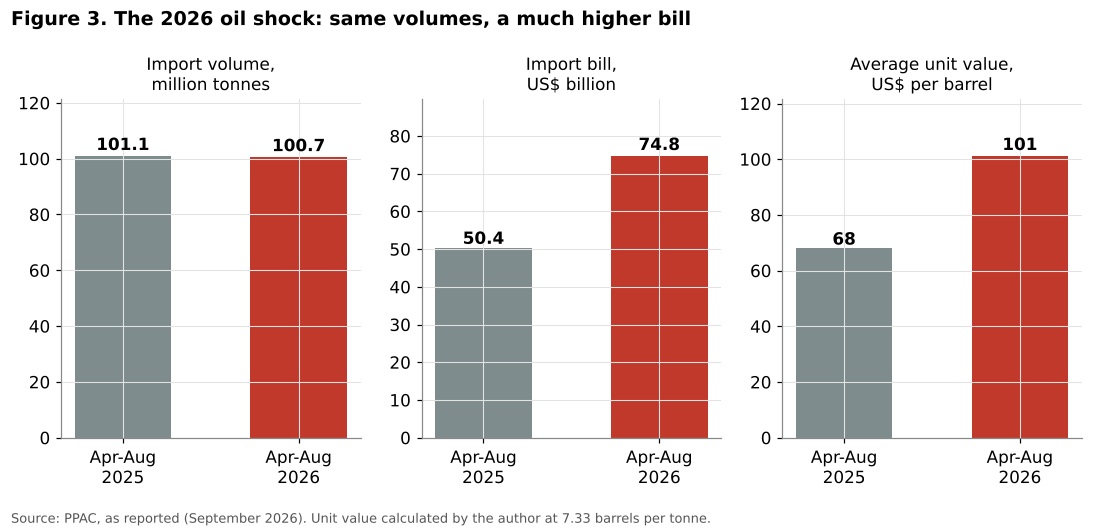
The volume of crude oil imports was almost unchanged: 100.7 million tonnes in April to August 2026, against 101.1 million tonnes a year earlier. But the import bill rose from US$50.4 billion to US$74.8 billion, an increase of 48.4 percent. The author’s calculation of the average unit value shows an increase from about US$68 per barrel to about US$101 per barrel, including freight and insurance. The Indian basket price, a reference price for crude processed in India, was US$90.19 per barrel in August 2026, against US$69.11 a year earlier.
In the first quarter of 2026-27 alone, the crude import bill reached a record of about US$49.7 billion, 61 percent higher than a year earlier, as prices spiked during the most acute phase of the Gulf disruption.
The shock has also affected consumption. Total consumption of petroleum products fell by 3.9 percent in April to August 2026, to 96.2 million tonnes. LPG consumption fell by 16.8 percent, reflecting supply constraints and rationing measures, such as the increase of the minimum interval between cylinder bookings. By contrast, consumption of diesel rose by 4.8 percent and petrol by 7.0 percent, showing that transport demand remains strong even at higher prices.
Natural gas shows a different pattern: domestic production rose by 20 percent, while LNG imports rose by 31 percent. The government’s efforts to increase domestic gas output have therefore had some success, but imports remain essential.
5.4 How much of India’s energy is imported?
Figure 4 shows the primary energy mix and the share that is imported, together with the evolution of installed electricity capacity.
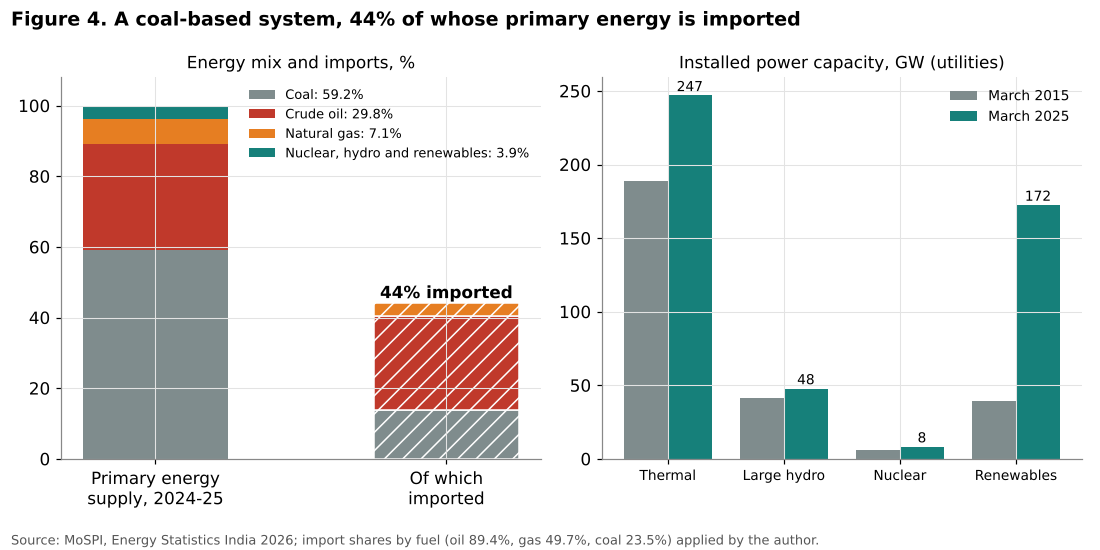
Applying the import dependence of each fuel to its share in primary energy supply, the author finds that about 44 percent of India’s primary energy was imported in 2024-25: about 26.6 percentage points from crude oil, 13.9 points from coal and 3.5 points from natural gas.
| Fuel | Share of primary energy supply (%) | Import dependence (%) | Imported share of total supply (points) |
|---|---|---|---|
| Coal and lignite | 59.2 | 23.5 | 13.9 |
| Crude oil | 29.8 | 89.4 | 26.6 |
| Natural gas | 7.1 | 49.7 | 3.5 |
| Nuclear, hydro and renewables | 3.9 | n.a. | n.a. |
| Total | 100 | 44.0 |
Table 2. Primary energy supply and imports, 2024-25. Source: MoSPI, Energy Statistics India 2026; calculations by the author.
This calculation shows that oil accounts for about 60 percent of India’s energy import dependence, although it represents only 30 percent of primary energy supply. Coal, despite being mostly domestic, still contributes significantly, because India imports high-quality coal for steel making and some power plants. Net coal imports were 241.7 million tonnes in 2024-25, down 8.1 percent from the previous year, while domestic coal production rose to 1,047.5 million tonnes.
The right panel of Figure 4 shows the rapid growth of renewable power. Installed renewable capacity (excluding large hydro) rose from 39.0 gigawatts in March 2015 to 172.4 gigawatts in March 2025, a multiplication by 4.4. Including large hydro and nuclear, non-fossil sources represented about 48 percent of utility capacity in March 2025, against 31 percent in 2015. BloombergNEF reports that the non-fossil share of capacity crossed 50 percent in 2025, and that India was the second largest market for solar and wind additions in the world, after China.
However, coal still supplies about 68 percent of India’s electricity, because coal plants run much more of the time than solar and wind installations. And more importantly for energy security, the growth of renewable electricity reduces the need for coal and gas in power generation but does not directly reduce the need for oil, which is used mainly in transport.
5.5 Sources of supply
Figure 5 shows the shares of the main supplying countries in the value of India’s crude oil imports.
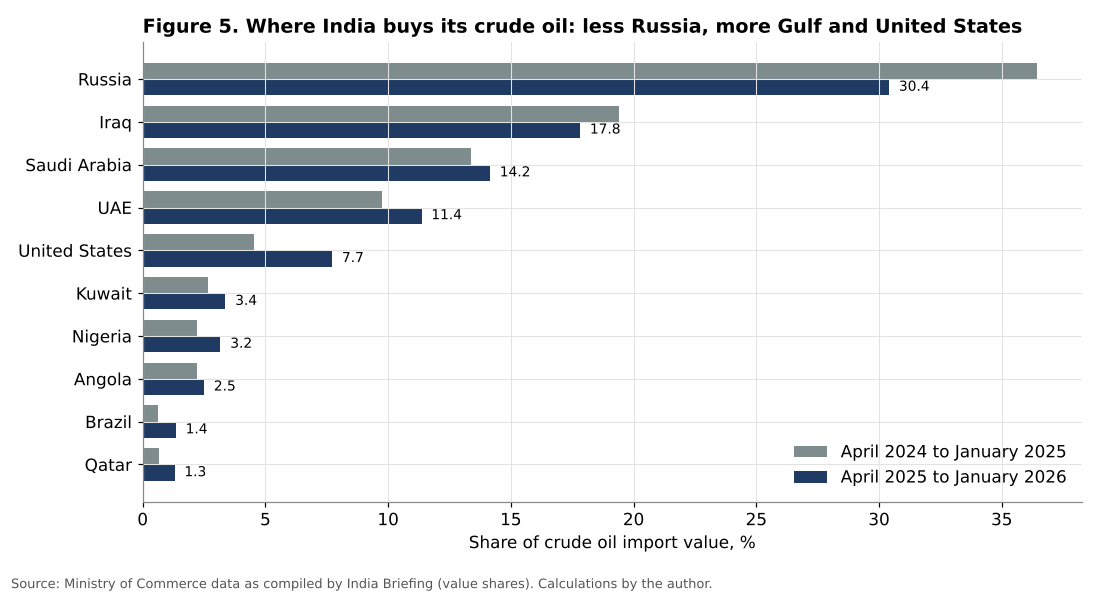
Russia became India’s largest supplier after 2022, offering discounted crude when Western countries reduced their purchases. In April 2024 to January 2025, Russia accounted for 36.4 percent of the value of India’s crude imports. In April 2025 to January 2026, its share fell to 30.4 percent, as the United States imposed penalties on purchases of Russian oil and as India committed, in the February 2026 trade agreement, to increase its purchases of American energy. The share of the United States rose from 4.6 to 7.7 percent.
At the same time, the share of Gulf producers (Iraq, Saudi Arabia, the United Arab Emirates, Kuwait and Qatar) rose from 45.8 to 48.0 percent. This increase in dependence on the Gulf, just before the escalation of the conflict, increased India’s exposure to the 2026 disruption. Estimates of the share of India’s crude imports that transit the Strait of Hormuz vary between about 30 and 45 percent depending on the period and source, and more than half of India’s LNG imports transit the strait.
The diversification of suppliers has improved in one respect: the concentration of imports, measured by the sum of squared shares of the ten main suppliers, fell from about 2,000 to about 1,660, because the dominance of Russia decreased. But this diversification has been partly toward the most exposed region.
5.6 Macroeconomic transmission
The oil shock affects the Indian economy through four channels.
The first is the current account. A higher import bill widens the current account deficit, which the IMF projects at 1.5 percent of GDP in 2026, against 0.7 percent in 2025. With foreign exchange reserves of several hundred billion dollars, India can finance such a deficit, but it puts pressure on the rupee.
The second is inflation. Higher fuel prices raise transport costs and the prices of goods and services. Consumer price inflation rose to 4.8 percent in August 2026, and the RBI projects 5.2 percent for 2026-27, with a peak of about 6 percent in the third quarter. The RBI cited higher food and fuel prices as the main reasons for its rate increase in October 2026.
The third is public finances. The government has partly absorbed the shock through support for LPG prices and duty exemptions. These measures limit the impact on households but increase the fiscal cost, at a time when the government is trying to reduce its deficit to 4.3 percent of GDP.
The fourth is growth. Higher energy costs reduce real incomes and corporate margins. However, as shown in the first article on India in this series, growth has so far remained strong, at 7.8 percent in the first quarter of 2026-27. The impact on growth is likely to appear with a lag.
5.7 Energy intensity and efficiency
One way to reduce dependence is to use less energy per unit of output. MoSPI estimates that India’s energy intensity, measured as megajoules of primary energy per rupee of GDP, improved from 0.1346 in 2022-23 to 0.1329 in 2024-25, a modest gain of about 1.3 percent over two years. The change of the GDP base year to 2022-23 makes longer comparisons difficult, but the trend over the past decade has been a gradual decline in energy intensity, as the economy has shifted toward services and as efficiency standards for appliances, lighting and industry have been introduced.
The sectoral data show where the potential lies. In 2024-25, transport used about 594 megajoules per thousand rupees of its value added, industry about 165, and agriculture about 22. Transport is therefore by far the most energy-intensive sector per unit of output, and almost all of its energy comes from oil. Measures that shift freight from road to rail, improve the fuel efficiency of vehicles and develop urban public transport would have a direct effect on oil imports.
At the same time, per capita electricity consumption rose by about 48 percent between 2015-16 and 2024-25, while per capita primary energy consumption rose by about 18 percent. This reflects the progressive electrification of the economy, which is a necessary condition for the energy transition: the more energy services are delivered through electricity, the more renewable sources can replace imported fuels.
6. Discussion
6.1 Structural dependence
The results show that India’s dependence on imported oil is structural and increasing. It is not the result of a temporary shortfall in domestic production, but of the combination of rapidly growing demand and limited domestic resources. Even with significant investment in exploration, domestic production is unlikely to rise enough to change the picture. The IEA expects India to be the largest source of growth in global oil demand to 2030.
This means that India’s exposure to oil price shocks will remain high for at least a decade. The question is not how to eliminate dependence, which is impossible in the medium term, but how to reduce its macroeconomic cost and the risks of disruption.
6.2 The transition and oil
The energy transition in India has been remarkably rapid in electricity. Renewable capacity has increased more than fourfold in ten years, and non-fossil sources now account for about half of installed capacity. But the transition has had little effect so far on oil, because oil is used mainly in transport, where electrification is only beginning.
Electric two-wheelers and three-wheelers are spreading rapidly, and the government has set targets of 80 percent of two- and three-wheeler sales and 30 percent of private car sales to be electric by 2030. BloombergNEF expects most of these targets to be missed, except for three-wheelers. The electrification of road freight, which accounts for a large share of diesel demand, is even further away. The transition in transport is therefore the key to reducing oil dependence, but it will take more than a decade to have a large effect.
Ethanol blending in petrol, which reached about 20 percent, has reduced petrol imports somewhat, but at the cost of diverting sugar cane and grains, with consequences for water use and food prices. Compressed biogas, green hydrogen and the electrification of railways offer other routes, each with its own limits.
6.3 Energy security measures
The 2026 shock has highlighted the importance of short-term energy security measures. India’s strategic petroleum reserves, built in underground caverns in the south of the country, cover only a limited number of days of imports, far below the 90 days of net imports required of member countries of the International Energy Agency. Expanding these reserves, together with the commercial stocks held by refiners, would increase resilience to temporary disruptions.
The diversification of suppliers is another lever, but the 2026 experience shows its limits. Diversification away from Russia has been driven by political pressure, and it has increased dependence on the Gulf. A more robust strategy would combine geographic diversification with long-term contracts, investment in upstream assets abroad and greater flexibility of refineries to process different grades of crude.
6.4 Policy implications
The analysis suggests five priorities:
1. Accelerate the electrification of transport, starting with two- and three-wheelers, buses and urban freight, where the economics are already favourable. 2. Expand strategic petroleum reserves and require minimum commercial stocks, to cover a larger number of days of imports. 3. Diversify sources of supply, giving greater weight to suppliers outside the Gulf and to long-term contracts. 4. Continue to price fuels in a way that reflects international costs, with targeted support for poor households rather than generalised subsidies, as recommended by the OECD. 5. Improve energy efficiency in industry and transport, which reduces demand at low cost.
6.5 Lessons from earlier oil shocks
India has experienced several oil shocks in the past two decades, and each offers lessons. In 2008, when oil prices rose above US$140 per barrel, the government kept retail fuel prices largely fixed, which shifted the cost to state-owned oil companies and the budget and contributed to a sharp increase in the fiscal deficit. In 2013, the combination of high oil prices, a large current account deficit and the announcement of the tapering of US monetary stimulus led to a sharp depreciation of the rupee. In 2022, after the invasion of Ukraine, India limited the impact by increasing its purchases of discounted Russian crude, a strategy that reduced the import bill in 2023-24 but created new geopolitical dependencies.
The 2026 shock combines elements of all three episodes: a sharp rise in prices, pressure on the current account and the currency, fiscal measures to protect households, and a geopolitical dimension that constrains the choice of suppliers. The main difference is that India’s macroeconomic buffers, notably its foreign exchange reserves and the credibility of its inflation-targeting framework, are much stronger than in 2008 or 2013. This explains why the shock has so far been absorbed without a crisis. But buffers are not inexhaustible, and a prolonged disruption would test them.
6.6 The rupee, reserves and financing
The financing of the oil bill also depends on the exchange rate and on capital flows. When oil prices rise, the demand for dollars from oil companies increases, which tends to weaken the rupee. A weaker rupee in turn increases the rupee cost of oil, adding to inflation. The RBI has historically intervened in the foreign exchange market to smooth such movements, using its large reserves. In 2026, the combination of higher oil prices and the tightening of global financial conditions has made this task more difficult.
Several mechanisms can reduce this vulnerability. The settlement of part of India’s oil trade in rupees or other currencies, which was explored with Russia and the United Arab Emirates, reduces the immediate demand for dollars, although its scope remains limited. Long-term supply contracts with fixed or formula prices can smooth the impact of price spikes. And the development of India’s services exports, which reached US$221 billion for software services alone in 2025-26, provides a structural source of foreign exchange that partly offsets the oil bill.
7. Scenarios for 2026-27
7.1 Three price scenarios
Figure 6 presents the crude oil import bill in 2026-27 under three price scenarios, assuming imports of 245 million tonnes, nominal GDP growth of 10 percent and an exchange rate of 90 rupees per dollar.
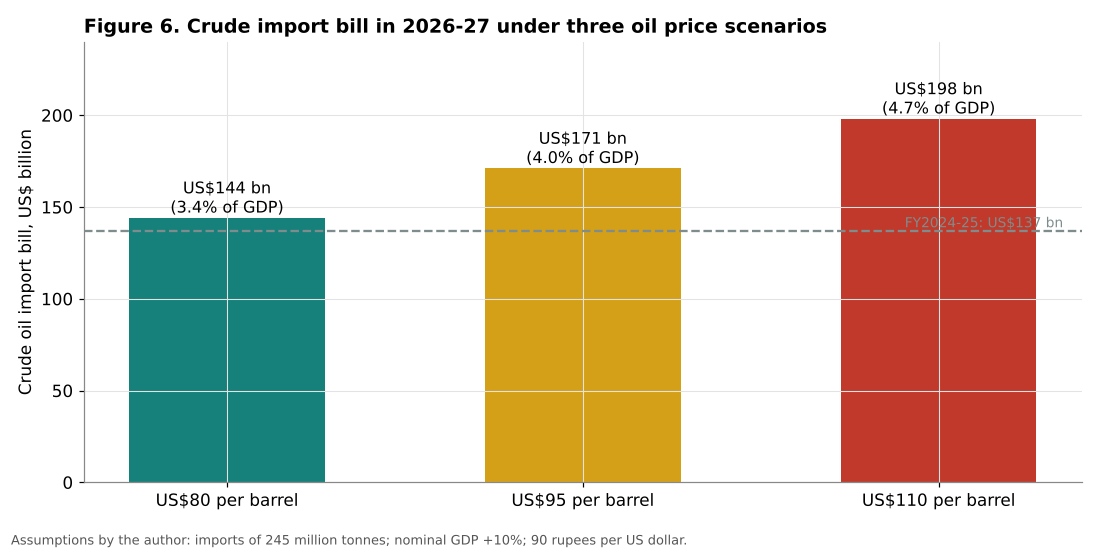
Easing (US$80 per barrel on average). Gulf supply recovers in the second half of the fiscal year, consistent with the OECD’s time-limited disruption scenario. The import bill would be about US$144 billion, or about 3.4 percent of GDP, slightly above the 2024-25 level.
Persistence (US$95 per barrel). Prices remain close to the average assumed by the IMF for 2026. The bill would reach about US$171 billion, about 4.0 percent of GDP, a new record in dollar terms.
Prolonged disruption (US$110 per barrel). Supply constraints last into 2027, consistent with the OECD’s prolonged disruption scenario. The bill would reach about US$198 billion, or about 4.7 percent of GDP, close to the 2022-23 peak in relation to GDP.
7.2 Sensitivity
Each increase of US$10 per barrel adds about US$18 billion to the annual import bill, or about 0.42 percent of GDP. The difference between the easing and the prolonged disruption scenarios is therefore about US$54 billion, or 1.3 percent of GDP, which is comparable to the projected current account deficit for 2026.
These figures concern crude oil only. Including LNG, LPG and other petroleum products, the total energy import bill is higher, and its sensitivity to prices is greater. On the other hand, India also exports refined petroleum products, which partly offsets the cost of crude imports.
7.3 Beyond 2026-27: the outlook to 2030
Looking beyond the current fiscal year, the structural trends point to continued high dependence. If petroleum product consumption grows by 3 to 4 percent per year, in line with the past decade, and domestic crude production continues to decline slowly, import dependence would approach 90 percent before 2030. Even with an oil price of US$80 per barrel, the crude import bill would then rise to about US$165 to 175 billion by the end of the decade in current dollars, although it would remain roughly stable as a share of a rapidly growing GDP.
Two developments could change this trajectory. The first is a faster electrification of road transport, particularly of two- and three-wheelers, buses and light commercial vehicles, which could flatten the growth of petrol and diesel demand by the end of the decade. The second is a structural increase in domestic gas production and the use of compressed biogas, which could reduce LNG and LPG imports. Neither is likely to reverse the trend before 2030, but both could slow it and lay the foundations for a decline in the 2030s.
7.4 Indicators to monitor
The author suggests monitoring:
1. The monthly crude import bill and volume published by PPAC. 2. The Indian basket price. 3. The share of Gulf suppliers and of Russia in imports. 4. Consumption of petrol, diesel and LPG. 5. Sales of electric vehicles by segment.
8. Conclusion
India’s energy dependence is one of the main structural vulnerabilities of its economy, and the 2026 oil shock has made it acutely visible. The main findings of this article are:
1. Crude oil import dependence has risen from 83.8 percent in 2018-19 to about 88 to 89 percent, about 21 points above the objective set in 2015. 2. About 44 percent of India’s primary energy supply is imported, of which oil accounts for about 60 percent. 3. Between April and August 2026, India paid 48 percent more for slightly less crude, as the average unit value rose from about US$68 to about US$101 per barrel. 4. Each US$10 increase in the oil price adds about US$18 billion, or 0.4 percent of GDP, to the annual import bill. In 2026-27, the bill could range from about US$144 billion to about US$198 billion depending on prices. 5. The rapid growth of renewable power has transformed the electricity sector but has not yet reduced dependence on imported oil, which is concentrated in transport.
The energy transition is the long-term answer to India’s energy dependence, but it will take more than a decade to have a large effect on oil imports. In the meantime, the priority is to reduce the macroeconomic cost of dependence through strategic reserves, diversification, efficiency, appropriate pricing and the electrification of transport, and to integrate energy security fully into macroeconomic policy.
Need this analysis for your organisation?
We prepare confidential briefings, executive talks and studies on countries, markets and policies, built on the same method as this article.
Request a briefingSupport independent analysis
Our studies are free to read and carry no advertising. If this one was useful, a small contribution helps us publish the next.
Support our workGo further: books by Global Strategy Files

Frequently asked questions
How dependent is India on imported oil?
Very dependent. India’s crude oil import dependence rose from 83.8 percent in 2018-19 to 88.2 percent in 2024-25 and about 88 to 89 percent in 2025-26 and 2026-27, far from the official objective of 67 percent set for 2022.
How did the 2026 oil shock affect India?
Between April and August 2026, India imported slightly less crude oil than a year earlier but paid 48 percent more, because the average unit value of imported crude rose from about US$68 to about US$101 per barrel.
How much does a rise in oil prices cost India?
Each increase of US$10 per barrel in the oil price adds about US$18 billion to India’s annual crude import bill, equivalent to about 0.4 percent of GDP, which weighs heavily on India’s current account. India imports almost nine tenths of its crude oil.
Has renewable energy reduced India’s oil dependence?
Not yet. Renewable power capacity has increased more than fourfold in ten years, but it has mainly reduced the need for imported coal in power generation. Oil imports are concentrated in transport and industry, so electrifying transport is key.
Methodological note
All calculations were carried out by the author. Crude import dependence, volumes and bills are PPAC data as reported in official releases and the press. The energy mix and fuel-specific import dependence are from MoSPI, Energy Statistics India 2026. GDP in US dollars uses IMF IFS nominal GDP converted at approximate annual average exchange rates. The unit value of crude uses a conversion factor of 7.33 barrels per tonne. Shares of supplying countries are value shares for April to January. The scenarios are illustrative and assume constant import volumes.
References
BloombergNEF (2026). India Transition Factbook 2026. London: BloombergNEF.
Hamilton, J. D. (1983). Oil and the Macroeconomy since World War II. Journal of Political Economy, 91(2), 228 to 248.
International Energy Agency (2024). Indian Oil Market: Outlook to 2030. Paris: IEA.
International Monetary Fund (2026). World Economic Outlook, October 2026. Washington, DC.
Kilian, L. (2009). Not All Oil Price Shocks Are Alike: Disentangling Demand and Supply Shocks in the Crude Oil Market. American Economic Review, 99(3), 1053 to 1069.
Ministry of Statistics and Programme Implementation (2026). Energy Statistics India 2026. New Delhi.
OECD (2022). OECD Economic Surveys: India 2022. Paris: OECD Publishing.
OECD (2026). OECD Economic Outlook, Volume 2026 Issue 1. Paris: OECD Publishing.
Petroleum Planning and Analysis Cell (2025, 2026). Snapshot of India’s Oil and Gas Data, monthly editions. New Delhi: Ministry of Petroleum and Natural Gas.
Reserve Bank of India (2026). Monetary Policy Statement, October 2026. Mumbai.
