
Energy Prices and the Future of Germany’s Energy-Intensive Industries: Evidence from the 2026 Shock

Energy Prices and the Future of Germany’s Energy-Intensive Industries: Evidence from the 2026 Shock
Driss EFFINA, PhD Independent Researcher, Global Strategy Files Reading time: about 26 minutes
Key takeaways
- European gas prices averaged about 75 euros per megawatt hour in September 2026, about twice the 2025 average.
- Energy-intensive branches account for about 15 percent of German manufacturing value added but 77 percent of industrial energy use.
- German chemical and paper production in early 2026 was about 20 percent below its January 2022 level, before the new shock.
- With gas around 65 euros per megawatt hour, energy-intensive output could fall a further 5 to 10 percent by 2027.
Abstract
In its Monthly Report of 21 September 2026, the Deutsche Bundesbank noted that energy commodity prices had risen sharply across the board in August and September, after a renewed escalation of the conflict in the Middle East restricted gas and oil shipments through the Strait of Hormuz. European gas prices reached about 77 euros per megawatt hour, Brent crude about 121 dollars a barrel, and output fell notably in chemicals, metal production and refined petroleum. This is the second energy shock to hit German industry in four years. This article asks what it means for the future of the country’s energy-intensive industries: chemicals, metals, paper, glass and ceramics, and refining. Using data from Destatis, the Bundesbank, ifo research and European gas market prices, the author builds five indicators: monthly and annual gas prices since 2022, the structural weight of the energy-intensive branches, the pass-through of energy prices to producer prices, a cost shock simulation by energy cost share, and an output elasticity estimated from the 2022 crisis, which is used to frame three gas price scenarios for 2027. The results show that the gas price averaged about 75 euros per megawatt hour in September 2026, about twice its 2025 average, but still far below the 2022 peak. The energy-intensive branches account for about 15 percent of manufacturing value added but 77 percent of industrial energy consumption. Chemical and paper production in early 2026 was about 20 percent below its January 2022 level, before the new shock. Producer prices of basic chemicals rose by 11.2 percent and of metals by 14.8 percent in the year to August 2026. The scenarios suggest that if gas prices stay around 65 euros per megawatt hour, energy-intensive output could fall by a further 5 to 10 percent by 2027 compared with 2025. The article concludes that the 2026 shock is accelerating a structural relocation of the most energy-intensive stages of production, and that public support can slow but not reverse it unless the structural cost of energy in Germany falls.
Keywords: Germany, energy prices, natural gas, energy-intensive industry, chemicals, deindustrialisation, competitiveness, producer prices, industrial policy
JEL codes: L60, Q41, Q43, L65, E31, F14
1. Introduction
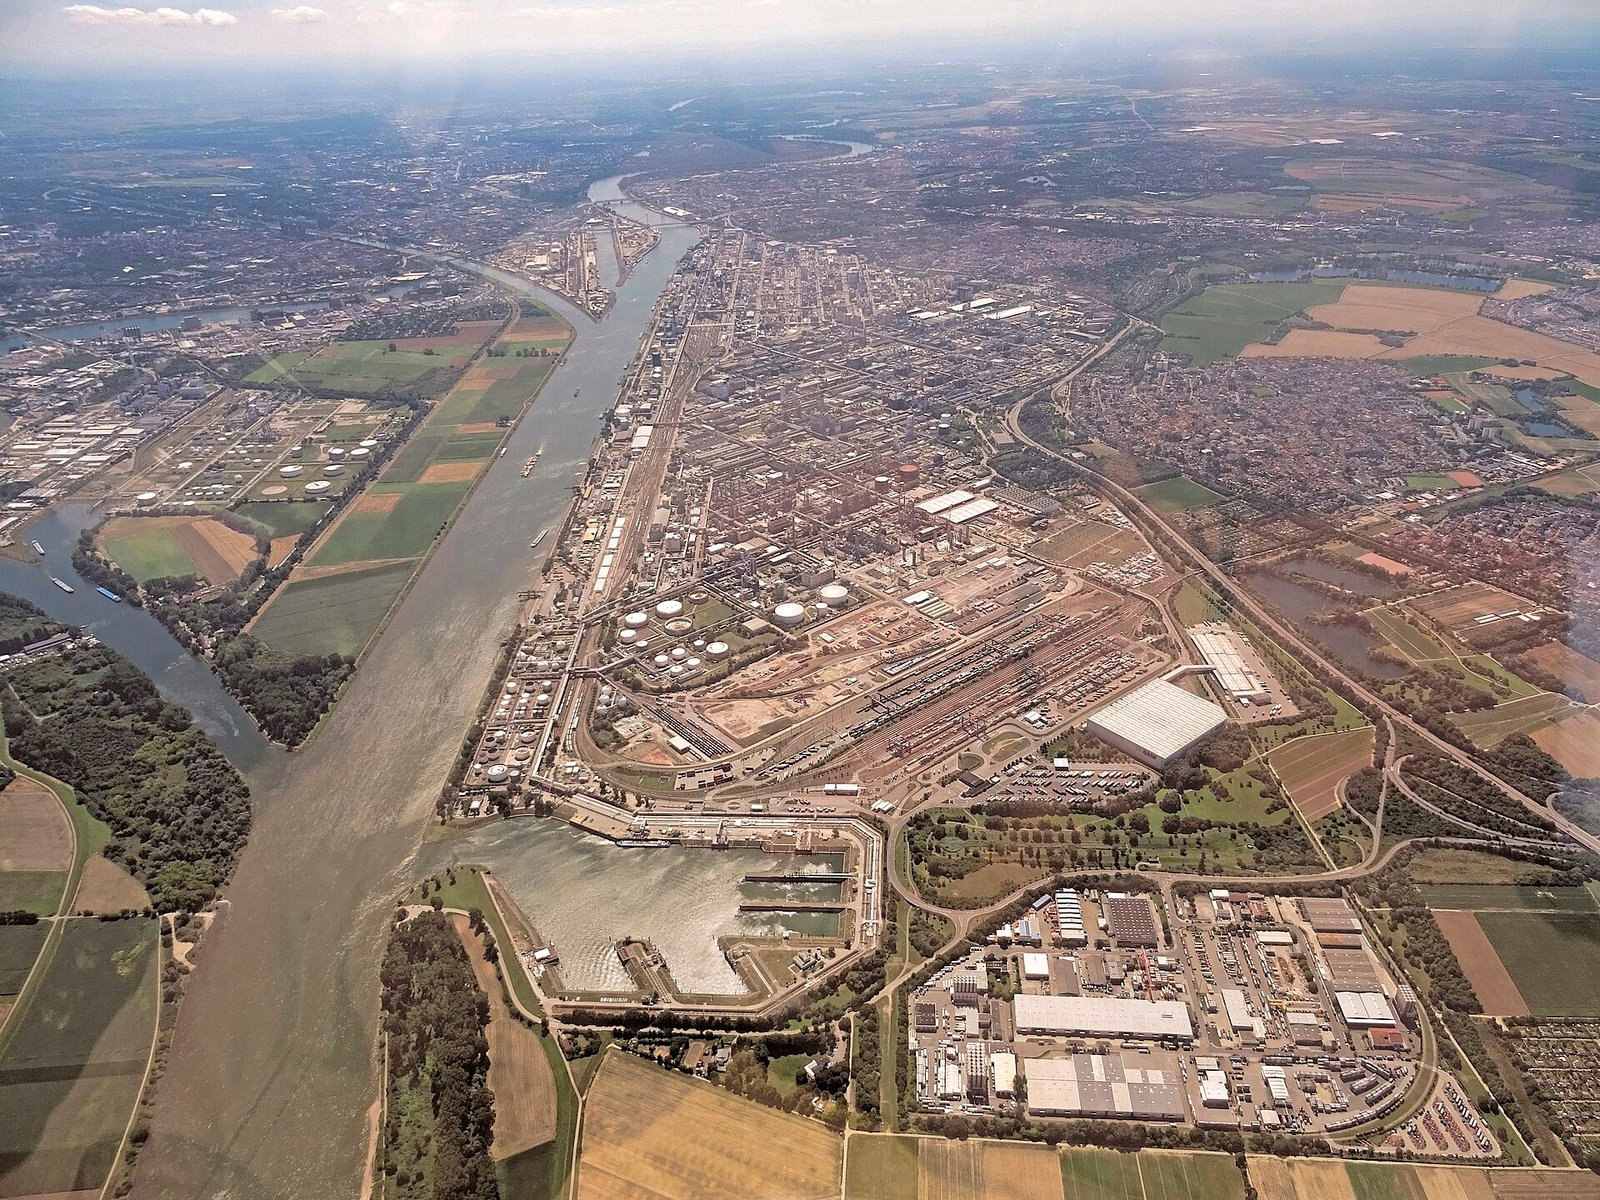
For decades, Germany’s industrial model rested on a combination of engineering skills, specialised small and medium-sized firms, and access to abundant, relatively cheap energy, much of it in the form of natural gas imported by pipeline from Russia. The chemical industry, concentrated around large integrated sites such as Ludwigshafen, Leverkusen and the Central German chemical triangle, used gas both as fuel and as feedstock. Metal producers, glass and ceramics manufacturers and paper mills depended on it for process heat.
This model was broken in 2022. After Russia’s invasion of Ukraine and the progressive halt of Russian pipeline deliveries, European gas prices rose to levels never seen before. German energy-intensive production fell by more than 17 percent during 2022. Prices then fell back, but production did not fully recover. By early 2026, chemical and paper production were still about 20 percent below their levels of January 2022.
In 2026, a new shock has hit. The conflict in the Middle East, after the failure of a framework agreement between the United States and Iran at the end of June, has restricted energy exports from the Gulf. Liquefied natural gas from Qatar, which had become an important part of Europe’s supply after 2022, can no longer easily reach Europe. European gas prices have more than doubled compared with 2025. The Bundesbank reported in September that output had fallen notably in the most energy-intensive branches.
This article asks a question that is central for Germany’s economic future: what future do energy-intensive industries have in Germany? It does not try to answer from first principles, but by measuring the shock, the vulnerability of the sector, the transmission of energy prices to costs and output prices, and the likely response of production under different scenarios.
Section 2 presents the context. Section 3 reviews the literature. Section 4 describes the data and methodology. Section 5 presents the results. Section 6 discusses them. Section 7 presents scenarios. Section 8 concludes.
2. Context
2.1 The energy-intensive industry in Germany
German statistics define the energy-intensive industry as five branches: chemicals; metal production and processing; paper and paper products; glass, ceramics and processing of stones and earths; and coke and refined petroleum products. According to Schaller and Schasching (2024), writing in the ifo Schnelldienst, these branches generated about 510 billion euros of turnover in 2023, nearly 22 percent of manufacturing turnover, and employed about 925,000 people, about 15 percent of manufacturing employment. They produced about 15 percent of real manufacturing value added in 2021, but consumed 77 percent of the energy used by industry. Natural gas accounted for about 30 percent of their energy use, electricity for 21 percent, and coal and oil for 16 percent each.
These branches are also at the beginning of most industrial value chains. Basic chemicals become plastics, coatings, pharmaceuticals and agricultural inputs. Steel and aluminium become cars, machines and buildings. A weakening of these branches therefore affects the entire industrial fabric, not only the firms directly concerned.
2.2 The 2022 shock
Before 2021, the European gas price at the Dutch TTF hub typically traded between about 10 and 25 euros per megawatt hour. In 2021, it began to rise as demand recovered after the pandemic and Russian deliveries fell. In 2022, after the invasion of Ukraine, it reached a monthly average of about 234 euros in August. On the author’s calculations, it averaged about 132 euros in 2022.
German industry responded by reducing gas consumption dramatically. Part of the reduction came from efficiency gains and fuel switching, part from lower production. Ruhnau and co-authors (2023) documented substantial reductions in German gas consumption in 2022, with industry accounting for a large part of the savings. Chemical production fell by 27 percent between December 2021 and December 2022.
2.3 The partial recovery
Gas prices fell back to about 42 euros per megawatt hour in 2023, 35 in 2024 and 36 in 2025, according to the author’s calculations, still two to three times their pre-2021 range. Production stabilised but did not return to its former level. Several large firms closed energy-intensive plants in Germany, including ammonia and other basic chemical units, and shifted investment to other regions, notably the United States and China, where energy is cheaper.
The government introduced measures to support industry: a reduction of the electricity tax for manufacturing to the European minimum, subsidies for transmission network charges and the abolition of the gas storage levy from 2026, and plans for a subsidised industrial electricity price for the most energy-intensive firms.
2.4 The 2026 shock
The Bundesbank’s September 2026 Monthly Report describes the new shock. After the failure of the US-Iran framework agreement at the end of June, the conflict escalated again. Gulf energy exports through the Strait of Hormuz remain heavily restricted, especially gas and petroleum products. Attacks on Saudi Arabia’s East-West pipeline pushed Brent crude to about 121 dollars a barrel. European gas reached about 77 euros per megawatt hour. Gas storage filling is slow, and Europe is expected to need unusually large imports of liquefied natural gas in the coming heating season.
At the same time, low water on the Rhine since July has disrupted transport and raised freight costs for bulk goods, a topic examined in the next article in this series. The combination of high energy prices and transport disruptions hit the energy-intensive branches particularly hard.
3. Literature review
The economic literature on energy prices and industry has developed rapidly since 2022.
Before the crisis, Bachmann and co-authors (2022) estimated the effects of a stop of Russian energy imports on the German economy. Using a multi-sector model with substitution possibilities, they concluded that the cost of a stop would be significant but manageable, around 0.5 to 3 percent of GDP, because firms could substitute away from gas more than simple input-output models suggested. Their study triggered a lively public debate in Germany, where many industry representatives predicted much larger losses.
Moll, Schularick and Zachmann (2023), in the Brookings Papers on Economic Activity, assessed this debate in retrospect. They showed that German industry reduced its gas consumption much more than pessimists had expected, with relatively modest effects on total industrial output, because firms substituted fuels, imported energy-intensive intermediate products and improved efficiency. They argued that the economy’s ability to substitute had been underestimated.
However, these studies focused on aggregate output in the short run. The energy-intensive branches themselves did experience large and persistent losses. Schaller and Schasching (2024) documented these losses and identified signs of structural problems: job cuts, deteriorating competitiveness ratings and falling investment expectations. They raised the question of a possible relocation of production abroad.
At the European level, the report by Mario Draghi on the future of European competitiveness (2024) identified high energy prices as one of the main handicaps of European industry compared with the United States and China, noting that European industrial electricity and gas prices were several times higher than in the United States.
This article contributes to this literature by examining a second shock, after the economy had already adjusted to the first. It focuses on the energy-intensive branches rather than on aggregate output, and it asks whether the 2026 shock is temporary or accelerates a structural shift.
4. Data and methodology
4.1 Sources
The analysis uses:
- monthly TTF gas prices from January 2022 to September 2026, as compiled by the Greek energy supplier Protergia. Comparison with the Austrian Economic Chamber’s (WKO) energy market update for July and August 2026 shows that the values published for a given month correspond to the average of the previous month; the author aligns them accordingly;
- the Bundesbank Monthly Report of September 2026 (short report on the economic situation, published on 21 September);
- Destatis releases on industrial production (August 2026, published 8 October 2026) and producer prices (August 2026, published 18 September 2026);
- Destatis production indices for chemicals and paper, as reported by Statista in May 2026;
- the structural data on the energy-intensive branches from Schaller and Schasching (2024).
4.2 Indicators
The author computes:
1. Annual average gas prices from the aligned monthly series, and the ratio of the September 2026 price to the 2025 average. 2. The cost shock by energy cost share. If energy represents a share s of a firm’s costs, and all of that energy is gas whose price rises by r percent, then unit costs rise by s times r percent, holding other costs constant and assuming no hedging. This is a simple first-order approximation. 3. An output elasticity from the 2022 episode. Between 2021 and 2022, the average gas price rose from an assumed 46.7 euros per megawatt hour to about 132 euros, and energy-intensive output fell by about 17 percent. The ratio of the log change in output to the log change in the gas price gives an elasticity of about -0.18. This is a rough upper bound for the direct effect of gas prices, since other factors, notably weak demand, also contributed to the fall in output. 4. Scenarios for 2027, applying this elasticity, and half of it to account for adaptation since 2022, to three gas price assumptions.
4.3 Limitations
The TTF price is a wholesale benchmark. Industrial firms pay different prices depending on their contracts, hedging and network charges. Electricity prices, which matter for metals and some chemical processes, are only partly driven by gas. The elasticity is estimated from a single episode and mixes price and demand effects. The cost shock calculation ignores substitution and pass-through to customers. The results should therefore be read as orders of magnitude.
5. Results
5.1 The size of the new shock
Figure 1 shows the monthly gas price from January 2022 to September 2026.
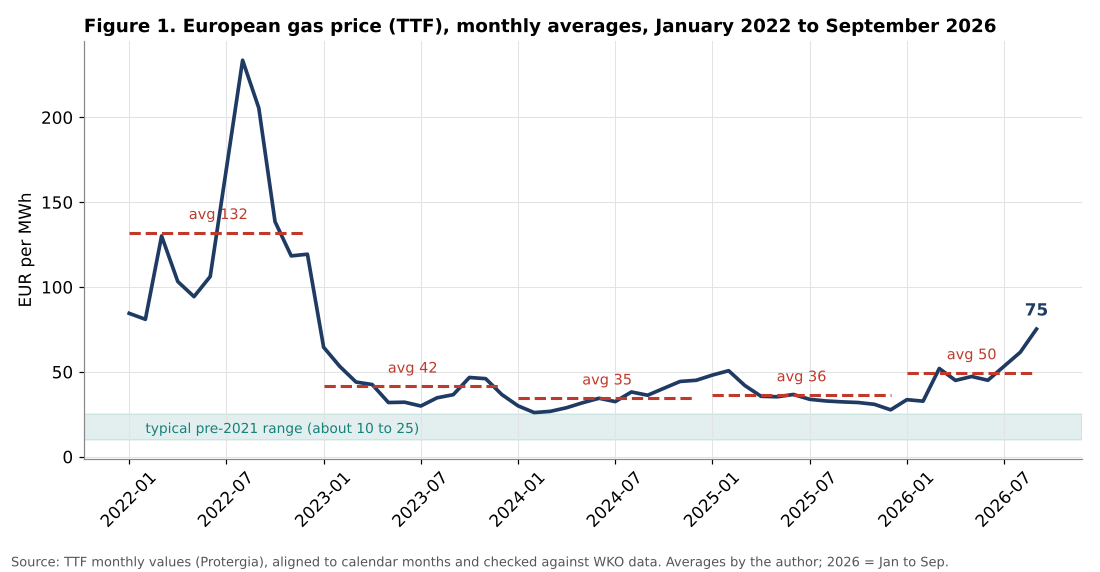
The figure puts the 2026 shock in perspective. On the author’s calculations, the gas price averaged about 132 euros per megawatt hour in 2022, with a peak of about 234 euros in August 2022. It fell to about 42 euros in 2023, 35 in 2024 and 36 in 2025. In 2026, it was about 34 euros in January and 33 in February, jumped to about 52 euros in March as the conflict in the Middle East intensified, eased to around 45 to 47 euros between April and June, and then rose rapidly: 53 euros in July, 62 in August and about 75 in September. The average for the first nine months of 2026 is about 50 euros.
| Period | Average TTF gas price (EUR/MWh) |
|---|---|
| Typical range before 2021 | about 10 to 25 |
| 2022 | 132 |
| 2023 | 42 |
| 2024 | 35 |
| 2025 | 36 |
| January to September 2026 | 50 |
| September 2026 | 75 |
Table 1. European gas prices. Source: TTF monthly values compiled by Protergia, aligned to calendar months; averages by the author.
In September 2026, the gas price was about 106 percent higher than its 2025 average, that is, more than twice as high. This is a large shock, but it is much smaller than in 2022: the September 2026 price is about a third of the August 2022 peak. The shock is also occurring from a higher starting level: even in 2025, prices were well above their pre-2021 range.
The Bundesbank notes that European energy prices are at their highest since the Iran conflict began, but still far below the levels of the 2021 and 2022 crisis. It also warns that there are significant upside risks, especially for mineral oil products, gas and electricity, given low inventories.
5.2 A small sector with a large energy footprint
Figure 2 shows the structural weight of the five energy-intensive branches.
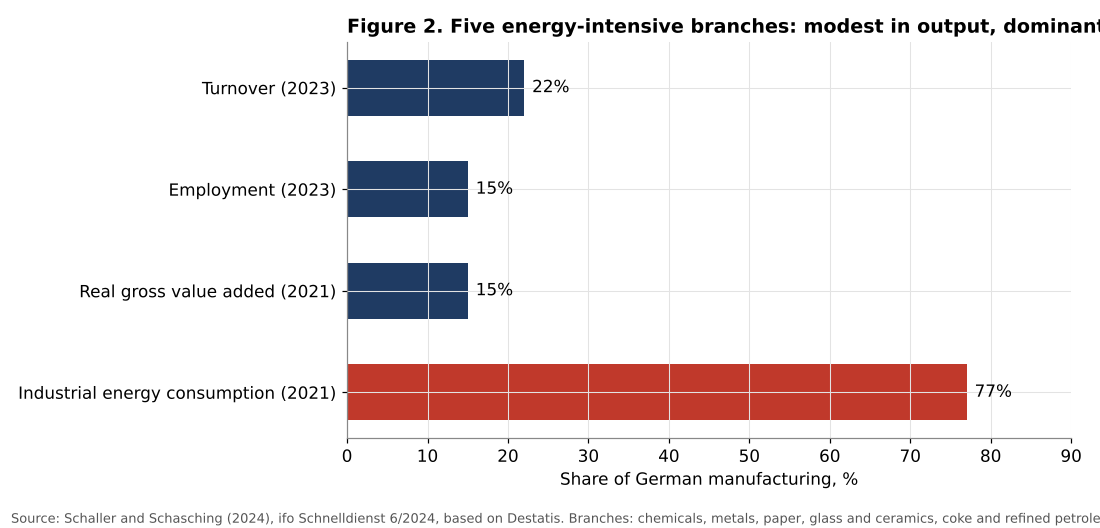
The energy-intensive branches are significant but not dominant in the German economy: they account for about 22 percent of manufacturing turnover, 15 percent of manufacturing employment and 15 percent of manufacturing value added, which corresponds to about 3.4 percent of total gross value added. But they account for 77 percent of the energy consumed by industry.
This asymmetry explains why energy price shocks have such concentrated effects. For most of manufacturing, energy is a small share of costs, and a doubling of energy prices has limited direct effects. For the energy-intensive branches, energy can account for a large share of costs, and a doubling can wipe out profit margins. It also explains why these branches are the most exposed to international competition from regions with lower energy costs.
5.3 Transmission to producer prices
Figure 3 shows the change in German producer prices between August 2025 and August 2026.
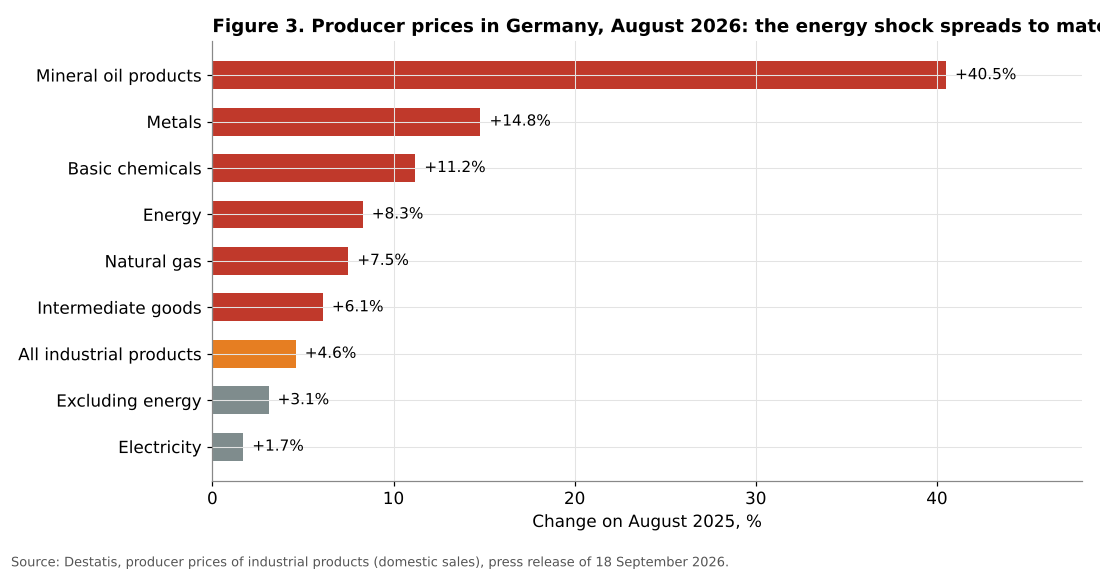
The energy shock is clearly visible in producer prices. Overall industrial producer prices rose by 4.6 percent, but excluding energy, the increase was only 3.1 percent. Energy prices rose by 8.3 percent, driven by mineral oil products (+40.5 percent, with light heating oil +65.3 percent). Natural gas rose by 7.5 percent and electricity by only 1.7 percent, which reflects the fact that producer prices for gas and electricity include long-term contracts that adjust only gradually to wholesale prices.
The shock is spreading to intermediate goods. Prices of basic chemicals rose by 11.2 percent and metals by 14.8 percent, partly because of energy costs and partly because of global commodity price increases, notably copper and precious metals, both up 34.6 percent. Intermediate goods as a whole rose by 6.1 percent.
The Bundesbank expects inflation to remain elevated for some time, as energy price increases are passed on with a lag. Import prices rose by 6.8 percent year on year in July. HICP inflation was 2.9 percent in August, and national CPI inflation rose to 3.3 percent in September, with energy prices up 14.9 percent.
The fact that producers of basic chemicals and metals have been able to raise their prices suggests that part of the energy cost increase is being passed on. However, their ability to do so is limited by international competition: if competitors in the United States, the Middle East or Asia face lower energy costs, they can undercut German producers. This is why price increases tend to be accompanied by falling output.
5.4 Production: a lasting loss and a new decline
Figure 4 shows the evolution of production in the energy-intensive branches.
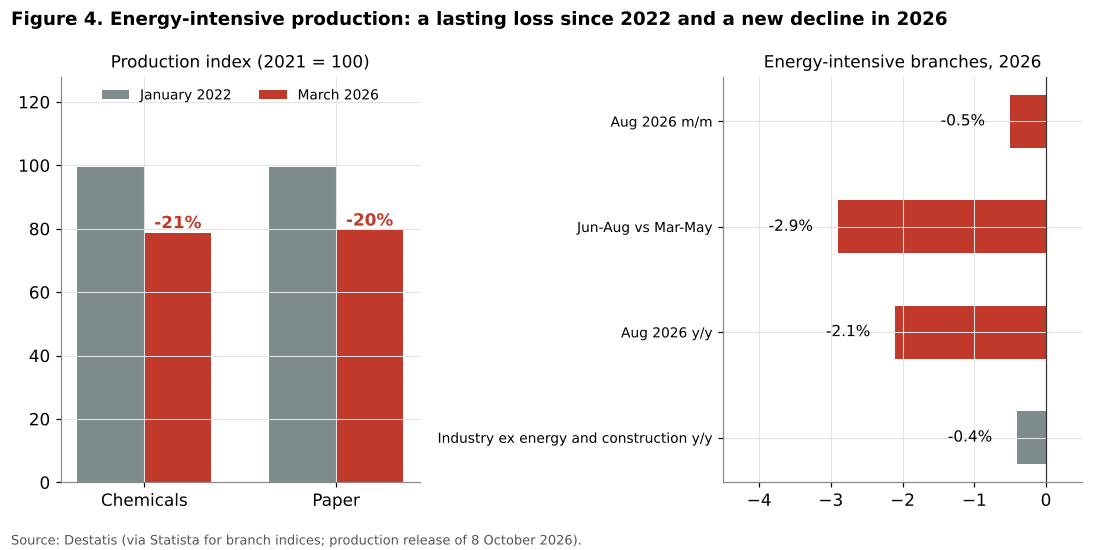
The left panel shows the lasting effect of the 2022 shock. According to Destatis data reported by Statista, the production index for chemicals fell from 99.4 in January 2022 to 78.7 in March 2026, a decline of about 21 percent. Paper production fell from 99.5 to 79.5, a decline of about 20 percent. These figures refer to March 2026, before the new energy shock. In other words, the energy-intensive branches had not recovered from the first shock when the second one began.
Not all branches followed the same path. The production index for coke and refined petroleum reached 130.7 in March 2026, a marked rise, reflecting specific factors in the refining sector, including tight markets for refined products and changes in trade flows.
The right panel shows the latest data. In August 2026, production in the energy-intensive branches fell by 0.5 percent compared with July, by 2.9 percent in the three months June to August compared with the previous three months, and by 2.1 percent compared with August 2025. By contrast, production in industry excluding energy and construction was only 0.4 percent lower than a year earlier. Total industrial production rose by 2.0 percent in August, driven by construction and machinery. The energy-intensive branches are clearly underperforming the rest of industry.
The Bundesbank reports that in July output fell notably in coke and refined petroleum, chemicals and metal production, which were hit both by supply bottlenecks, notably low water on the Rhine, and by high fossil energy prices.
5.5 The cost shock by energy intensity
Figure 5 shows the effect on unit costs of a 106 percent increase in the gas price, for firms with different energy cost shares.
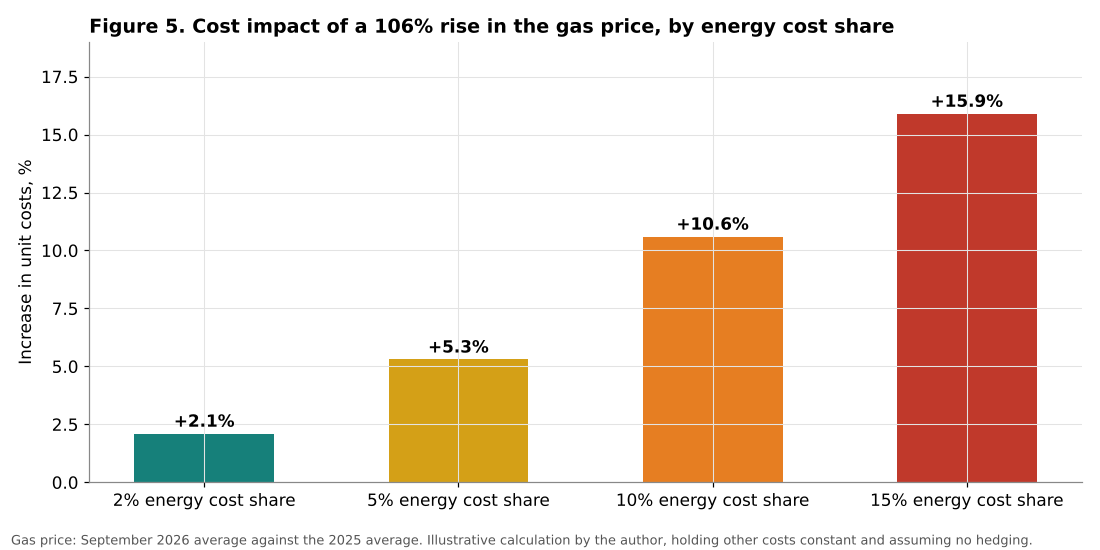
For a firm whose energy costs represent 2 percent of total costs, typical of many manufacturing branches, the shock raises unit costs by about 2.1 percent. This is significant but manageable. For a firm with a 5 percent energy cost share, the increase is about 5.3 percent. For a firm with a 10 percent share, which is common in parts of the chemical, glass and paper industries, the increase is about 10.6 percent. For the most energy-intensive processes, with a 15 percent share, unit costs rise by about 15.9 percent.
These figures are upper bounds, since firms hedge part of their energy purchases, use other energy carriers and can partly pass costs on. But they show why the effects of an energy shock are so concentrated. In highly competitive markets for basic chemicals or steel, where margins are often in the single digits, a cost increase of 10 percent or more can make production unprofitable, at least temporarily.
5.7 Electricity: a second channel
Gas is not the only energy price that matters. For metal production, especially aluminium and electric steel, and for parts of the chemical industry, electricity is the main energy carrier. In Europe, wholesale electricity prices are closely linked to gas prices, because gas-fired power plants often set the marginal price.
According to data compiled by the platform euenergy.live, the average day-ahead wholesale electricity price in Germany was about 95 euros per megawatt hour in 2023 and about 79 euros in 2024, after much higher levels in 2022. In the summer of 2026, wholesale electricity prices in the region rose sharply with gas prices: the WKO energy market update shows that the regional day-ahead reference price averaged about 106 euros per megawatt hour in July 2026 and about 136 euros in August, an increase of 29 percent in one month. The Bundesbank notes that power prices followed gas, and that summer weather reduced hydro and nuclear output in Europe.
For industrial consumers, the wholesale price is only part of the bill, which also includes network charges, taxes and levies. The measures adopted by the government, such as the reduction of the electricity tax and subsidies for network charges, reduce these components, but they cannot offset a large increase in the wholesale price. The fact that producer prices for electricity rose by only 1.7 percent in the year to August 2026 reflects the delay with which contracts adjust; further increases are likely in the coming months as contracts are renewed.
5.6 Two shocks, not one
The most important result of this section is the combination of the 2022 and 2026 shocks. After 2022, energy-intensive firms faced a choice: wait for prices to return to pre-crisis levels, or adjust to a permanently higher level by closing or relocating the most energy-intensive stages of production. Many chose a mixture: they reduced output, delayed investment and waited.
The 2026 shock changes the calculation. It shows that European energy prices are exposed not only to Russian supply but also to the Middle East, through the market for liquefied natural gas. Firms that had hoped for a return to cheap energy now face the prospect of recurrent shocks. This raises the risk premium on energy-intensive investment in Europe, and makes relocation to regions with abundant domestic energy, such as the United States or the Gulf itself, more attractive.
6. Discussion
6.1 Temporary shock or structural shift?
The key question is whether the 2026 shock is temporary or accelerates a structural shift. The evidence points to the second interpretation, for three reasons.
First, the energy-intensive branches had not recovered from the 2022 shock. Chemical and paper production were still about 20 percent below early 2022 levels in March 2026. This means that the capacity lost in 2022 was not simply idle, waiting for better times, but in many cases permanently closed.
Second, even before the 2026 shock, gas prices in Europe were two to three times their pre-2021 range. A structural cost gap with the United States, where gas is produced domestically, has persisted since 2022. The 2026 shock widens this gap.
Third, the recurrence of shocks raises uncertainty, which matters for investment decisions in capital-intensive industries where plants have lifetimes of several decades. A firm deciding where to build a new chemical plant will take into account not only the expected level of energy prices but also their volatility.
6.2 What can be relocated, and what cannot
Not all energy-intensive production is equally likely to relocate. The most exposed activities are the production of basic chemicals, such as ammonia, chlorine and basic polymers, and primary metals, such as aluminium and crude steel, which are traded globally, have low margins and use energy intensively. These are the activities where German capacity has already been reduced.
Other activities are less exposed: specialty chemicals, pharmaceuticals, high-quality steel products and processing activities close to customers have higher margins and a lower energy share in costs, and depend on proximity to customers, research capabilities and skilled labour. Germany retains strong positions in these activities.
The likely outcome is therefore not the disappearance of the energy-intensive industry, but a shift in its composition: fewer basic products, more specialised and downstream production, and more imports of energy-intensive intermediate products. Moll, Schularick and Zachmann (2023) noted that such a shift was already visible after 2022.
6.3 Is this a problem?
From a purely economic point of view, the relocation of energy-intensive production to regions with cheaper energy could be seen as an efficient adjustment to changing comparative advantages. If Germany imports ammonia instead of producing it, and uses the resources freed up in more productive activities, aggregate welfare may not suffer much.
However, there are several reasons for concern. First, the transition imposes costs on workers and regions, especially where large sites dominate the local economy. Second, the integrated nature of chemical sites means that closing basic production can weaken downstream activities that depend on it. Third, dependence on imports of basic materials creates vulnerabilities in a world of geopolitical tensions, as the 2026 shock itself illustrates. Fourth, if energy-intensive production moves to regions with higher carbon emissions, global emissions may rise, a phenomenon known as carbon leakage.
6.4 Policy options
Policy can influence the outcome in several ways.
Short-term relief. Measures such as the reduction of electricity taxes, subsidies for network charges and a subsidised industrial electricity price can reduce the immediate pressure on firms. However, they are costly for public finances and do not address the underlying problem. They may also be limited by European state aid rules.
Diversification of supply. The 2026 shock shows the importance of diversifying gas supply sources, including from the United States, Norway and other producers, and of maintaining sufficient storage.
Reducing the structural cost of energy. In the longer term, the competitiveness of German industry depends on the cost of electricity, which in turn depends on the expansion of renewable energy, grids and storage, and on the reform of taxes, levies and network charges. Electrification of industrial processes, using cheaper renewable electricity, could reduce dependence on gas.
Supporting transformation. Public support for the conversion of energy-intensive processes, for example to hydrogen-based steel production, can help to maintain production in Germany, but the costs are high and the economic viability of these technologies depends on the price of green hydrogen and electricity.
6.5 The macroeconomic dimension
The energy-intensive branches account for about 3.4 percent of total gross value added. Even a further 10 percent decline in their output would reduce GDP directly by about 0.3 percent, plus indirect effects through supply chains. This is significant but not dramatic for the economy as a whole. The more important effects may be on investment, regional employment and the long-term industrial base.
At the same time, the energy shock affects the whole economy through inflation and lower purchasing power. The Federal Government’s autumn projection expects inflation to rise to 3.0 percent in 2027, and notes that private consumption and investment are likely to remain subdued because of higher energy and consumer prices. The energy shock is therefore one of the main reasons why the German recovery, discussed in an earlier article in this series, remains dependent on public spending.
6.6 The international dimension
The competitiveness of German energy-intensive industries depends on energy prices relative to those of competitors. Here, the 2026 shock has an uneven geography. The United States, a net exporter of natural gas, is largely insulated from the disruption of Gulf supplies, and its domestic gas prices remain far below European levels. Producers in the Gulf region itself, when they can export, have access to very cheap feedstock. China, while also an importer of liquefied natural gas, relies more on coal and has been building its chemical capacity at a rapid pace for years.
Within Europe, all countries face similar wholesale gas prices, but electricity prices and support measures differ. France benefits from its nuclear fleet, the Nordic countries from hydroelectric power, and the Iberian Peninsula from abundant solar power. Germany, which phased out nuclear power in 2023 and still relies on gas and coal for a significant part of its electricity, is among the countries most exposed to gas price shocks in its power prices.
This international dimension means that the decisions of German firms are not only about whether to produce, but where. A chemical group with plants in Germany, the United States and Asia can shift production between sites according to relative costs, as several have done since 2022. The 2026 shock gives them a new reason to do so.
7. Scenarios for 2027
7.1 Assumptions
The author considers three scenarios for the average gas price in 2027, and estimates their effect on energy-intensive output compared with 2025, when the average gas price was about 36.5 euros per megawatt hour.
Normalisation. The conflict in the Middle East de-escalates, shipping through Hormuz resumes and the gas price falls back to about 40 euros per megawatt hour.
Persistent tension. Shipping remains restricted and Europe competes with Asia for limited liquefied natural gas. The gas price averages about 65 euros.
Escalation. The conflict escalates further, or a cold winter combines with low storage, and the gas price averages about 100 euros.
For each scenario, the author applies two elasticities: the full elasticity estimated from 2022 (about -0.18), and half of it, reflecting the adaptation of firms since 2022 through efficiency gains, fuel switching and hedging.
7.2 Results
Figure 6 shows the results.
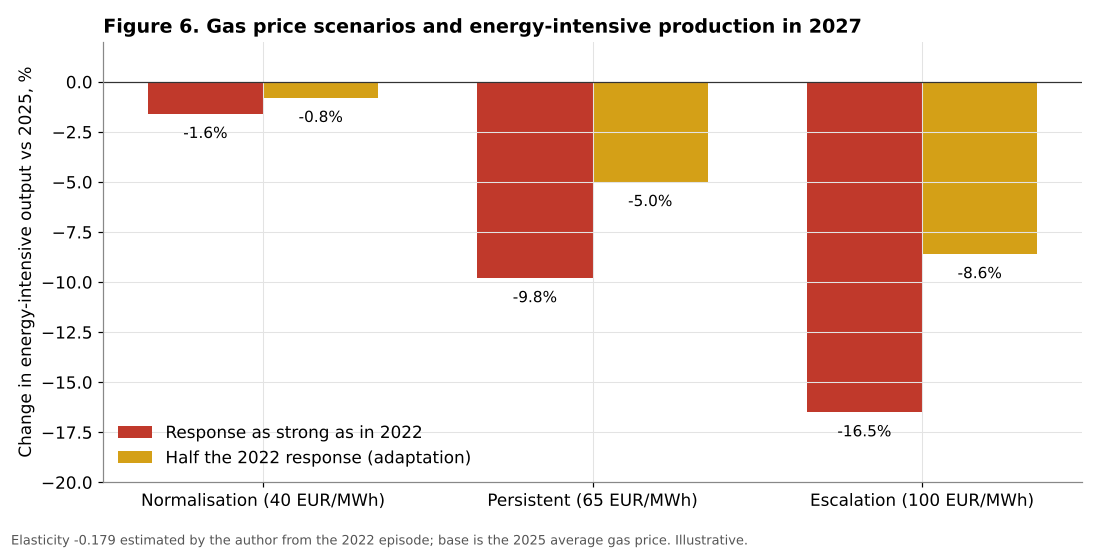
In the normalisation scenario, the effect is small: energy-intensive output would be about 1 to 2 percent below 2025. In the persistent tension scenario, output would fall by about 5 to 10 percent. In the escalation scenario, it would fall by about 9 to 17 percent, comparable to the 2022 shock.
| Scenario | Gas price 2027 (EUR/MWh) | Output vs 2025, half elasticity | Output vs 2025, full elasticity |
|---|---|---|---|
| Normalisation | 40 | -0.8% | -1.6% |
| Persistent tension | 65 | -5.0% | -9.8% |
| Escalation | 100 | -8.6% | -16.5% |
Table 2. Scenarios for energy-intensive output in 2027. Source: calculations by the author.
These estimates concern the direct effect of gas prices. They do not include the effects of other factors, such as demand from customers in the car and construction industries, the strength of the euro or the effects of trade policy.
7.3 Interpretation
The scenarios show that the outcome depends heavily on the geopolitical situation. In the most favourable case, the 2026 shock would remain a temporary disturbance. In the other two cases, it would cause a further significant decline in energy-intensive production, on top of the 20 percent already lost since 2022.
The asymmetry of the scenarios is important. Even in the normalisation scenario, output does not return to its 2021 level, because the 2025 starting point already reflected a lasting loss. The scenarios therefore suggest that a recovery of energy-intensive production to pre-2022 levels is unlikely in any configuration.
7.4 Indicators to watch
The author suggests monitoring:
1. The TTF gas price and European gas storage levels before and during the winter. 2. Monthly Destatis production data for the energy-intensive branches. 3. Producer prices of basic chemicals and metals. 4. Investment announcements by chemical and metal producers, in Germany and abroad. 5. The implementation of the industrial electricity price and other relief measures.
8. Conclusion
The 2026 energy shock is the second to hit German industry in four years. On the author’s calculations, the European gas price averaged about 75 euros per megawatt hour in September 2026, about twice its 2025 level, although still far below the 2022 peak.
The analysis shows that:
1. The energy-intensive branches account for about 15 percent of manufacturing value added and employment, but 77 percent of industrial energy consumption, which concentrates the effects of energy shocks. 2. Chemical and paper production were about 20 percent below their January 2022 levels in March 2026, before the new shock, showing that the first shock caused lasting losses. 3. The energy shock is being transmitted to producer prices, with basic chemicals up 11.2 percent and metals up 14.8 percent year on year in August 2026. 4. For firms with energy cost shares of 10 to 15 percent, the gas price increase raises unit costs by about 11 to 16 percent, enough to make some production unprofitable. 5. If gas prices remain around 65 euros per megawatt hour, energy-intensive output could fall by a further 5 to 10 percent by 2027 compared with 2025.
The answer to the question of the future of energy-intensive industries in Germany is therefore nuanced. They will not disappear, but they will shrink and change. The most energy-intensive basic production is likely to continue moving to regions with cheaper energy, while specialised, high-value and downstream activities are more likely to remain. The pace of this transformation will depend on geopolitics, which Germany cannot control, and on the structural cost of energy, which it can influence through its energy, tax and infrastructure policies.
Need this analysis for your organisation?
We prepare confidential briefings, executive talks and studies on countries, markets and policies, built on the same method as this article.
Request a briefingSupport independent analysis
Our studies are free to read and carry no advertising. If this one was useful, a small contribution helps us publish the next.
Support our workGo further: books by Global Strategy Files


Frequently asked questions
How high are gas prices in Germany in 2026?
The European gas price averaged about 75 euros per megawatt hour in September 2026, about twice its 2025 average but still far below the 2022 peak, after the Middle East conflict restricted shipments through the Strait of Hormuz.
Which German industries are most exposed to energy prices?
Chemicals, metals, paper, glass and ceramics, and refining. These energy-intensive branches account for about 15 percent of manufacturing value added but 77 percent of industrial energy consumption, and their output fell notably in 2026. Producer prices of metals rose 14.8 percent in the year to August 2026.
How has German chemical production changed since 2022?
It has fallen sharply. Chemical and paper production in early 2026 was already about 20 percent below its January 2022 level, before the new energy shock, and producer prices of basic chemicals rose 11.2 percent in the year to August 2026.
What is the outlook for Germany’s energy-intensive industries?
Weak. If gas prices stay around 65 euros per megawatt hour, energy-intensive output could fall a further 5 to 10 percent by 2027 compared with 2025, accelerating the relocation of the most energy-intensive stages of production.
Methodological note
All calculations were carried out by the author. Monthly TTF gas prices are from the series compiled by Protergia; comparison with WKO data for July and August 2026 shows that the values published for a month correspond to the previous month’s average, and they were aligned accordingly. Annual averages are simple averages of monthly values. The 2021 average gas price used for the elasticity (46.7 euros per megawatt hour) is an assumption based on the commonly reported annual average. The structural shares are from Schaller and Schasching (2024). Production and producer price data are from Destatis. The cost shock and scenario calculations are illustrative.
References
Bachmann, R., Baqaee, D., Bayer, C., Kuhn, M., Löschel, A., Moll, B., Peichl, A., Pittel, K. and Schularick, M. (2022). What if? The Economic Effects for Germany of a Stop of Energy Imports from Russia. ECONtribute Policy Brief No. 028.
Deutsche Bundesbank (2026). Kurzbericht: Konjunkturlage. Monatsbericht, September 2026. Frankfurt am Main, 21 September 2026.
Draghi, M. (2024). The Future of European Competitiveness. Report for the European Commission. Brussels.
Moll, B., Schularick, M. and Zachmann, G. (2023). The Power of Substitution: The Great German Gas Debate in Retrospect. Brookings Papers on Economic Activity, Fall 2023.
Ruhnau, O., Stiewe, C., Muessel, J. and Hirth, L. (2023). Natural Gas Savings in Germany during the 2022 Energy Crisis. Nature Energy, 8, 621 to 628.
Schaller, D. and Schasching, M. (2024). Energieintensive Industrie unter Druck. ifo Schnelldienst, 77(6), 52 to 60.
Statistisches Bundesamt (Destatis) (2026). Produktion im August 2026: +2,0 % zum Vormonat. Press release, 8 October 2026.
Statistisches Bundesamt (Destatis) (2026). Erzeugerpreise im August 2026: +4,6 % gegenüber August 2025. Press release, 18 September 2026.
euenergy.live (2026). Strompreise in Deutschland 2024: day-ahead wholesale prices.
Protergia (2026). TTF prices per month, January 2022 to October 2026.
Wirtschaftskammer Österreich (2026). Energiemarkt-Update September 2026. Vienna.
