
The COLA Paradox: A 3.6 Percent Raise, the Medicare Offset and the 2032 Cliff

Driss EFFINA, PhD Independent Researcher, Global Strategy Files. Decoded, 11 November 2026. Reading time: about 9 minutes.
Key takeaways
- Social Security benefits will rise 3.6% in January 2027, the largest increase since 2023. The average retired worker’s check goes from $2,095 to $2,170, plus $75 a month.
- For the first time since 2023, the COLA should exceed the increase in the Medicare Part B premium, projected at 3.25% ($202.90 to $209.50). Net of that increase, the average retiree gains about $68 a month.
- Yet a retiree who received $1,500 a month in 2019 will still be about 2% poorer in real terms in 2027, after the Part B premium, than in 2019. In 2022 the real loss reached 6%.
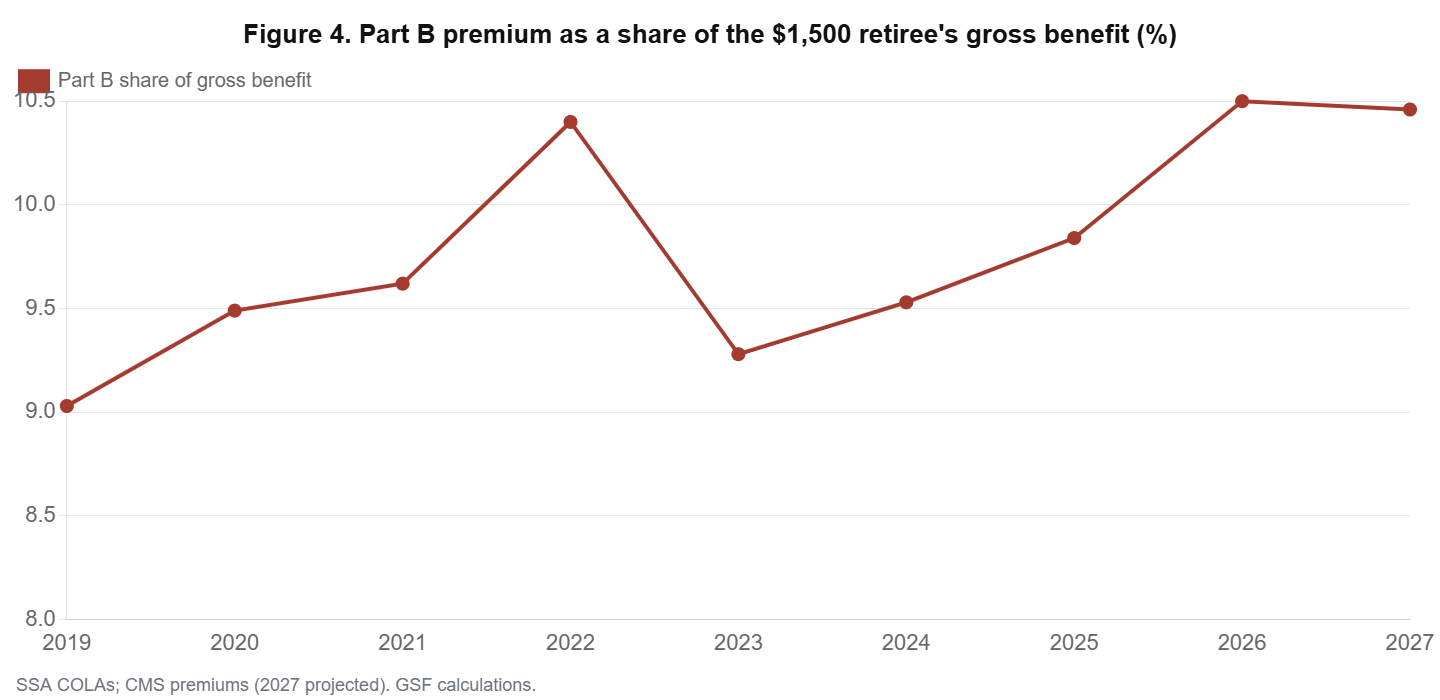
- The Part B premium has risen from 9.0% to 10.5% of that retiree’s gross benefit since 2019: health costs are quietly absorbing part of every adjustment.
- Each point of COLA costs about $16 billion in the first year and about $205 billion over ten years. A persistent one-point gap between price and wage growth for five years would bring forward the 2032 depletion of the retirement trust fund by about two months.
- Inflation itself is not what threatens the fund. The 2032 cliff, when only 78% of scheduled benefits could be paid, is driven by demography and the absence of reform.
The biggest raise in four years
On 14 October 2026, the Social Security Administration announced a cost-of-living adjustment of 3.6% for 2027, applying to nearly 72 million beneficiaries from January and to 7.3 million recipients of Supplemental Security Income from 31 December 2026. The increase reflects the rise in the consumer price index for urban wage earners and clerical workers (CPI-W) between the third quarter of 2025 and the third quarter of 2026, a period marked by the energy shock linked to the conflict in the Gulf.
The announcement was welcomed as good news for retirees, and in one respect it is. For three years running, increases in the Medicare Part B premium, which is deducted directly from most Social Security checks, outpaced the COLA. In 2027 the order should reverse. But the headline hides two less comfortable facts. The adjustment only partly compensates for the inflation of recent years once health costs are included. And the trust fund that pays retirement benefits is projected to be depleted in late 2032. This article examines both.
COLA versus Part B
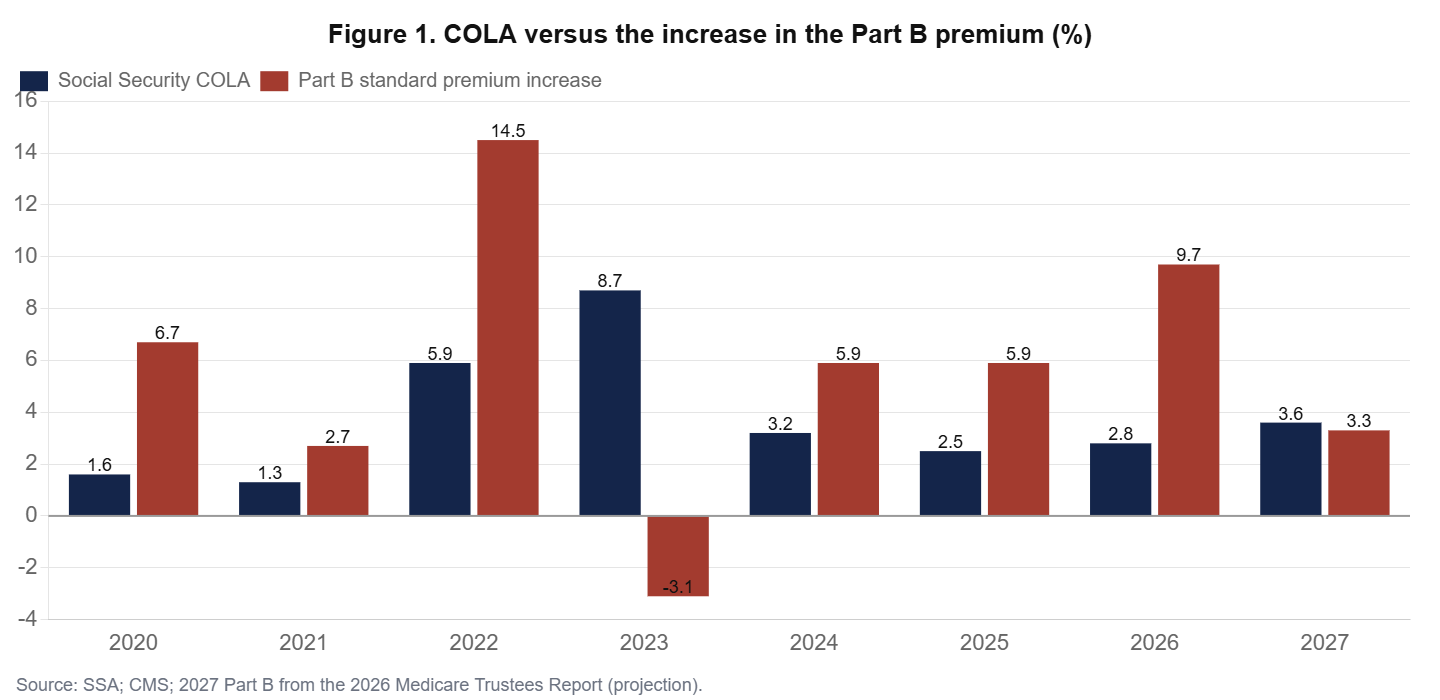
Figure 1 compares the annual COLA with the percentage increase in the standard Part B premium since 2020. The premium rose faster than benefits in six of the eight years, sometimes much faster: by 14.5% in 2022 against a COLA of 5.9%, and by 9.7% in 2026 against 2.8%. The only exceptions were 2023, when the premium fell by 3.1% while benefits rose 8.7%, and 2027, when the Medicare Trustees project a 3.25% increase against a 3.6% COLA. CMS usually confirms the premium in November, and private forecasts suggest the final figure could be somewhat higher than the Trustees’ projection.
For the average retired worker in January 2027, the arithmetic is as follows: a gross increase of $75, minus $6.60 of additional Part B premium, gives a net gain of about $68 a month, or roughly $820 a year. Beneficiaries with higher incomes, who pay income-related surcharges on Part B and Part D, will keep less.
A real-income audit since 2019
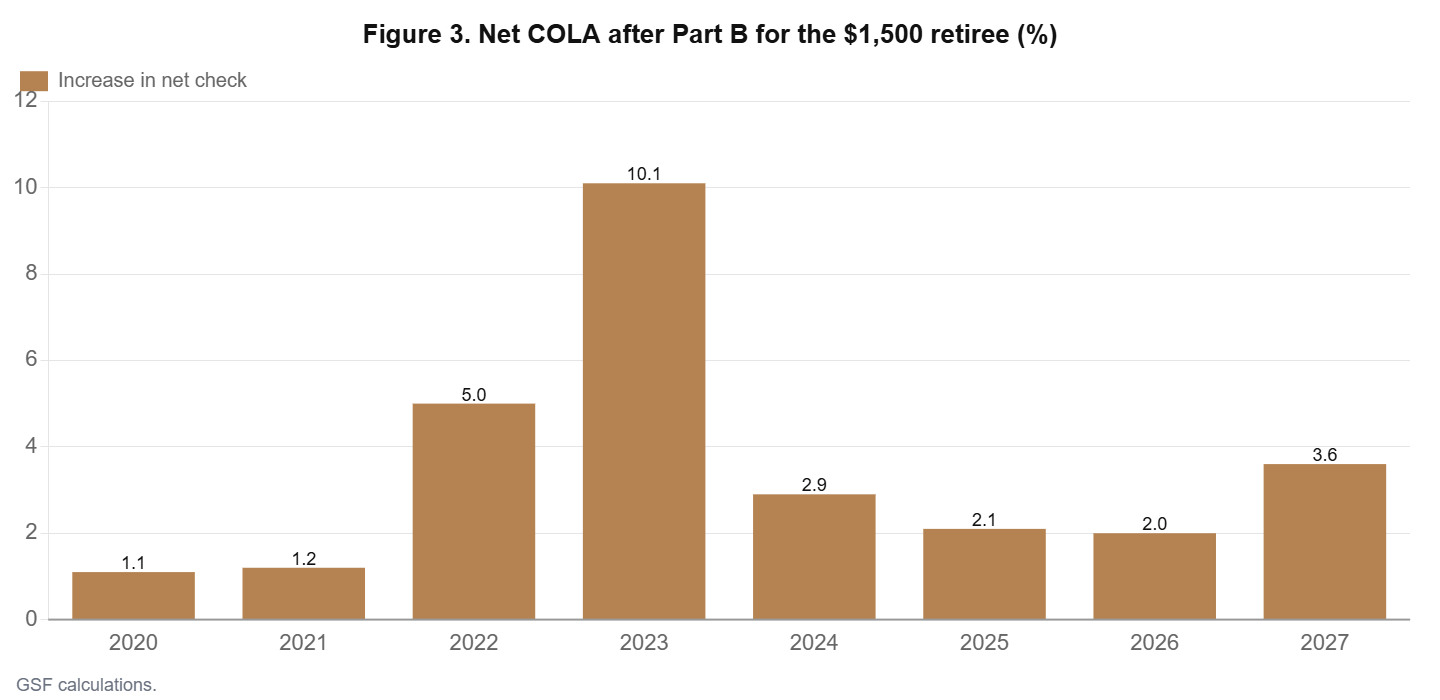
To see what the adjustments have done over a full cycle of inflation, we follow a retiree who received a gross benefit of $1,500 a month in 2019 and paid the standard Part B premium (Table 1 and Figure 2). Applying each year’s COLA, the gross benefit reaches $2,002 in 2027. Net of the Part B premium, the check rises from $1,364 to $1,793. Deflated by the consumer price index for all urban consumers, the net benefit in 2019 dollars fell to $1,280 in 2022, a loss of 6.2%, and recovers only to $1,337 in 2027, still 2.0% below its 2019 level.
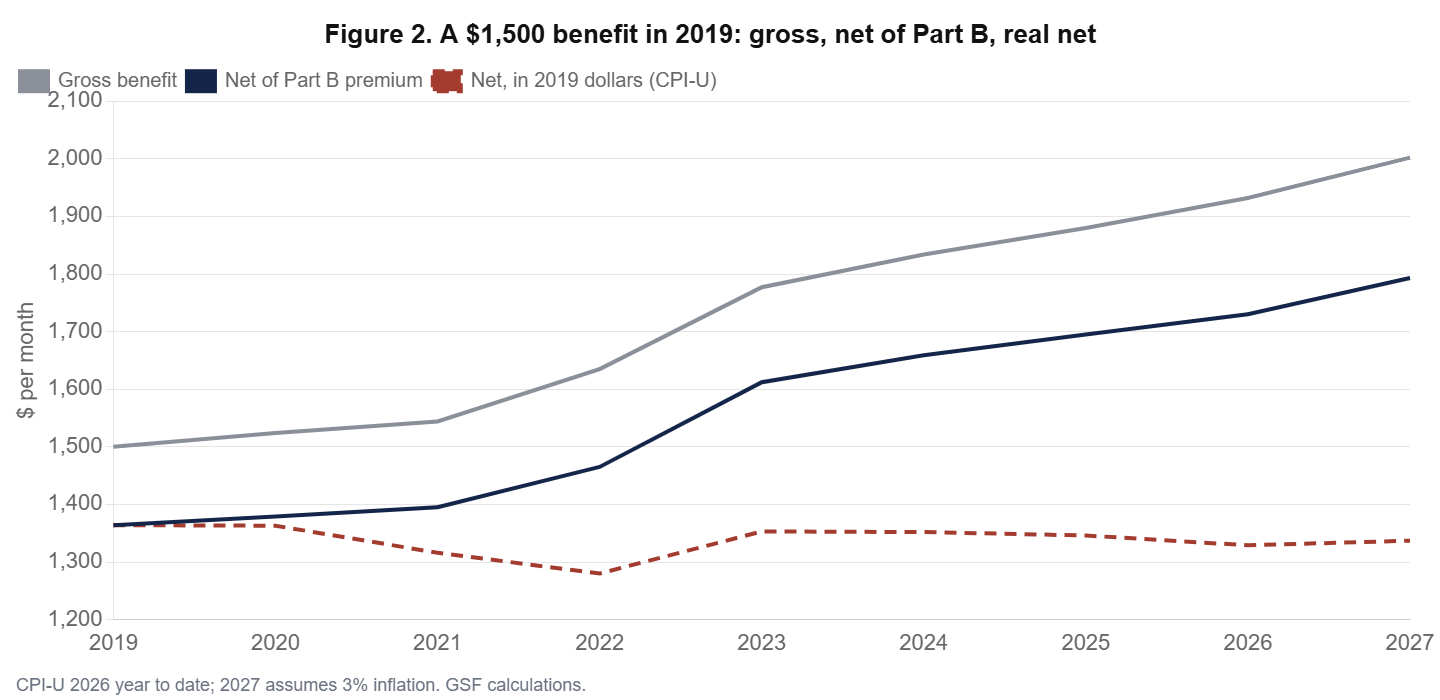
Table 1. A $1,500 benefit in 2019: gross, net of Part B, and real net ($ per month)
| Year | COLA | Gross benefit | Part B premium | Net benefit | Net in 2019 dollars | Net increase |
|---|---|---|---|---|---|---|
| 2019 | 1,500 | 135.50 | 1,364 | 1,364 | ||
| 2020 | 1.6% | 1,524 | 144.60 | 1,379 | 1,363 | 1.1% |
| 2021 | 1.3% | 1,544 | 148.50 | 1,395 | 1,316 | 1.2% |
| 2022 | 5.9% | 1,635 | 170.10 | 1,465 | 1,280 | 5.0% |
| 2023 | 8.7% | 1,777 | 164.90 | 1,612 | 1,353 | 10.1% |
| 2024 | 3.2% | 1,834 | 174.70 | 1,659 | 1,352 | 2.9% |
| 2025 | 2.5% | 1,880 | 185.00 | 1,695 | 1,346 | 2.1% |
| 2026 | 2.8% | 1,932 | 202.90 | 1,730 | 1,329 | 2.0% |
| 2027 | 3.6% | 2,002 | 209.50 | 1,793 | 1,337 | 3.6% |
Why does a mechanism designed to protect purchasing power leave the retiree worse off? There are three reasons. First, the COLA lags inflation by up to a year, so a burst of price increases, as in 2021 and 2022, is compensated only after it has been endured. Second, the Part B premium, which reflects the growth of health spending, rose much faster than general prices: from 9.0% of our retiree’s gross benefit in 2019 to 10.5% in 2027. Third, the CPI-W, which drives the COLA, rose slightly faster than the CPI-U between 2019 and 2026 (30.8% against 30.2%), but neither index gives health care the weight it has in older households’ budgets. The Bureau of Labor Statistics’ experimental index for the elderly has generally risen faster than the CPI-W over long periods for that reason.
The cost of a point of COLA
Social Security paid $1.60 trillion in benefits in 2025 to 70 million beneficiaries. Each percentage point of COLA therefore costs roughly $16 billion in the first year, and because the increase is permanent and compounds with later adjustments, about $205 billion over ten years. The 3.6% adjustment for 2027 alone adds about $60 billion to annual outlays.
It is often said that high inflation endangers Social Security’s finances. The mechanism is more subtle. Payroll tax revenue rises with wages, which also rise with inflation, generally with a lag. If prices and wages move together, inflation raises both outlays and revenue and leaves the trust fund roughly unchanged in real terms. The damage comes from a gap: when prices rise faster than wages, benefits grow faster than revenue.
We simulate such a gap. Suppose that for five years, COLAs exceed wage growth by one percentage point a year. The cumulative extra cost is about $240 billion. With monthly retirement and survivor costs of about $113 billion, that is equivalent to about two months of benefits, which would bring forward the depletion of the retirement trust fund by about two months, from the fourth quarter of 2032 to the third. A large inflation shock with lagging real wages matters at the margin; it does not change the basic timetable.
Table 2. Social Security finances: key numbers from the 2026 Trustees Report
| Indicator | Value |
|---|---|
| Combined OASDI reserves, end of 2025 | $2.56 trillion |
| Change in reserves during 2025 | minus $160 billion |
| Benefits paid in 2025 | $1.60 trillion |
| OASI depletion date | Fourth quarter of 2032 |
| Share of OASI benefits payable at depletion | 78% |
| Combined OASDI depletion (if funds merged) | 2034 (83% payable) |
| 75-year actuarial deficit | 4.42% of taxable payroll |
Who gains and who loses from the 2027 adjustment
The same 3.6% adjustment has different effects depending on a beneficiary’s situation. Retirees with modest benefits who pay the standard Part B premium keep the largest share of the gross increase, because the premium increase is a fixed dollar amount. Beneficiaries with higher incomes pay income-related surcharges on Part B and Part D that rise with premiums, and they may see a larger share of their benefits taxed, because the income thresholds for taxing Social Security benefits, $25,000 for a single filer and $32,000 for a couple, are not indexed to inflation. Every COLA therefore pushes more retirees into partial taxation of their benefits, a slow fiscal drag that offsets part of the adjustment.
Recipients of Supplemental Security Income, the means-tested program for poor elderly and disabled people, see their maximum federal payment rise from $994 to $1,029 a month for an individual. They do not pay the Part B premium, which Medicaid covers, so they keep the full increase. Disabled workers, whose average benefit rises from $1,642 to $1,701, are in a position similar to retirees.
Table 3. The 2027 adjustment for different beneficiaries ($ per month)
| Beneficiary | Before COLA | After COLA | Gross increase | Net of Part B increase |
|---|---|---|---|---|
| Average retired worker | 2,095 | 2,170 | 75 | about 68 |
| Aged couple, both receiving | 3,238 | 3,355 | 117 | about 104 |
| Aged widow or widower alone | 1,936 | 2,005 | 69 | about 62 |
| Average disabled worker | 1,642 | 1,701 | 59 | about 52 |
| SSI individual (federal maximum) | 994 | 1,029 | 35 | 35 |
The index question
Should Social Security use a different price index? Two alternatives are regularly proposed. The chained CPI, which accounts for substitution between goods when relative prices change, generally rises more slowly than the CPI-W; adopting it would reduce the cost of future adjustments and improve the trust fund balance, but would lower benefits over time, with the largest cumulative effect on the oldest beneficiaries. An index for the elderly, which gives more weight to health care and housing, has tended to rise faster than the CPI-W; adopting it would raise benefits and worsen the financing gap. The choice is therefore not technical but distributive: it decides how the burden of closing the gap is shared between current and future retirees and taxpayers.
Our audit adds a practical point. Whatever the index, the deduction of the Part B premium from the check means that health cost growth is effectively netted out of the adjustment. A retiree’s protection against inflation depends as much on Medicare premium policy as on the COLA formula.
The 2032 cliff
According to the 2026 Trustees Report, the Old-Age and Survivors Insurance trust fund will be depleted in the fourth quarter of 2032, one quarter earlier than projected a year ago. At that point, continuing payroll taxes would cover 78% of scheduled retirement benefits. For the average retiree in 2027 terms, a 22% cut would reduce the check from $2,170 to about $1,690 a month, a loss of about $480, roughly seven times the net gain of the 2027 COLA. The actuarial deficit over 75 years has widened to 4.42% of taxable payroll, from 3.82% a year earlier, partly reflecting revised demographic assumptions.
The paradox of 2027 is therefore that retirees are receiving their most generous adjustment in four years while the program’s long-term gap is widening. The two are related only loosely. The COLA preserves the real value of benefits already promised; the cliff comes from the fact that the promises exceed the resources dedicated to them. Options to close the gap are well known: raising or eliminating the taxable maximum, now $192,300 for 2027, increasing the payroll tax rate, adjusting the benefit formula for higher earners, raising the retirement age, or changing the inflation index. Each has a different distribution of costs, and each becomes more expensive the longer it is postponed.
Medicare’s growing claim on Social Security
Figure 4 tracks the Part B premium as a share of our retiree’s gross benefit. It rose from 9.0% in 2019 to about 10.4% in 2022, fell back in 2023 when the premium declined, and climbed again to 10.5% in 2026 and 2027. The trend reflects the faster growth of health spending relative to general prices, and the fact that Part B premiums are set to cover about a quarter of program costs.
The interaction between the two programs creates a little-known protection, the hold-harmless provision, which prevents the dollar increase in the Part B premium from exceeding the dollar increase in a beneficiary’s Social Security check. It protects the net check of most beneficiaries from falling, but it shifts the cost to those not protected: new enrollees, higher-income beneficiaries and those whose premiums are paid by state Medicaid programs. In years of low COLAs and high premium increases, that shift can be large, as in 2016.
Looking ahead, both programs face financing gaps. The Medicare Hospital Insurance trust fund faces its own depletion date, and Part B costs, financed by premiums and general revenue, keep rising faster than the economy. For retirees, the practical consequence is that a growing share of their Social Security income will be devoted to health insurance, regardless of how the COLA is calculated.
The COLA as a macroeconomic impulse
The 2027 adjustment is also a macroeconomic event. A 3.6% increase in benefits that totalled $1.60 trillion in 2025, and will be higher in 2026, adds about $60 billion a year to the incomes of beneficiaries from January. The increase in the Part B premium takes back a small part: $6.60 a month for roughly 60 million enrollees paying the standard premium is about $5 billion a year. The net addition, about $55 billion, is close to 0.2% of GDP, the same order of magnitude as the tax cut delivered by the new deductions in the 2026 filing season.
Retirees spend a large share of additional income, so most of this addition will flow into consumption during 2027. That matters for the Federal Reserve, which is debating further rate increases in a context of inflation still above target. The COLA is, by construction, a lagged response to past inflation: it compensates for price increases that have already occurred, and it does so precisely when monetary policy is trying to slow demand. The effect is not large enough to change the course of policy, but it is one of the mechanisms through which an inflation shock propagates into the following year.
Table 4. The 2027 adjustment in aggregate
| Item | Amount |
|---|---|
| Gross increase in annual benefits (3.6% of about $1.65 trillion) | about $60 billion |
| Increase in standard Part B premiums ($6.60 x 12 x about 60 million) | about $5 billion |
| Net addition to beneficiaries’ income | about $55 billion |
| As a share of GDP | about 0.2% |
Conclusion
The 3.6% COLA for 2027 is a genuine improvement for retirees, and the first in four years that should not be eaten up by the Part B premium. But a retiree’s real net income is still below its 2019 level, because the COLA lags inflation and health costs grow faster than other prices. Inflation is not, in itself, the main threat to Social Security: even a persistent gap between prices and wages would bring forward the 2032 depletion date by only a couple of months. The real threat is the absence of reform before a 22% cut becomes automatic. For the 72 million beneficiaries, the most important number of 2027 is not 3.6%, but 2032.
Robustness and limits
Our retiree example assumes the standard Part B premium and no income-related surcharge, which applies to the large majority of beneficiaries. It does not account for Medicare Part D premiums, Medigap or Medicare Advantage costs, or out-of-pocket spending, all of which have also risen. Including them would make the real decline larger. The 2027 values are provisional: CMS will publish the final Part B premium in November, and private forecasts suggest it could exceed the Trustees’ projection of $209.50; each additional $5 would reduce the net gain of the average retiree by the same amount.
The trust fund sensitivity is a deliberately simple approximation. The Trustees’ own sensitivity analysis models wages, prices, interest rates and benefit formulas jointly; in their framework, higher inflation with unchanged real wage growth has only a small effect on long-run finances, which is consistent with our result. The point of our calculation is to show the order of magnitude: inflation is a second-order issue for solvency compared with demography and the absence of legislative action.
Table A1. Data appendix: COLA, price indices and Part B premium
| Year | COLA (January) | Part B premium ($) | CPI-U (annual) | CPI-W (annual) |
|---|---|---|---|---|
| 2019 | 2.8% | 135.50 | 255.7 | 249.2 |
| 2020 | 1.6% | 144.60 | 258.8 | 252.3 |
| 2021 | 1.3% | 148.50 | 271.0 | 265.5 |
| 2022 | 5.9% | 170.10 | 292.7 | 288.0 |
| 2023 | 8.7% | 164.90 | 304.7 | 299.0 |
| 2024 | 3.2% | 174.70 | 313.7 | 307.6 |
| 2025 | 2.5% | 185.00 | 321.9 | 315.3 |
| 2026 | 2.8% | 202.90 | 332.8 (Jan to Oct) | 326.1 (Jan to Oct) |
| 2027 | 3.6% | 209.50 (projected) |
Methodological note
The retiree example starts from a $1,500 gross benefit in 2019 and applies official COLAs and standard Part B premiums; it ignores income-related surcharges and Part D. Real values use annual CPI-U averages (2026 January to October) and assume 3% inflation in 2027. The cost of a COLA point uses 2025 benefits of $1.60 trillion growing 4% to 4.5% a year. The depletion sensitivity divides the cumulative cost of a one-point price-wage gap over five years by an estimated monthly OASI cost of $113 billion (85% of total benefits); it is a simple approximation, not a Trustees projection.
GO DEEPER
The 2026 US Economy Trilogy (3 books, PDF)
Growth from the AI investment boom, the Federal Reserve and the credit economy, and what inflation leaves in the household budget: the forces behind this article, analysed in three research books by Dr. Driss Effina. About 900 pages in English PDF.
$59 instead of $90
Sources
- Social Security Administration, 2027 COLA Fact Sheet and COLA information, October 2026; 2026 OASDI Trustees Report and press release, 9 June 2026; CRS, Social Security: Selected Findings of the 2026 Annual Report, June 2026; Center for Retirement Research at Boston College, 2026.
- 2026 Medicare Trustees Report (Part B projection for 2027); CMS, 2026 Medicare Parts A and B premiums, November 2025; BLS CPI-U and CPI-W via FRED; Kiplinger, Senior Citizens League and NewsNation reporting, October 2026.
- Driss EFFINA, PhD | Independent Researcher, Global Strategy Files | globalstrategyfiles.com
Driss EFFINA, PhD
The opening pages of our four country reports: United States, United Kingdom, Japan and China. A free PDF, sent to your inbox.
You will also receive occasional analysis from Global Strategy Files. Unsubscribe in one click, at any time.