
Private Long, Public Short: The Bond Inflows and Equity Outflows Rewiring Canada


How foreign bond money and domestic equity flight turned Canada into a national carry fund, and why the real danger is a crisis that starts in the United States.
Executive summary
Canada’s portfolio accounts have changed character in less than two years. Foreign investors are buying Canadian bonds, above all federal bonds, on a scale never recorded before. Canadian investors, at the same time, are sending their savings into United States equities, mostly large technology shares. Commentators have described each of these movements separately. This article treats them as one system and measures how that system behaves. The result is a portrait of a country whose external balance sheet now works like a leveraged investment fund: it borrows from the world in fixed income and holds the world, chiefly America, in equities.
The analysis rests on 130 months of Statistics Canada portfolio flow data (November 2015 to August 2026), a detailed monthly decomposition by issuer and destination from June 2021 to June 2026, and the quarterly revaluation accounts of the international investment position. It applies regime-switching estimation, structural break detection, extreme value theory, vector autoregression with Granger causality tests, principal component analysis, and a balance-sheet stress model. Seven findings stand out.
First, the flow system has entered a new volatility regime. A two-state Markov-switching model identifies a high-volatility state in which the standard deviation of monthly net flows is C$27.4 billion, almost twice the C$14.7 billion of the calm state. The probability of being in the turbulent state averaged 12% from 2016 to 2019. It has averaged 60% since January 2025 and has not fallen below 82% in any month since November 2025. The historical expected duration of a turbulent spell is about five months. The current spell has lasted ten.
Second, August 2026 was not just a large month. It was an impossible one under the old regime. A generalized Pareto model fitted to monthly net outflows before 2025 produces a bounded tail whose maximum is about C$35.6 billion. The C$41.2 billion net outflow recorded in August 2026 lies outside the support of that distribution. Even when the turbulent months are included, the model assigns it a return period of roughly 44 years.
Third, foreign purchases of Canadian government bonds lead Canadian purchases of US shares by one month. Over June 2021 to June 2026, each dollar of non-resident buying of Canadian government bonds is followed the next month by about 41 cents of Canadian buying of US equities, with a p-value below 0.001. The relationship survives a second lag and the removal of the record April 2026 month. This is the statistical fingerprint of a portfolio swap: domestic institutions sell government paper to foreigners and redeploy the proceeds into American equities.
Fourth, the swap has matured into a standing allocation. Since 2025 the lagged coefficient has fallen to 0.17, while the autonomous component of Canadian US-equity buying has risen to about C$7.2 billion a month. Canadian money no longer needs a trigger to go south. A second channel has also appeared: a contemporaneous “double exit” in which foreign selling of Canadian shares coincides with Canadian buying of US shares. Its coefficient, insignificant before 2025, is now minus 0.38 and significant.
Fifth, the national balance sheet has become a large, one-directional bet. At the end of the second quarter of 2026, Canada was net long foreign currencies by about C$8.3 trillion, equivalent to some 241% of GDP, net long equities by C$3.5 trillion (about 102% of GDP), and net long US dollars by C$5.6 trillion (about 162% of GDP). The empirically measured exchange-rate sensitivity of the net international investment position has doubled in eighteen months, from C$32 billion to C$65 billion for each 1% move in the Canadian dollar.
Sixth, the natural hedge that is supposed to protect this position has broken down. In the textbook case, a global equity sell-off weakens the Canadian dollar, and the currency gain offsets part of the equity loss. Over the six quarters with complete data, that offset worked only three times. In the second quarter of 2026, exchange-rate and market effects pushed in the same direction.
Seventh, and most important, the ownership structure creates a split that no crisis plan currently addresses. The assets of this national fund are held privately, by pension funds, insurers and households. Its liabilities are increasingly public, concentrated in federal debt, where the non-resident share rose from 40.2% to 46.5% between January and July 2026. The private sector owns the upside; the public sector carries the funding risk. Returning the foreign share to its January level would require non-resident sales of roughly C$64 to 68 billion, about four times the record federal-debt divestment of August 2026.
The conclusion that follows is counterintuitive. Canada’s most dangerous external scenario is not a Canadian crisis, nor a classic global risk-off episode in which the loonie falls. It is a crisis that begins in the United States and weakens the US dollar at the same time as US equities fall. In that configuration the natural hedge reverses, the net international investment position can lose 40% of GDP or more, and the foreign holders of federal debt have both the motive and the precedent to step back. A Funding Fragility Index built for this article stood at its highest reading on record in June 2026.
1. Introduction: two records that are really one
In the first eight months of 2026, non-resident investors acquired C$161.6 billion of Canadian securities, compared with C$27.1 billion in the same period of 2025. Over the first half of the year they bought a record C$175 billion of Canadian debt securities, including C$80 billion of federal government debt. In April alone they acquired C$27.7 billion of federal bonds, the largest monthly figure ever recorded. By July, non-residents held 46.5% of outstanding federal government bonds, up from 40.2% at the start of the year.
Over the same period, Canadian investors purchased a record C$78.1 billion of US shares in the first half of 2026, more than double the C$35.1 billion of the first half of 2025, before selling an unprecedented C$31.0 billion in July and buying back C$28.9 billion in August.
These numbers have been reported, usually one release at a time and usually as two separate stories. The bond story is told as a vote of confidence in Canadian public finances, or, more anxiously, as a growing dependence on foreign creditors. The equity story is told as a matter of household and pension portfolio preferences, or as a sign that Canadian savers have lost faith in their own market. Neither framing asks the question that matters for macroeconomic stability: what kind of balance sheet do these two movements build when they happen together, and how does that balance sheet behave under stress?
This article argues that the two flows are linked statistically, that their combination has changed the nature of Canada’s external position, and that the change creates a specific vulnerability that is not visible in any single indicator. Section 2 describes the data and the reconstruction of the series. Section 3 documents the regime change in the volatility of flows. Section 4 applies extreme value theory to the August 2026 outflow. Section 5 identifies the swap mechanism linking foreign bond purchases and Canadian equity purchases. Section 6 moves from flows to stocks and measures the exposures of the national balance sheet. Section 7 shows why the traditional currency hedge has failed. Section 8 analyses the public-private split at the heart of the system. Section 9 builds a stress grid and a composite fragility index. Section 10 draws the conclusions.
2. Data and method
The core data come from Statistics Canada’s monthly survey of international transactions in securities (Table 36-10-0028-01), which records net portfolio purchases and sales of bonds, money market instruments and shares by non-residents in Canada and by Canadians abroad. Because the full table could not be downloaded directly for this study, the monthly series were reconstructed from the chart data tables published with each monthly release in The Daily. Three overlapping five-year windows were combined: the January 2021 release (covering November 2015 to November 2020), the January 2022 release (used for December 2020 to April 2021) and the July 2026 release (May 2021 to May 2026). The months of June, July and August 2026 were taken from the releases of 17 August, 17 September and 16 October 2026. Overlapping months were checked against each other; differences across vintages are small and reflect routine revisions. The reconstructed total for January to August 2026 is C$156.1 billion of foreign purchases, against an official cumulative figure of C$161.6 billion in the latest vintage, a gap that comes from revisions to earlier months and does not affect the results.
The detailed composition series, June 2021 to June 2026, cover foreign purchases of Canadian bonds by issuer (governments, government business enterprises and private corporations), foreign purchases of Canadian shares, and Canadian purchases of US and non-US shares. Each series was validated against the published Table 1 of the corresponding releases. For July and August 2026, only partial detail is available and these months are used for out-of-sample tests.
The stock data come from the quarterly international investment position releases, which decompose each change in the net position into financial transactions, revaluations due to market prices, revaluations due to exchange rates and other changes, and which report the currency and instrument composition of assets and liabilities.
Six methods are applied. Binary segmentation is used to locate structural breaks in rolling flows and in the variance of net flows. A two-state Markov-switching regression with regime-dependent mean and variance identifies volatility regimes. A generalized Pareto distribution, the standard tool of extreme value theory, models the tail of monthly net outflows. Ordinary least squares with heteroskedasticity- and autocorrelation-consistent standard errors, a vector autoregression and Granger causality tests are used to identify lead-lag relationships between flow components. Principal component analysis identifies common factors before and after 2025. Finally, a linear balance-sheet model translates equity and currency shocks into changes in the net international investment position. All values are in Canadian dollars. GDP ratios use the nominal GDP implied by Statistics Canada’s own external-debt ratio for the second quarter of 2026, about C$3.44 trillion.
3. A new volatility regime
Figure 1 shows twelve-month rolling sums of gross portfolio flows in both directions. Two features stand out. The first is the level of foreign purchases. The twelve-month total of non-resident purchases of Canadian securities reached C$295.6 billion in June 2026, above the previous peak of about C$288 billion in April 2022, and the highest value in the reconstructed series. The second is the amplitude of the swings. The foreign purchase line fell from above C$280 billion to below C$50 billion between 2022 and 2023, rose again to above C$190 billion in late 2024, collapsed during the first half of 2025 and then surged to its new record.

Simple averages make the point more precisely. From 2016 to 2019, the average monthly gross turnover of portfolio flows, measured as the sum of the absolute values of flows in each direction, was C$17.9 billion. In 2025 it was C$29.9 billion. In the first eight months of 2026 it was C$44.3 billion, two and a half times the pre-pandemic norm. The standard deviation of monthly net flows rose from C$14.0 billion in 2016 to 2019 to C$24.2 billion in 2025 and C$35.7 billion in 2026 so far.
Table 1. Portfolio flows by period, monthly averages, C$ billions
| Period | Foreign purchases of Canadian securities | Canadian purchases of foreign securities | Net flow | Std. dev. of net flow | Gross turnover |
|---|---|---|---|---|---|
| 2016 to 2019 | 8.8 | 3.9 | 4.9 | 14.0 | 17.9 |
| 2025 | 10.0 | 11.1 | -1.1 | 24.2 | 29.9 |
| Jan to Aug 2026 | 19.5 | 10.0 | 9.5 | 35.7 | 44.3 |
Gross turnover is the sum of the absolute values of flows in each direction. Source: author calculations on Statistics Canada data.
Structural break tests on twelve-month rolling sums locate the most recent break in both foreign purchases and net flows in April 2026, the month of the record federal bond purchase. Breaks in Canadian purchases of foreign securities cluster earlier, with the last in March 2024, consistent with the view that the outward equity movement started before the inward bond movement and that the latter came on top of an existing trend.
The Markov-switching model formalizes the change. It identifies two states. In the calm state, net flows average C$2.3 billion a month with a standard deviation of C$14.7 billion. In the turbulent state, they average C$11.5 billion with a standard deviation of C$27.4 billion. The turbulent state is not a state of outflows; it is a state of large flows in both directions, with a higher mean because foreign buying, when it comes, comes in very large blocks.
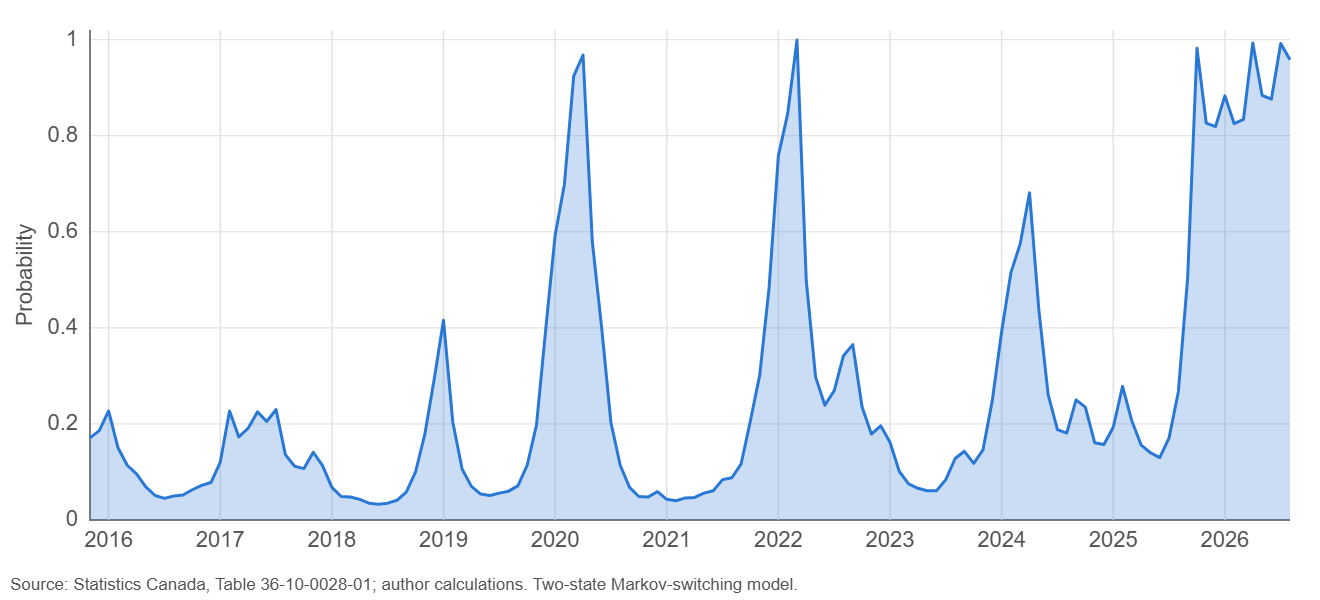
Figure 2 plots the smoothed probability of the turbulent state. From 2016 to 2019, it averaged 12%. It spiked during the pandemic, during the 2022 rate shock and in early 2024. Since January 2025, it has averaged 60%. Since November 2025, it has not fallen below 82% in any month, and it reached 99% in April and July 2026 and 96% in August. The model’s estimated expected duration of a turbulent spell, based on the full sample, is 4.9 months. The present spell has lasted ten months and shows no sign of ending.
This is the first original result of the study: the problem is not that Canada receives too much or too little foreign money, but that the flows have entered a regime of persistently high volatility, in which monthly movements of C$40 to 60 billion in either direction have become normal. A financial system that has adapted to a calm regime, through its liquidity buffers, its debt management practices and its central bank operating framework, is now living in a turbulent one.
4. August 2026: an impossible month
In August 2026, non-residents sold C$17.3 billion of Canadian securities, their first net divestment of the year, driven by a record C$17.5 billion reduction in their holdings of federal government debt. In the same month Canadians bought C$23.9 billion of foreign securities, including C$28.9 billion of US shares. The resulting net outflow, C$41.2 billion, is the largest in the 130-month series.
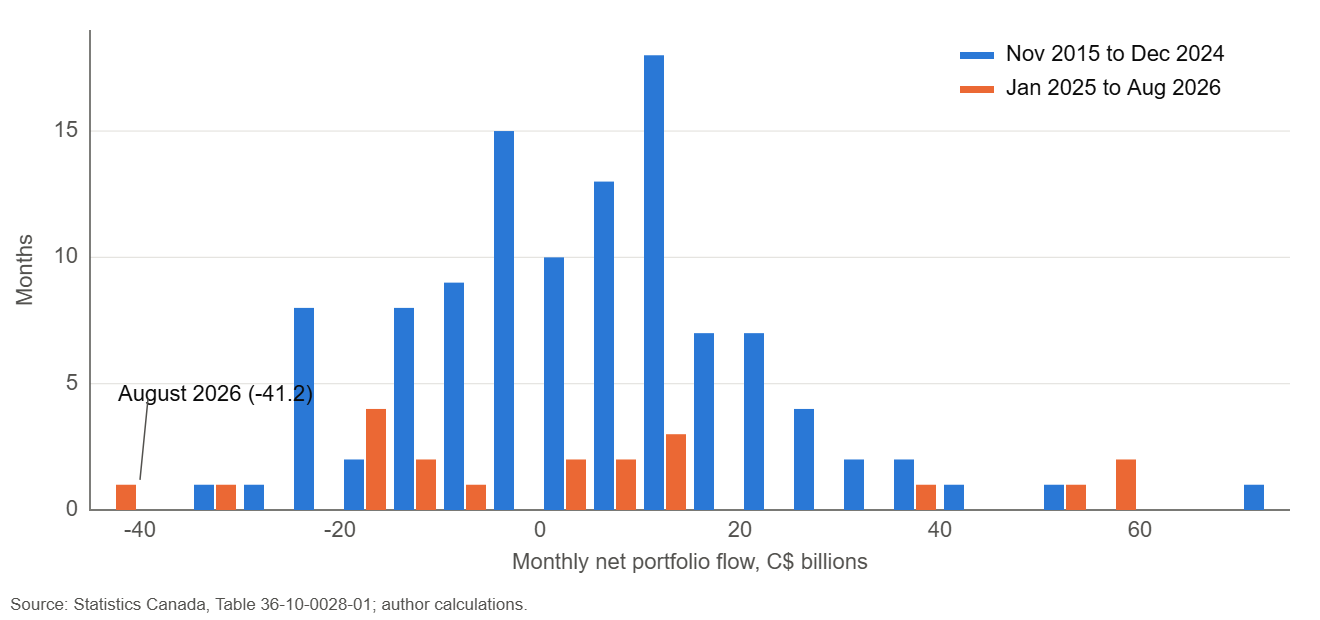
Figure 5 compares the distribution of net flows before and after January 2025. The post-2025 distribution is not shifted; it is stretched. It has more mass in both tails, including four months with net inflows above C$50 billion and two months with net outflows above C$30 billion.
To assess how extreme August 2026 really was, a generalized Pareto distribution was fitted to monthly net outflows exceeding the 80th percentile, first on the pre-2025 sample and then on the full sample. The pre-2025 fit produces a negative shape parameter of minus 0.56. In extreme value theory, a negative shape parameter means the tail is bounded: there is a finite maximum beyond which outcomes have zero probability. For the pre-2025 regime, that maximum is about C$35.6 billion. August 2026 exceeds it. Under the statistical regime that prevailed for nine years, the month that just happened could not happen.
When the turbulent months are added and the model re-estimated on the full sample, the tail remains bounded but widens, and the estimated probability of a month at least as bad as August 2026 becomes about 0.19%, a return period of roughly 530 months, or 44 years. The model, in other words, still regards August as extraordinary even after learning from it. The 99% value-at-risk of monthly net outflows rose from C$30.5 billion in the pre-2025 fit to C$35.3 billion in the full-sample fit.
Table 2. Extreme value model of monthly net outflows (generalized Pareto, threshold at 80th percentile)
| Sample | Threshold (C$ bn) | Shape parameter | Scale | Probability of a month worse than Aug 2026 | 99% VaR (C$ bn) |
|---|---|---|---|---|---|
| Nov 2015 to Dec 2024 | 8.7 | -0.56 | 15.1 | Zero (bounded tail, max about 35.6) | 30.5 |
| Nov 2015 to Aug 2026 | 11.3 | -0.34 | 12.8 | 0.19% per month (about 44 years) | 35.3 |
A negative shape parameter implies a finite upper bound equal to the threshold plus scale divided by the absolute shape. Source: author calculations.
The policy meaning is direct. Any stress-testing framework calibrated on pre-2025 data, whether by a bank treasury, a pension fund or a public debt manager, would have assigned zero probability to the August outflow. The tail of the distribution has moved, and the calibrations that rely on history have not.
5. The swap: how bond inflows become equity outflows
Why would foreign purchases of Canadian bonds and Canadian purchases of US equities be connected? Accounting provides part of the answer. When a foreign central bank, pension fund or asset manager buys a Government of Canada bond in the secondary market, a Canadian holder sells it. That seller, typically a domestic bank, insurer, pension fund or asset manager, receives Canadian dollars and must decide what to do with them. If its strategic allocation favours foreign equities, and if US technology shares are delivering returns that Canadian equities do not, part of the proceeds flows south. The foreign bond inflow and the domestic equity outflow are then two legs of the same transaction chain.
Contemporaneous correlations do not reveal this mechanism. Over June 2021 to December 2024, the same-month correlation between foreign purchases of government bonds and Canadian purchases of US shares was 0.09; after 2025, it was minus 0.22. But redeployment takes time. When the series are lagged, the relationship appears with unusual clarity.
Table 3. Canadian purchases of US shares explained by lagged foreign purchases of Canadian government bonds
| Variable | Full sample (Jul 2021 to Jun 2026) | Before 2025 | 2025 to Jun 2026 |
|---|---|---|---|
| Constant | 0.04 (p=0.980) | -1.35 (p=0.376) | 7.23 (p=0.000) |
| Foreign purchases of government bonds, t-1 | 0.41 (p=0.000) | 0.42 (p=0.000) | 0.17 (p=0.082) |
| Canadian purchases of US shares, t-1 | 0.07 (p=0.407) | 0.00 (p=0.994) | -0.10 (p=0.440) |
| Foreign purchases of Canadian shares, t | -0.30 (p=0.112) | -0.18 (p=0.501) | -0.38 (p=0.020) |
| Observations / R-squared | 60 / 0.19 | 42 / 0.12 | 18 / 0.20 |
OLS with HAC standard errors (3 lags). VAR Granger test, government bonds to US shares: p = 0.0014 (1 lag), 0.0014 (2 lags), 0.0034 excluding April 2026. Source: author calculations.
Table 3 reports regressions of Canadian purchases of US shares on the previous month’s foreign purchases of Canadian government bonds, controlling for the previous month’s US-equity purchases and the current month’s foreign purchases of Canadian shares. Over the full sample of 60 months, the coefficient on lagged government bond inflows is 0.41 with a p-value of 0.0001. A vector autoregression on four flow components confirms that government bond inflows Granger-cause US-equity outflows (p = 0.0014). The result holds with two lags (p = 0.0014) and when the record month of April 2026 is excluded (p = 0.0034). Reverse causality is weaker: the test that US-equity purchases lead government bond inflows gives p = 0.053. Foreign purchases of private corporate bonds and of Canadian shares do not lead US-equity purchases. Only government bonds do.
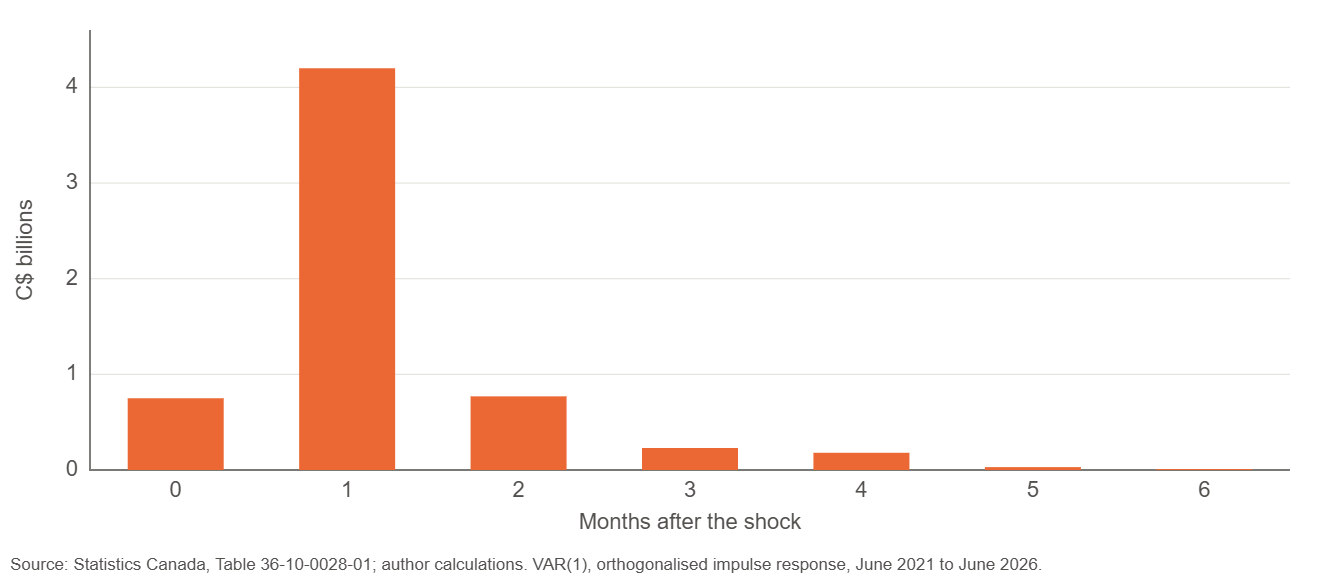
Figure 4 shows the impulse response. A one-standard-deviation shock to foreign purchases of Canadian government bonds produces almost nothing in the same month, about C$4.2 billion of additional Canadian US-equity purchases the following month, and a fading tail afterwards. The one-month delay is consistent with institutional decision cycles: rebalancing committees, mandate allocations and monthly cash deployment.
This lead-lag relationship is, to our knowledge, not documented in published analysis of Canadian portfolio flows. It suggests that the record foreign appetite for federal debt has not simply financed the federal deficit. It has also financed, at one remove, the transfer of Canadian savings into American equity markets. Roughly 41 cents of each dollar of foreign government-bond buying has reappeared, one month later, as Canadian buying of US shares.
The relationship has evolved. In the post-2025 subsample of 18 months, the lagged coefficient falls to 0.17 (p = 0.08), while the constant rises to C$7.2 billion a month and becomes highly significant. Canadian buying of US equities has acquired a large autonomous component. It no longer needs to be triggered by a bond sale; it has become a standing allocation that proceeds month after month. At the same time a new contemporaneous channel appears. The coefficient on same-month foreign purchases of Canadian shares, insignificant before 2025, becomes minus 0.38 (p = 0.02). When foreigners sell Canadian shares, Canadians buy US shares in the same month. The correlation between the two series moved from minus 0.10 before 2025 to minus 0.40 after.
This “double exit” is confirmed by principal component analysis. Before 2025 the first principal component of the five flow series is essentially a measure of Canadian appetite for foreign equities, with high loadings on US and non-US equity purchases. After 2025 the first component changes nature: it loads positively on Canadian US-equity purchases (0.61) and negatively on foreign purchases of Canadian shares (minus 0.58) and of government bonds (minus 0.43). It is a Canada equity exit factor, explaining a third of the variance of the system, in which domestic and foreign equity investors move away from Canadian equities at the same time.
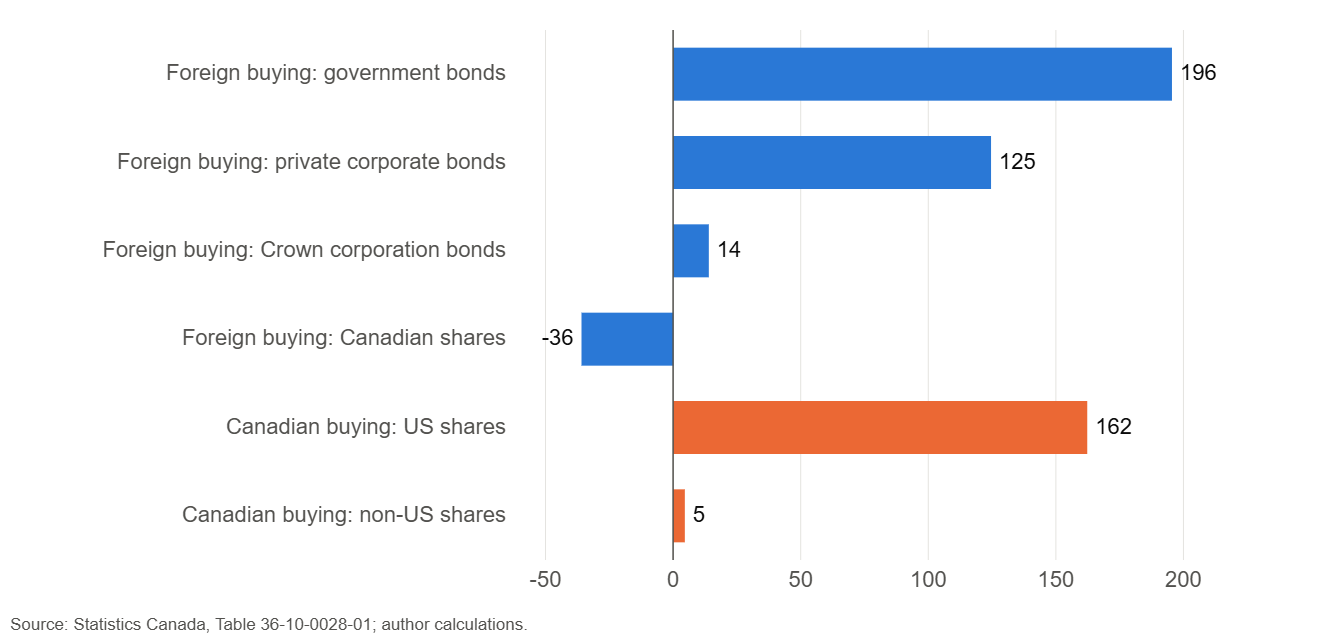
Figure 3 summarizes the cumulative result. Between January 2025 and June 2026, foreigners bought C$196 billion of Canadian government bonds, C$125 billion of private corporate bonds and C$14 billion of Crown corporation bonds, and sold C$36 billion of Canadian shares. Canadians bought C$162 billion of US shares and only C$5 billion of non-US shares. The United States absorbed 97% of Canadian net foreign equity buying. The trade-diversification policy of the federal government has no counterpart in the portfolio decisions of Canadian savers.
The share of government bonds in twelve-month foreign inflows tells the same story from the other side. It was 27% at the end of 2023. It reached 63% at the end of 2024 and stood at 59% in June 2026. Foreign money is coming to Canada mainly to lend to its governments, not to own its companies.
The model also offers a useful out-of-sample test. Fitted on data through June 2026, it predicts Canadian purchases of US shares of about C$8.4 billion for July 2026. The actual figure was a sale of C$31.0 billion, a forecast error of nearly C$40 billion, larger than three standard deviations of the residuals. July 2026 was not the swap at work; it was a discretionary de-risking decision, concentrated in large technology shares, that the flow structure alone could not anticipate. The swap channels Canadian savings toward US equities in normal months. It does not prevent Canadian investors from pulling back abruptly when they choose to.
6. From flows to stocks: the national carry fund
Flows accumulate into positions, and positions are what matter in a crisis. The international investment position at the end of the second quarter of 2026 shows international assets of C$12.39 trillion and liabilities of C$10.44 trillion, for a net foreign asset position of about C$1.95 trillion. The headline is reassuring: Canada is a large net creditor to the rest of the world. The composition is less so.
Statistics Canada reports that 97.1% of Canada’s international assets are denominated in foreign currencies, 66.7% in US dollars, while only 35.8% of liabilities are, 25.9% in US dollars. Equities account for 69.8% of assets and 49.3% of liabilities. Applying these shares to the totals gives the net exposures of the national balance sheet, which have not, as far as we know, been published in this form.
Table 4. Net exposures of the national balance sheet
| Quarter end | Net foreign-currency position | Net equity position | Net US-dollar position |
|---|---|---|---|
| 2025 Q4 | C$7.53 tn (219% of GDP) | C$3.26 tn (95% of GDP) | C$5.03 tn (146% of GDP) |
| 2026 Q1 | C$7.42 tn (216% of GDP) | C$2.84 tn (83% of GDP) | not published |
| 2026 Q2 | C$8.29 tn (241% of GDP) | C$3.50 tn (102% of GDP) | C$5.56 tn (162% of GDP) |
Computed from total assets and liabilities and their published currency and instrument shares. GDP ratios use Q2 2026 nominal GDP of about C$3.44 trillion. Source: author calculations on Statistics Canada data.
At the end of the second quarter of 2026, Canada was net long foreign currencies by about C$8.29 trillion, or 241% of GDP. It was net long equities by about C$3.50 trillion, or 102% of GDP. Its net long position in US dollars alone was about C$5.56 trillion, or 162% of GDP. Six months earlier, at the end of 2025, the net foreign-currency position was C$7.53 trillion, or 219% of GDP. The exposure has grown by more than twenty percentage points of GDP in two quarters.
Structurally, this is the balance sheet of a leveraged investment fund. On the liability side it issues mostly Canadian-dollar fixed income, a growing share of which is federal debt held by non-residents. On the asset side it holds mostly foreign-currency equities, overwhelmingly American. It earns the equity risk premium and the return on foreign currency, and pays a fixed income cost. In good years, such as 2024 when the net position rose by C$467.9 billion, the fund prospers. In bad quarters it can lose hundreds of billions: C$310.8 billion in the first quarter of 2026 alone.
The quarterly revaluation accounts allow these exposures to be cross-checked empirically. In the second quarter of 2026, US equities rose about 14.9% and the net position gained C$495.8 billion from market prices, an implied equity sensitivity of about C$33 billion per percentage point of US equity return, consistent with a net equity exposure of C$3.5 trillion. In the same quarter the Canadian dollar fell 1.9% against the US dollar and the net position gained C$123.7 billion from exchange rates.

Dividing each quarter’s exchange-rate revaluation by the change in the Canadian dollar against the US dollar gives an empirical exchange-rate delta for the country. Figure 6 shows that it was about C$32 billion per percentage point in the fourth quarter of 2024, about C$51 to 52 billion through the second half of 2025 and the first quarter of 2026, and about C$65 billion in the second quarter of 2026. The currency sensitivity of Canada’s external wealth has doubled in eighteen months. A 1% appreciation of the Canadian dollar now removes some C$65 billion from national net wealth held abroad, roughly 1.9% of GDP. (The measure uses only the bilateral US dollar rate and therefore slightly overstates the sensitivity when other currencies move in the same direction, but the trend is unambiguous.)
The geography of the position reinforces the diagnosis. Canada’s net foreign asset position with the United States alone stood at about C$1.67 trillion at the end of the second quarter of 2026, up C$418.5 billion in a single quarter, after a fall of C$120.5 billion in the first quarter to C$1.26 trillion. Its net position with the rest of the world was only C$277.7 billion, and had fallen to C$96.9 billion at the end of the first quarter, the lowest level since 2022. In other words, roughly 85% of Canada’s net external wealth is a claim on the United States, and almost all of the quarter-to-quarter volatility of that wealth comes from American asset prices and the US dollar. The quarterly swings are now of a size normally associated with commodity cycles: minus C$310.8 billion in one quarter, plus C$619.2 billion in the next, the latter the largest quarterly increase ever recorded. A movement of C$600 billion in national net wealth is equivalent to about 18% of annual GDP, gained or lost in three months without any change in Canadian production.
There is an instructive contrast with the trade side. The federal government’s strategy aims to double non-US exports and to reduce Canada’s commercial dependence on the American market. On the capital side, the dependence has been rising. Canadian savers increased the share of the United States in their foreign equity buying to 97% over January 2025 to June 2026, and the net position vis-a-vis the United States has grown faster than the position with the rest of the world in every quarter of strong US equity markets. A country that seeks to diversify its customers has concentrated its savings. This is not a contradiction that policy has caused, since portfolio allocation is a private decision, but it is one that policy has not yet recognised.
7. The broken hedge
Canada’s large foreign-currency position has long been considered a strength rather than a risk, because of a reliable natural hedge. When global markets fall, investors seek safety, the US dollar rises, and the Canadian dollar, a commodity and risk-sensitive currency, falls. A fall in the loonie raises the Canadian-dollar value of foreign assets, offsetting part of the equity loss. The national balance sheet is, in effect, short its own currency in a way that pays off in bad times.
The quarterly data since the start of 2025 show that this mechanism can no longer be taken for granted.
Table 5. Market and exchange-rate revaluations of the net international investment position, C$ billions
| Quarter | Market prices | Exchange rates | CAD vs USD | Did the currency offset the market move? |
|---|---|---|---|---|
| 2025 Q1 | -180.1 | +42.6 | n.a. | Yes (24%) |
| 2025 Q2 | +259.4 | -212.9 | rose | Yes (82%) |
| 2025 Q3 | +16.7 | +106.3 | -2.1% | No, same sign |
| 2025 Q4 | -46.9 | -83.4 | +1.6% | No, losses added |
| 2026 Q1 | -380.5 | +88.8 | -1.7% | Yes (23%) |
| 2026 Q2 | +495.8 | +123.7 | -1.9% | No, same sign |
Source: Statistics Canada international investment position releases; author calculations.
In three of the six quarters for which both components are available, the exchange-rate effect offset the market effect, as the textbook predicts. In the first quarter of 2025 the offset covered 24% of the market loss; in the second quarter of 2025, 82% of the market gain; in the first quarter of 2026, 23% of the market loss. But in the other three quarters the two effects moved together. In the third quarter of 2025, both were positive. In the fourth quarter of 2025, both were negative: market prices removed C$46.9 billion and exchange rates another C$83.4 billion as the Canadian dollar rose 1.6%. In the second quarter of 2026, both were strongly positive.
The reason is that the correlation between US equity returns and the Canadian dollar is not a structural constant. It depends on the nature of the shock. A global risk-off episode driven by fear of recession lifts the US dollar and depresses the loonie: the hedge works. But an episode driven by doubts about the United States itself, its fiscal trajectory, its trade policy, its institutions, can depress US equities and the US dollar at the same time. In that case the Canadian dollar rises against the US dollar while US equities fall, and the national balance sheet loses on both legs.
The past two years have shown that this second type of shock is no longer hypothetical. Episodes of simultaneous weakness in US equities and the US dollar, widely described in financial markets as “sell America” moments, have occurred repeatedly since the spring of 2025. Canada’s external balance sheet, more concentrated on US dollar equities than ever, is precisely the portfolio that suffers most in such episodes.
8. Private long, public short
The national fund described above has an unusual governance. Its assets and its liabilities are not held by the same people.
The foreign equity assets are held overwhelmingly by the private sector: large public pension plans, private pension funds, insurers, mutual funds and households, through their retirement and tax-free savings accounts. The liabilities that have grown fastest are public. Non-residents held 46.5% of outstanding federal government bonds in July 2026, up from 40.2% in January and from a low of 27.0% in the first quarter of 2021. Canada’s gross external debt reached C$5.05 trillion in the second quarter of 2026, or 146.9% of GDP, and the government sector’s share rose by C$98.5 billion in that quarter alone.
This creates a split that we summarize as private long, public short. In a crisis, the private sector absorbs the valuation loss on foreign equities, but it is not obliged to bring money home, and the Canadian state has no claim on its foreign assets. The public sector, for its part, must continue to refinance its debt in a market where nearly half of the federal bond stock is held by investors who have no domestic attachment and who demonstrated in August 2026 that they can sell C$17.5 billion in a single month. The strength of the national balance sheet in aggregate offers little direct protection to the federal funding position.
The scale of the foreign position can be estimated from the published figures. If non-residents’ share of federal bonds rose by 6.3 percentage points between January and July 2026 while they bought roughly C$80 to 87 billion of federal debt, and if net federal bond issuance over the period was between C$30 and 50 billion, the implied stock of federal bonds in the reference base is between about C$1.01 and 1.09 trillion. On that base, a return of the non-resident share to its January level of 40.2% would require net foreign sales of roughly C$64 to 68 billion. That is about four times the record August 2026 divestment of federal debt.
Table 6. Implied federal bond stock and size of a reversal to January 2026 ownership
| Non-resident purchases, Jan to Jul (C$ bn) | Net issuance assumed (C$ bn) | Implied bond stock (C$ bn) | Sales needed to return to 40.2% (C$ bn) |
|---|---|---|---|
| 80 | 30 | 1048 | 66 |
| 87 | 40 | 1086 | 68 |
| 87 | 50 | 1012 | 64 |
Solves 0.465 x (S + N) – 0.402 x S = P. Approximate; book-value figures may differ. Source: author calculations.
Who would absorb such sales? The natural buyers are the domestic institutions that sold their bonds to foreigners in the first place and redeployed the proceeds abroad. To buy back, they would need to repatriate foreign assets, which in a falling US market means crystallising losses, or to shift allocations away from equities they have chosen to hold. Neither happens quickly. The Bank of Canada can provide liquidity, but large-scale bond purchases would conflict with its anti-inflation stance at a time when it has just raised its policy rate. The adjustment would therefore probably go through price: higher federal yields, wider provincial spreads and a weaker Canadian dollar. The swap that worked smoothly on the way in would be costly to reverse.
9. Stress grid and Funding Fragility Index
To bring these elements together, the study builds two tools.
The first is a stress grid. Using the second-quarter 2026 balance-sheet composition, it translates combinations of a global equity shock and a change in the Canadian dollar into a change in the net international investment position, expressed in percent of GDP. The model is linear and deliberately simple: it applies the equity shock to the net equity position and the currency change to the net foreign-currency position, ignoring second-round effects and the response of bond prices.
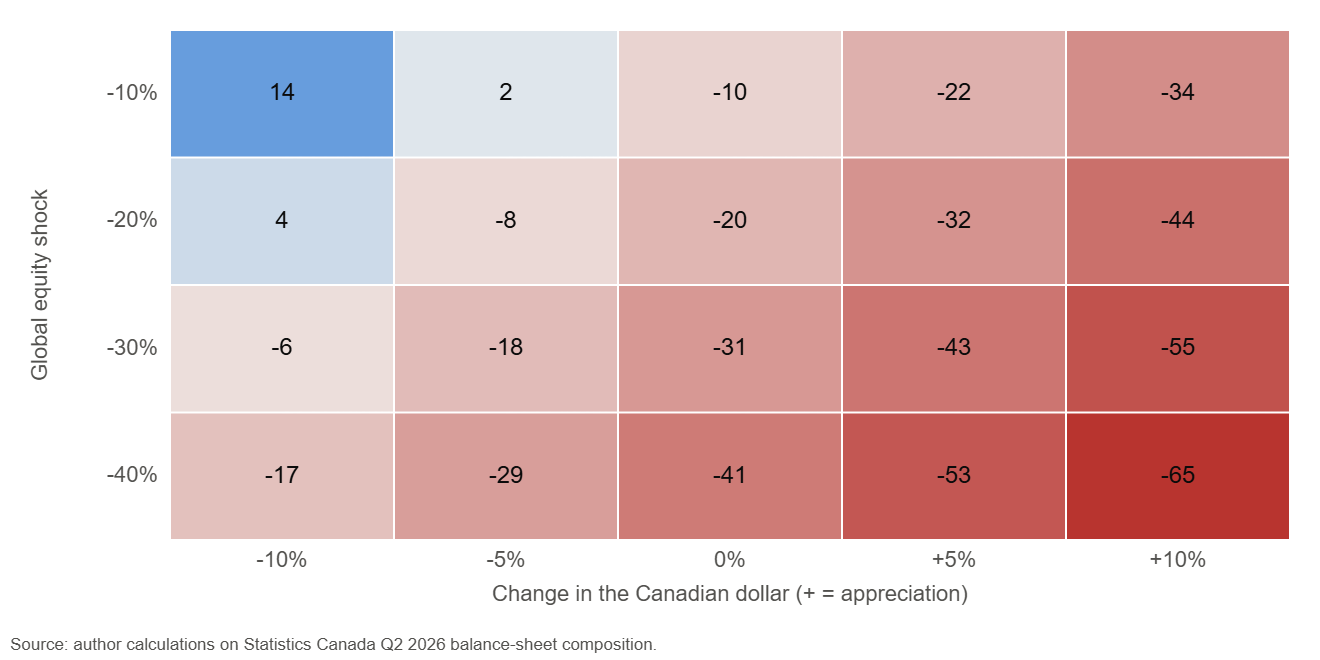
Figure 7 reveals a sharp asymmetry. In the classic risk-off scenario, a 20% equity decline with a 10% fall in the Canadian dollar, the net position actually rises by about 4% of GDP: the hedge more than compensates. In a neutral currency scenario, the same equity decline costs about 20% of GDP. But in a US-centred crisis in which equities fall 30% and the Canadian dollar rises 5% against a weakening US dollar, the net position falls by about 43% of GDP. With a 40% equity fall and a 10% Canadian dollar appreciation, the loss reaches 65% of GDP. Losses of this magnitude would not make Canada a net debtor, given the starting point of a net creditor position of 57% of GDP, but they would eliminate most of the country’s net external wealth and would fall almost entirely on Canadian pension and household savings.
The second tool is a Funding Fragility Index. It combines four standardized twelve-month indicators: foreign purchases of Canadian government bonds (a measure of funding concentration), Canadian purchases of US shares (outward equity concentration), foreign sales of Canadian shares (equity exit) and the volatility of monthly net flows. The index is a simple average of the four z-scores, so that each component carries equal weight.

Figure 8 shows the index from mid-2022, when the full twelve-month windows are available, to June 2026. It rose from about minus 0.8 in mid-2022 to around zero at the start of 2024, eased in mid-2025, then climbed sharply to 1.24 in June 2026, its highest reading in the sample. Each of the four components contributes to the rise, which means the deterioration is not a statistical artefact of a single series but a joint movement of concentration, exit and volatility.
10. Conclusions
This study set out to treat two widely reported records, foreign buying of Canadian bonds and Canadian buying of US equities, as one system. The evidence supports five conclusions that, to our knowledge, have not been put forward elsewhere.
First, the two movements are statistically linked through a one-month lag. Foreign purchases of Canadian government bonds lead Canadian purchases of US equities, with about 41 cents of each dollar recycled. Record foreign demand for federal debt has, at one remove, financed the movement of Canadian savings into American equities. The fiscal story and the portfolio story are the same story.
Second, the relationship has moved from a swap to a standing allocation and has acquired a second channel, the double exit from Canadian equities by foreign and domestic investors. This means the outward equity flow will not stop if foreign bond buying slows. It has its own momentum.
Third, the flow system has entered a turbulent regime of unusual persistence, in which the August 2026 outflow, impossible under the previous regime, has become a plausible event. Risk models calibrated on pre-2025 history are miscalibrated.
Fourth, Canada’s external balance sheet now behaves like a leveraged fund that is long US dollar equities and short Canadian-dollar fixed income, with exposures of 102% of GDP in net equity and 241% of GDP in net foreign currency, and a currency sensitivity that has doubled in eighteen months. Its traditional natural hedge works only in global risk-off episodes and reverses in US-specific ones.
Fifth, the system is private long and public short. The gains and losses on foreign assets accrue to private savers; the refinancing risk on foreign-held liabilities accrues to the federal government. A reversal of foreign appetite for federal debt of the size implied by a return to January 2026 ownership levels would be about four times larger than the largest monthly sale on record, with no obvious domestic buyer ready to absorb it at current prices.
The policy implications follow from this diagnosis rather than from a list of general recommendations. Federal debt managers should treat the non-resident share of the bond stock as a risk variable, not a success indicator, and should consider lengthening the maturity of issuance while foreign demand remains strong, so that a future reversal affects secondary-market prices more than refinancing needs. Prudential supervisors should require that liquidity stress tests for banks and pension funds include scenarios built on the post-2025 flow distribution, in which monthly net outflows of C$40 billion or more are possible, and on the US-centred crisis in which the Canadian dollar rises as US equities fall. The Bank of Canada, which has raised its policy rate in October 2026, should recognise that its rate decisions now act on a balance sheet whose foreign-currency exposure amplifies the wealth effect of currency movements far more than in the past. And the federal government, whose trade policy aims to diversify Canada away from the United States, should note that the portfolio choices of Canadian savers are moving in exactly the opposite direction, with 97% of net foreign equity purchases going to American shares.
None of this signals an imminent crisis. Canada remains a large net creditor, its fiscal ratios remain among the strongest in the G7, and the flows documented here reflect, in part, the attractiveness of Canadian public debt to global investors. But strength in aggregate is not the same as resilience in composition. Canada has built, without deciding to, a national carry fund. Its managers are dispersed, its liabilities are increasingly public, and its main risk lies in a scenario, a crisis of confidence in the United States, that the country’s traditional hedges were not designed to cover.
Methodological notes and limitations
The monthly series combine several data vintages and are rounded to C$0.1 billion. The post-2025 subsample used for some regressions contains only 18 observations, so the post-2025 coefficients should be read as indicative. The Granger causality results establish temporal precedence, not structural causation; the swap mechanism proposed in Section 5 is the most plausible interpretation consistent with the accounting identity, but it cannot be verified without investor-level data. The balance-sheet exposures apply aggregate currency and instrument shares to aggregate totals and therefore ignore direct investment specificities and hedging by individual institutions, which may be substantial for large pension plans. The stress grid is linear and does not model the response of bond prices, credit spreads or monetary policy. The estimate of the federal bond stock is derived from published ownership shares and flow totals and could differ from the official book-value figure. GDP ratios use the GDP implied by Statistics Canada’s external-debt ratio for the second quarter of 2026.
Data appendix
Table A1 reproduces the monthly figures for the period on which the main findings of this article concentrate, so that readers can verify the calculations and extend them as new releases are published. The September 2026 data will be released by Statistics Canada on 17 November 2026 and will provide the first test of whether the August reversal marked the beginning of a sustained retreat by foreign holders of federal debt or a single month of profit-taking after an exceptional accumulation.
Table A1. Monthly portfolio flows used in the study, January 2025 to August 2026, C$ billions
| Month | Foreign purchases of Canadian securities | Canadian purchases of foreign securities | Net flow | Foreign purchases of government bonds | Canadian purchases of US shares |
|---|---|---|---|---|---|
| 2025-01 | 8.8 | -3.0 | 11.8 | 15.5 | -15.6 |
| 2025-02 | -10.5 | 23.9 | -34.4 | -11.1 | 29.9 |
| 2025-03 | -4.2 | 14.6 | -18.8 | 11.5 | 4.0 |
| 2025-04 | -11.3 | 3.3 | -14.6 | -11.4 | -1.3 |
| 2025-05 | -6.3 | 12.4 | -18.7 | 12.3 | 13.3 |
| 2025-06 | 0.9 | 8.0 | -7.1 | 1.4 | 4.7 |
| 2025-07 | 26.2 | 16.1 | 10.1 | 9.0 | 1.5 |
| 2025-08 | 23.6 | 18.3 | 5.3 | 10.7 | 16.0 |
| 2025-09 | 31.7 | 21.6 | 10.1 | -3.2 | 10.0 |
| 2025-10 | 48.4 | -11.5 | 59.9 | 21.1 | -6.5 |
| 2025-11 | 18.8 | 16.9 | 1.9 | 9.8 | 6.4 |
| 2025-12 | -5.8 | 13.1 | -18.9 | 11.4 | 21.7 |
| 2026-01 | 47.1 | 11.2 | 35.9 | 20.1 | 8.5 |
| 2026-02 | 5.6 | 25.2 | -19.6 | 11.1 | 29.2 |
| 2026-03 | 4.4 | 3.9 | 0.5 | 6.5 | 2.7 |
| 2026-04 | 46.9 | -11.4 | 58.3 | 42.6 | -1.6 |
| 2026-05 | 7.9 | 22.3 | -14.4 | 16.1 | 15.9 |
| 2026-06 | 40.8 | 35.4 | 5.4 | 22.1 | 23.5 |
| 2026-07 | 20.7 | -30.6 | 51.3 | 14.9* | -31.0 |
| 2026-08 | -17.3 | 23.9 | -41.2 | -9.6* | 28.9 |
* Federal plus provincial bonds only, from release text. Sources: Statistics Canada, Table 36-10-0028-01 and The Daily releases; reconstruction by the author.
About this series. This paper is the first in a ten-part series on the Canadian economy in 2026 published by Global Strategy Files. Forthcoming papers examine interprovincial trade barriers, youth unemployment, the contraction of international education, the travel boycott of the United States, electricity, hydrology and data centres, the auto and steel deindustrialisation risk, the fibre constraint in softwood lumber, potash as strategic leverage, and provincial credit risk and the Alberta vote.
Sources
Statistics Canada, The Daily: Canada’s international transactions in securities, monthly releases from January 2021 to October 2026, including chart data tables, and Table 36-10-0028-01.
Statistics Canada, The Daily: Canada’s international investment position, quarterly releases for the fourth quarter of 2024 to the first quarter of 2026, and Tables 36-10-0454-01 and 36-10-0485-01.
Statistics Canada, Canada’s international investment position, second quarter 2026, as reported by Wealth Professional Canada, September 2026.
Wealth Professional Canada and Advisor.ca, reports on the July and August 2026 securities releases, September and October 2026.
National Bank Financial, Market View notes on non-resident ownership of Government of Canada bonds, 2026.
Bank of Canada, policy rate announcement of 28 October 2026.
Driss EFFINA, PhD / Independent Researcher, Global Strategy Files
The opening pages of our four country reports: United States, United Kingdom, Japan and China. A free PDF, sent to your inbox.
You will also receive occasional analysis from Global Strategy Files. Unsubscribe in one click, at any time.