
Brazil’s Agricultural Powerhouse in 2026: Record Harvests, Land Expansion and the Limits of Growth

Brazil’s Agricultural Powerhouse in 2026: Record Harvests, Land Expansion and the Limits of Growth
Driss EFFINA, PhD Independent Researcher, Global Strategy Files Reading time: about 25 minutes
Key takeaways
- Brazil harvested 361.7 million tonnes of grains in 2025/26 according to Conab, and the first 2026/27 forecast points to 367.1 million tonnes.
- Between 2018/19 and 2025/26 grain output rose 46.6 percent, but about 72 percent of the growth came from additional land.
- Yields are weather sensitive, falling about 8 percent in the 2023/24 drought before rising 13 percent the following season.
- Agriculture grew 11.7 percent in 2025 and contributed about a third of Brazil's GDP growth.
Abstract
Brazil harvested 361.7 million tonnes of grains in the 2025/26 season, according to the final survey of the National Supply Company (Conab), and the first forecast for 2026/27, published in October 2026, points to a new record of 367.1 million tonnes. The Brazilian Institute of Geography and Statistics (IBGE) estimates the 2026 calendar year harvest at a record 354.5 million tonnes. Agriculture grew by 11.7 percent in 2025, the strongest of all sectors, and contributed about a third of national GDP growth. This article uses Conab and IBGE data, together with official trade figures, to examine the sources and limits of this performance. The author decomposes production growth into area and yield effects, measures the volatility of yields, quantifies the concentration of production and exports, and builds scenarios for 2030/31. Between 2018/19 and 2025/26, grain production rose by 46.6 percent, but planted area rose by 31.9 percent and average yield by only 11.1 percent: about 72 percent of the growth came from additional land, some 20 million hectares. Yields are highly sensitive to weather, falling by about 8 percent in the drought-affected 2023/24 season before rising by 13 percent the following year. Soybeans and corn account for almost 90 percent of the harvest, about two thirds of the soybean crop is exported, and China absorbs a third of agribusiness exports. At the same time, Brazil depends on imports for more than half of its wheat consumption. The article concludes that the next stage of Brazilian agricultural growth must rely more on productivity and less on land, both for economic and environmental reasons, and that climate risk has become the main source of uncertainty.
Keywords: Brazil, agriculture, grains, soybeans, corn, Conab, IBGE, productivity, land use, exports, climate risk
JEL codes: Q11, Q15, Q17, Q54, O13, O54
1. Introduction
Fifty years ago, Brazil was a net importer of food. Today it is the world’s largest exporter of soybeans, coffee, sugar, beef, chicken and orange juice, and one of the largest exporters of corn and cotton. This transformation, often described as a “tropical agricultural revolution”, was built on research by the Brazilian Agricultural Research Corporation (Embrapa), which adapted crops to the acidic soils of the Cerrado savannah, on the expansion of the agricultural frontier towards the centre-west and the north, and on the entrepreneurship of farmers who adopted no-till farming, double cropping and modern inputs.
The 2025/26 season confirmed this strength. According to Conab’s final survey, grain production reached 361.7 million tonnes, 2.6 percent more than in 2024/25, with record soybean (180.4 million tonnes) and cotton crops. The first survey of the 2026/27 season, published in October 2026, projects 367.1 million tonnes, a further increase of 1.4 percent. IBGE’s systematic survey of agricultural production estimates the 2026 calendar year harvest at 354.5 million tonnes, also a record. Agriculture was the main engine of GDP growth in 2025, with growth of 11.7 percent, and it continued to grow in 2026.
But behind the records lie questions that are less often asked. How much of the growth comes from higher productivity and how much from additional land? How vulnerable is production to climate? How concentrated is it in a few crops and a few buyers? And what can be expected for the rest of the decade?
This article addresses these questions with official data from Conab and IBGE and the author’s own calculations. Section 2 presents the context. Section 3 reviews the literature. Section 4 describes the data and methods. Section 5 presents the results. Section 6 discusses them. Section 7 presents scenarios. Section 8 concludes.
2. Context
2.1 Two official sources
Brazil has two official sources of crop statistics, which follow different calendars and methods. Conab, a public company under the Ministry of Agriculture, publishes monthly surveys for each crop season, which runs from September of one year to August of the next, and covers the first, second and third crops of corn and beans, as well as winter crops such as wheat. IBGE publishes the Systematic Survey of Agricultural Production (LSPA), which estimates production for the calendar year, and the annual Municipal Agricultural Production survey (PAM). The two sources generally agree on trends but differ in levels. For 2026, the IBGE estimate (354.5 million tonnes for the calendar year) is about 2 percent below Conab’s estimate for the 2025/26 season (361.7 million tonnes). This article uses Conab’s seasonal series as its main source and IBGE for the calendar year view and the national accounts.
2.2 The double cropping system
A distinctive feature of Brazilian agriculture is double cropping. In the centre-west and parts of the south and north, farmers plant soybeans at the start of the rainy season, around October, and harvest them in January or February; they then immediately plant a second crop of corn, the “safrinha”, which is harvested in the dry season. The second corn crop now accounts for most of Brazilian corn production: 112.1 million tonnes out of 144 million in 2025/26, according to Conab. Double cropping increases the output per hectare of land per year, but it also makes the second crop vulnerable to the timing of the rains.
2.3 The macroeconomic weight of agriculture
Agriculture in the strict sense (crops and livestock) represents a modest share of GDP, about 7 percent of value added. But the broader agribusiness sector, including inputs, processing and services, is much larger, and its weight in exports is decisive. In 2025, agribusiness exports reached a record US$169.2 billion, 48.5 percent of all Brazilian exports, according to the Ministry of Agriculture. The agricultural trade surplus, about US$149 billion, is the main source of Brazil’s foreign exchange.
In 2025, IBGE reported that agricultural GDP grew by 11.7 percent, driven by record corn and soybean crops, compared with 1.4 percent for industry and 1.8 percent for services. In the first half of 2026, agriculture grew by 3.6 percent year on year, and by 6.8 percent in the second quarter alone.
3. Literature review
The literature on Brazilian agriculture has focused on three questions: the sources of productivity growth, the relationship between agricultural expansion and land use, and the vulnerability to climate.
On productivity, Gasques, Bastos, Valdes and Bacchi (2012) estimated total factor productivity in Brazilian agriculture and found that it grew rapidly from the 1970s onwards, explaining most of the growth of output. Rada (2013) analysed the “Cerrado miracle” and showed that productivity growth was particularly strong in the centre-west. The World Bank study by Arias, Vieira, Contini, Farinelli and Morris (2017) confirmed that productivity had been the main driver of agricultural growth, but warned that productivity growth was slowing and becoming more unequal between regions and farm sizes.
On land use, Lapola and co-authors (2014) described the “pervasive transition” of the Brazilian land use system, in which the expansion of crops took place largely on former pastures, reducing pressure on forests, while the intensification of livestock farming made this possible. However, the relationship between agricultural expansion and deforestation remains a central issue, particularly in the Cerrado and the Amazon.
On climate, Rattis and co-authors (2021) showed that rising temperatures and changes in rainfall in the agricultural frontier of Mato Grosso are pushing an increasing share of the region outside the optimal climatic zone for double cropping. This research is directly relevant for the volatility of yields observed in recent seasons.
International institutions, including the OECD and FAO in their joint Agricultural Outlook, project that Brazil will continue to increase its share of world agricultural exports over the next decade, but highlight the importance of productivity gains and sustainable land use.
This article contributes by measuring the respective roles of area and yield in recent growth, using the latest Conab data, and by quantifying the concentration of production and the exposure to climate shocks.
4. Data and methodology
4.1 Sources
The analysis uses:
- Conab’s crop surveys: the final (twelfth) surveys of each season and the first survey of the 2026/27 season, for total grain production, planted area and the main crops;
- IBGE’s LSPA for September 2026, for the calendar year 2026 estimate;
- IBGE’s national accounts for agricultural GDP;
- the Ministry of Agriculture’s agribusiness trade statistics for 2025.
Because Conab revises its figures for previous seasons, the series uses the latest available value for each season: the values published in the surveys of 2022 (for 2018/19 to 2021/22, with 2021/22 updated in 2024), 2025 (for 2022/23 and 2023/24) and the values implied by the 2026 surveys for 2024/25 and 2025/26.
4.2 Decomposition
Production is the product of planted area and average yield. The change in production between two seasons can therefore be decomposed exactly, in logarithms, into an area effect and a yield effect: ln(P1/P0) = ln(A1/A0) + ln(Y1/Y0). The author applies this decomposition to each season and to the whole period from 2018/19 to 2025/26.
4.3 Concentration and external dependence
The author computes the share of soybeans and corn in total grain production, the share of the soybean crop that is exported, the share of China in agribusiness exports, the implied average export price of soybeans (value divided by volume), and the dependence on imports for wheat (imports divided by the sum of imports and production).
4.4 Scenarios
Three scenarios for grain production to 2030/31 are constructed by applying assumptions for annual growth of area and yield to Conab’s 2026/27 forecast.
4.5 Limitations
The average yield of all grains is affected by the composition of crops: an increase in the share of corn, which has higher yields per hectare in tonnes, raises the average. The decomposition therefore attributes part of the composition effect to yields. Area figures refer to planted area, which counts double cropped land twice. The scenarios are illustrative.
5. Results
5.1 A decade of records
Figure 1 shows grain production and planted area since 2018/19.
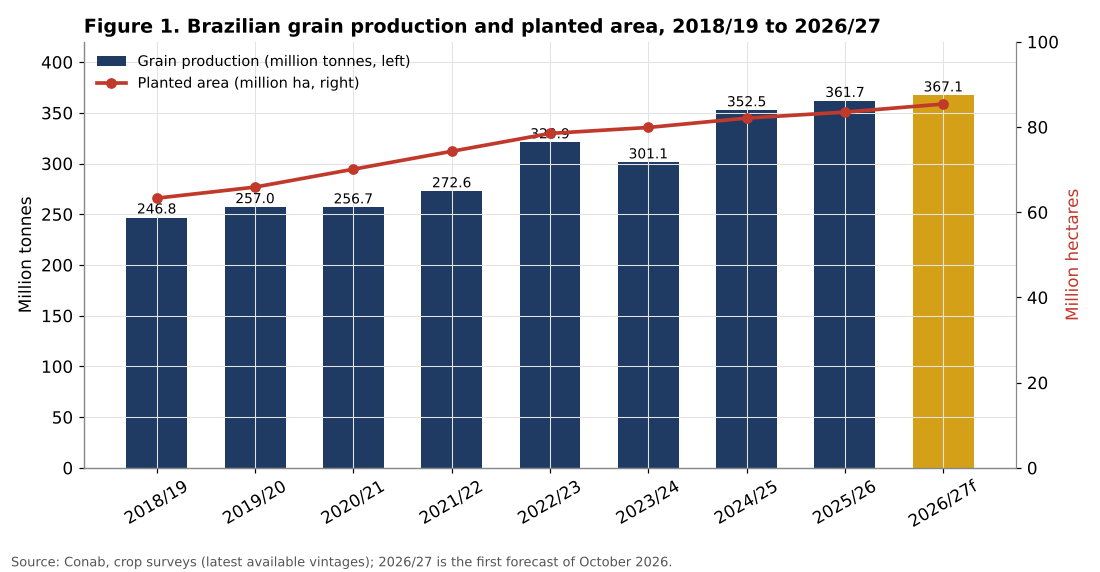
Grain production rose from 246.8 million tonnes in 2018/19 to 361.7 million tonnes in 2025/26, an increase of 46.6 percent in seven seasons, or an average of 5.6 percent per year. Planted area rose from 63.3 to 83.5 million hectares, an increase of 31.9 percent, or 20.2 million hectares, an area larger than the territory of many European countries.
The growth was not regular. Production stagnated in 2020/21, when a drought and frosts damaged the second corn crop, then rose by 6 percent in 2021/22 and by 18 percent in 2022/23. In 2023/24, the El Niño phenomenon caused drought in the centre-west and floods in Rio Grande do Sul, and production fell by about 6 percent. In 2024/25, it rebounded by 17 percent to a record, followed by a further increase of 2.6 percent in 2025/26.
| Season | Production (Mt) | Area (Mha) | Yield (kg/ha) | Change in production |
|---|---|---|---|---|
| 2018/19 | 246.8 | 63.3 | 3,899 | |
| 2019/20 | 257.0 | 65.9 | 3,900 | +4.1% |
| 2020/21 | 256.7 | 70.1 | 3,662 | -0.1% |
| 2021/22 | 272.6 | 74.3 | 3,669 | +6.2% |
| 2022/23 | 320.9 | 78.5 | 4,088 | +17.7% |
| 2023/24 | 301.1 | 79.9 | 3,768 | -6.2% |
| 2024/25 | 352.5 | 82.1 | 4,294 | +17.1% |
| 2025/26 | 361.7 | 83.5 | 4,332 | +2.6% |
| 2026/27 (forecast) | 367.1 | 85.4 | 4,299 | +1.5% |
Table 1. Grain production, area and yield. Source: Conab; yields calculated by the author.
5.2 Weather drives yields, land drives growth
Figure 2 shows average yields and the annual decomposition of production changes.
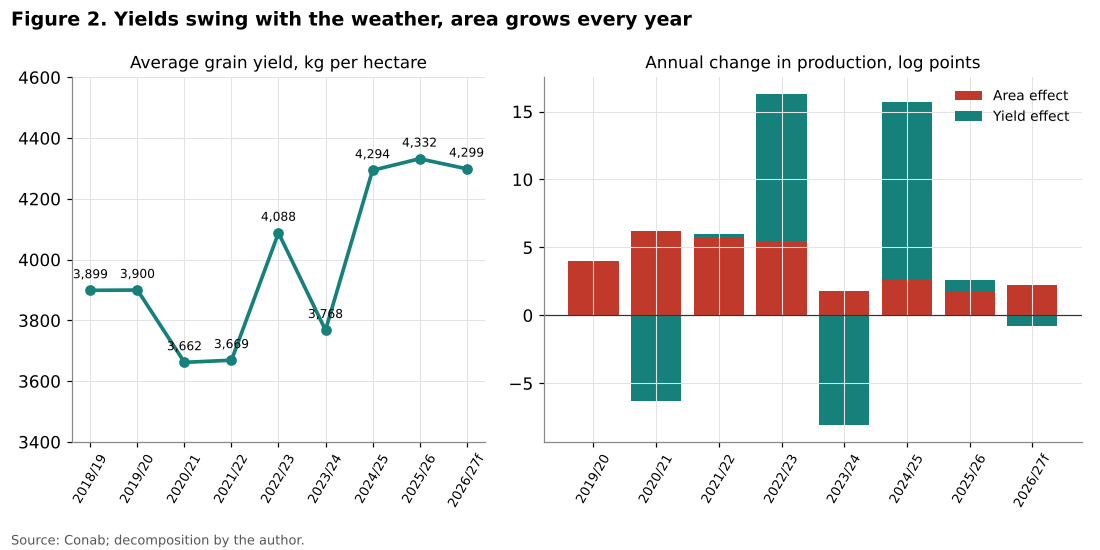
The left panel shows that average grain yield has been volatile. It was about 3,900 kilograms per hectare in 2018/19 and 2019/20, fell to about 3,660 in 2020/21 and 2021/22, rose to 4,088 in 2022/23, fell to 3,768 in 2023/24, and reached about 4,300 in 2024/25 and 2025/26. The first forecast for 2026/27 assumes a slightly lower average yield, partly because Conab’s initial forecasts tend to be conservative.
The right panel shows the decomposition. The area effect is positive in every season, between about 1.7 and 6.2 log points. The yield effect, by contrast, swings widely: -6.3 points in 2020/21, +10.8 in 2022/23, -8.1 in 2023/24 and +13.0 in 2024/25. In other words, land expansion provides a steady trend of growth, while weather determines the deviations from this trend.
5.3 More land rather than more grain per hectare
Figure 3 summarises the decomposition over the whole period.
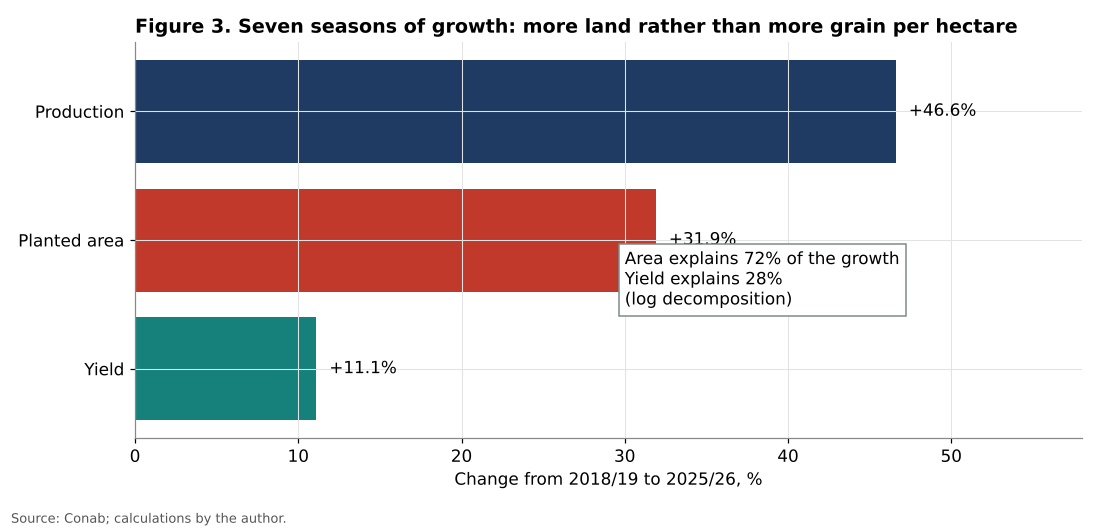
Between 2018/19 and 2025/26, production rose by 46.6 percent, area by 31.9 percent and average yield by 11.1 percent. In log terms, about 72 percent of the growth in production came from additional area and only about 28 percent from higher yields.
This result is important and somewhat contrary to the usual narrative of Brazilian agriculture as a story of productivity. Over the longer term, since the 1970s, productivity has indeed been the main driver of growth, as the literature shows. But over the past seven seasons, the expansion of planted area has been the dominant factor. Part of this expansion reflects the growth of double cropping, which increases planted area without requiring new land, and part reflects the conversion of pastures to crops. But part also reflects the advance of the agricultural frontier into new areas, including in the Cerrado.
The slowdown in yield growth may have several explanations: the expansion into less fertile or more climatically exposed areas, the increasing frequency of climatic shocks, and the composition effect of the growth of the second corn crop, which has lower yields than the first crop. Whatever the explanation, it means that maintaining the growth rate of recent years would require continued expansion of planted area of about 2 million hectares per year.
5.4 Concentration in two crops
Figure 4 shows the production of soybeans and corn.
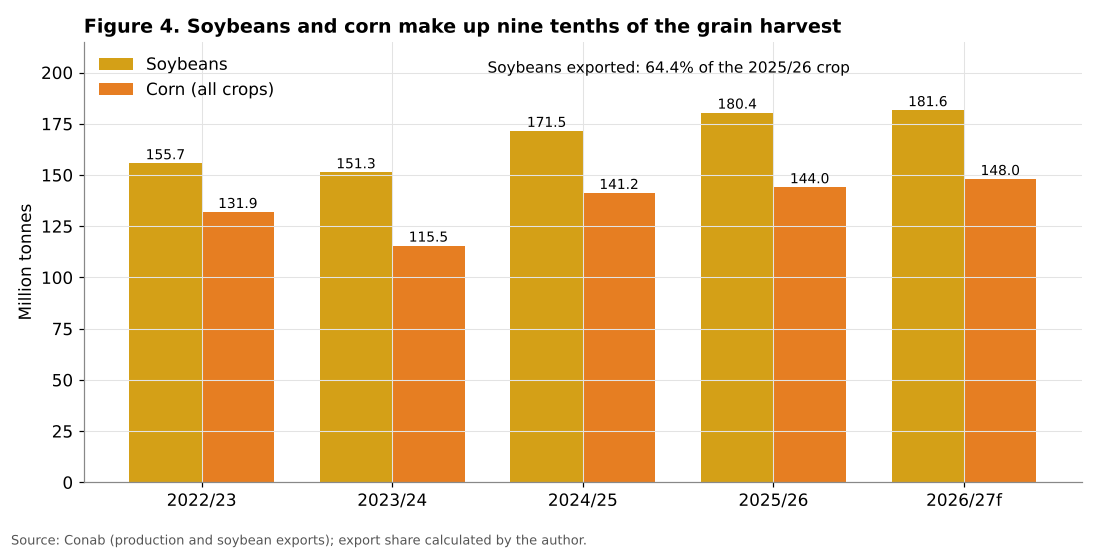
Soybeans and corn together accounted for 324.4 million tonnes in 2025/26, about 90 percent of total grain production. Soybean production reached a record 180.4 million tonnes, up 5.2 percent, with area up 2.7 percent and yield up 2.5 percent. Corn production reached 144 million tonnes, up 2 percent, of which 112.1 million tonnes came from the second crop. For 2026/27, Conab projects 181.6 million tonnes of soybeans on 49.3 million hectares and 148 million tonnes of corn on 23.7 million hectares.
Other crops tell a different story. Rice production fell by 13.2 percent in 2025/26, to 11.1 million tonnes, after a 14 percent reduction in area, and Conab projects a further decline in 2026/27. Wheat production fell by 27.1 percent, to 5.7 million tonnes, after a 21 percent fall in area and a 7.5 percent fall in yield. With wheat imports estimated at 7.1 million tonnes, Brazil depends on imports for about 55 percent of its wheat supply. Bean production is stable at around 2.9 million tonnes. Cotton, on the other hand, reached a record of 4.1 million tonnes of lint.
This pattern reveals a specialisation in export crops, soybeans, corn and cotton, at the expense of crops for domestic consumption, rice, beans and wheat. The shift reflects relative profitability: export crops benefit from world demand, economies of scale and efficient logistics, while domestic staples face lower margins and greater price volatility.
5.5 Exports and dependence on China
Figure 5 shows agribusiness exports by destination and the implied export price of soybeans.
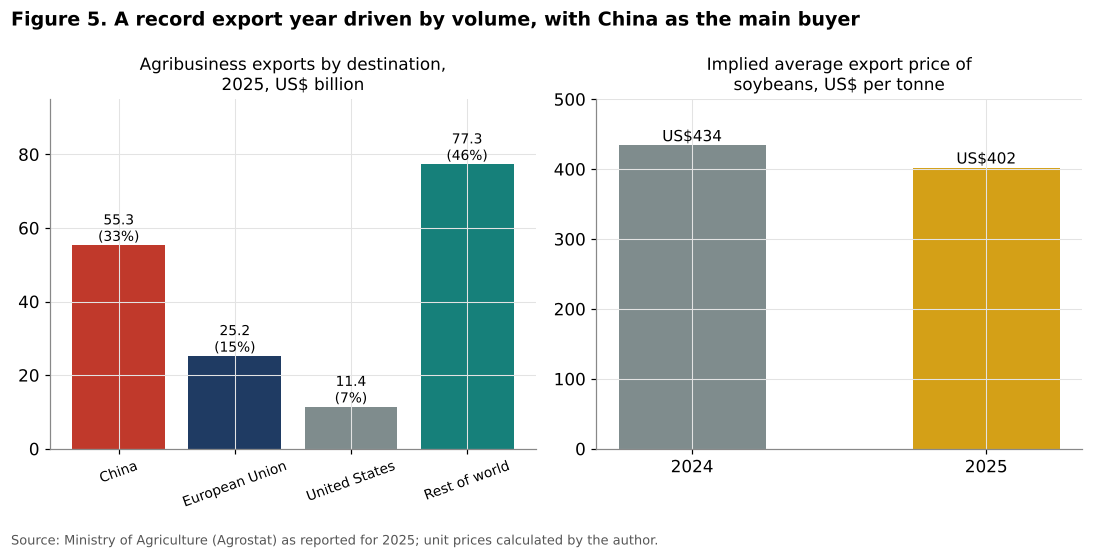
Agribusiness exports reached a record US$169.2 billion in 2025, up 3.0 percent, with volumes up 3.6 percent and average prices down 0.6 percent. China was the largest destination, with US$55.3 billion, or 32.7 percent of the total, up 11 percent. The European Union accounted for 14.9 percent and the United States for 6.7 percent.
Soybeans alone represented US$43.5 billion of exports, with a record volume of 108.2 million tonnes in 2025. The author’s calculation of the implied average export price shows a fall from about US$434 per tonne in 2024 to about US$402 in 2025, a decline of 7.4 percent. In other words, the value of soybean exports rose only slightly because a 9.5 percent increase in volume was largely offset by lower prices. Conab projects soybean exports of 116.2 million tonnes for the 2025/26 season and 118.0 million tonnes for 2026/27. On this basis, about 64 to 65 percent of the soybean crop is exported as grain, without counting exports of soybean meal and oil.
Other products contributed strongly to export growth in 2025: beef exports rose by 39.9 percent to US$17.9 billion, and coffee exports by 30.3 percent to US$16 billion, driven by high world prices.
The concentration of exports in soybeans and of soybean exports in China creates a significant exposure. Changes in Chinese demand, linked to its livestock sector, its trade relations with the United States or its own food security policies, have a direct impact on Brazilian farm income. In recent years, trade tensions between China and the United States have favoured Brazil, which has captured a larger share of the Chinese market. But this advantage depends on factors outside Brazil’s control.
5.6 The contribution to GDP
Agriculture’s contribution to GDP growth in 2025 was exceptional. With a share of about 7 percent of value added and growth of 11.7 percent, agriculture contributed about 0.8 percentage points to GDP growth of 2.3 percent, or about a third of the total. Without the record harvest, Brazilian growth in 2025 would have been closer to 1.5 percent.
In 2026, the contribution is smaller but still positive: agricultural GDP grew by 3.6 percent in the first half and by 6.8 percent year on year in the second quarter, while total GDP grew by 1.9 percent in the first half. The weight of agriculture in growth, combined with the volatility of yields, means that Brazilian GDP growth has become more sensitive to the weather. A drought year can subtract almost a percentage point of growth, and a good year can add as much.
5.7 Comparing IBGE and Conab
The two official sources give slightly different pictures. IBGE estimates the 2026 calendar year harvest at 354.5 million tonnes, 2.4 percent more than in 2025 (346.1 million tonnes), with harvested area of 83.2 million hectares, up 2 percent. Soybeans account for 175 million tonnes in the IBGE estimate (up 5.4 percent) and corn for 143.3 million tonnes (up 1.1 percent), with a strong increase in the first corn crop (up 15.5 percent) and a decline in the second (down 2.0 percent). Rice is down 11.4 percent and wheat down 24 percent.
The differences in levels, about 2 percent for total grains, are due to differences in calendars, coverage and methods. But both sources agree on the main trends: record soybean production, growth of area, stagnation or decline of staple crops, and a sharp fall in wheat.
5.8 Soybean economics: volume against price
The value of soybean exports can be decomposed in the same way as production. Between 2024 and 2025, the value of soybean grain exports rose by about 1.4 log points. This small increase was the sum of a volume effect of about +9.1 log points and a price effect of about -7.7 log points. In other words, Brazil sold almost a tenth more soybeans abroad but received only slightly more money for them.
This pattern is typical of a commodity exporter in a period of abundant world supply. Record crops in Brazil, combined with large harvests in the United States and Argentina, put downward pressure on world prices. Brazilian farmers compensate for lower prices with higher volumes, which further increases world supply. The strategy is rational for each producer, but in aggregate it limits the gains of the sector and makes farm income more dependent on volumes, and therefore on the weather.
An order of magnitude helps to show what is at stake. At the 2025 implied export price of about US$402 per tonne, the 2025/26 soybean crop of 180.4 million tonnes would be worth about US$72.5 billion, and the exports projected by Conab for the season, 116.2 million tonnes, about US$46.7 billion. A change of 10 percent in the world price would change the value of the crop by about US$7 billion, roughly the equivalent of a quarter of Brazil’s annual coffee and beef exports combined. The exchange rate of the real adds another layer of volatility: a weaker real raises the income of farmers in local currency even when dollar prices fall, which has helped sustain planting decisions in recent years.
5.9 Staples under pressure
The contrast between export crops and staples deserves a closer look. The following table summarises the latest Conab figures for the main domestic staples.
| Crop | 2025/26 production | Change from 2024/25 | Area change | 2026/27 outlook |
|---|---|---|---|---|
| Rice | 11.1 Mt | -13.2% | -14.0% | 10.8 Mt (-2.9%) |
| Wheat | 5.7 Mt | -27.1% | -21.2% | lower area and yield |
| Beans | about 2.9 Mt | stable | small changes | stable |
| Cotton (lint) | 4.1 Mt | +1.5% | -3.2% | record level maintained |
Table 2. Domestic staples and cotton. Source: Conab, September and October 2026 surveys.
Rice and wheat illustrate two different problems. For rice, the fall in area followed a fall in prices after the high prices of 2024, a classic “cobweb” cycle in which producers respond to past prices. For wheat, the decline reflects both lower area and lower yields in the south, where weather conditions were unfavourable, and the structural difficulty of competing with imports from Argentina, Brazil’s main supplier, within Mercosur. With imports estimated at 7.1 million tonnes for a production of 5.7 million tonnes, wheat is the main exception to Brazilian agricultural self-sufficiency.
These trends matter for consumers. Rice, beans and bread are central to the Brazilian diet, and their prices weigh heavily in the inflation of low-income households. The previous article in this series, on inflation and purchasing power, showed how food prices drive the gap between the inflation faced by the poor and the rich.
5.10 Beyond grains: livestock and permanent crops
Grains are the backbone of Brazilian agriculture, but the export performance of 2025 also owed much to livestock and permanent crops. Beef exports rose by 39.9 percent to a record US$17.9 billion, pork exports by 19.6 percent in value and 12.5 percent in volume, and coffee exports by 30.3 percent to US$16 billion, thanks to exceptionally high world prices after poor harvests in several producing countries. Chicken export volumes were broadly stable.
These sectors are closely linked to grains. Corn and soybean meal are the main feed for poultry and pigs, so abundant grain harvests lower feed costs and support the competitiveness of meat exports. In this sense, the grain economy and the meat economy form a single value chain, in which Brazil increasingly exports not only raw grains but also grains converted into animal protein. This conversion adds value and employment within Brazil, and it partly diversifies the export basket away from raw soybeans. It also means, however, that a bad grain harvest propagates quickly to the meat sector through higher feed prices.
6. Discussion
6.1 The productivity question
The finding that land expansion explained about 72 percent of grain production growth over the past seven seasons raises an important question about the sustainability of the Brazilian model. Land is not unlimited. The conversion of pastures to crops has been an important source of expansion, and Brazil still has large areas of degraded pastures that could be converted without clearing native vegetation. But further expansion into native vegetation, in the Cerrado or the Amazon, faces legal, environmental and commercial constraints, including the European Union’s regulation on deforestation-free products.
The future growth of Brazilian agriculture will therefore depend more on productivity: higher yields per hectare, more efficient use of inputs, better genetics, digital technologies and the expansion of irrigation. Embrapa and private research have the capacity to generate these gains, but they require sustained investment in research, extension and infrastructure.
6.2 Climate risk
The volatility of yields documented in this article is the clearest sign of climate risk. In the past seven seasons, the yield effect was strongly negative in two seasons (2020/21 and 2023/24), each time because of drought, frost or floods. The floods in Rio Grande do Sul in 2024 also showed that extreme events can affect not only production but also logistics and infrastructure.
The research of Rattis and co-authors suggests that this risk will increase, particularly for the second corn crop in the centre-west, which depends on the length of the rainy season. A shortening of the rainy season would reduce the window for double cropping and thus the main source of the area expansion.
6.3 Food security and the domestic market
The specialisation in export crops has implications for domestic food security. The decline of rice and wheat production makes Brazil more dependent on imports and more exposed to world price fluctuations for these staples. The sharp fall in rice production in 2025/26 followed a period of high prices in 2024, which had encouraged planting; the subsequent fall in prices then discouraged it. This cycle illustrates the vulnerability of domestic staples.
At the same time, the rapid growth of corn ethanol production, which absorbs a growing share of the corn crop (Conab projects an increase of 6.6 percent in domestic corn consumption in 2026/27, driven by ethanol), creates a new link between agriculture and energy.
6.4 Infrastructure and logistics
The growth of production in the centre-west and north has been accompanied by the development of new export routes through the northern ports of the “Arco Norte”, reducing the dependence on the ports of Santos and Paranaguá. But logistics costs remain high, and the competitiveness of Brazilian agriculture depends on continued investment in railways, waterways and ports. Projects such as the Ferrogrão railway, linking Mato Grosso to the Tapajós river, illustrate both the potential and the difficulties of such investments.
6.5 Trade policy
The dependence on China for about a third of agribusiness exports, and for a much larger share of soybean exports, is both an opportunity and a risk. Diversification of markets, notably through the trade agreement between Mercosur and the European Union and agreements with Asian countries, would reduce this risk. But diversification is difficult for soybeans, for which China is by far the largest importer in the world.
6.6 Lessons from the Cerrado revolution
The history of the Cerrado offers useful lessons for the next stage. In the 1970s, the savannahs of central Brazil were considered unsuitable for agriculture because of their acidic, nutrient-poor soils. The combination of public research by Embrapa, which developed liming techniques and soybean varieties adapted to low latitudes, of public credit and of infrastructure investment transformed the region into one of the most productive agricultural areas in the world. The key factor was not the availability of land as such, but the knowledge that made the land productive.
The same logic applies today. Brazil has an estimated tens of millions of hectares of degraded pastures, which could be converted to crops or integrated crop-livestock-forest systems without clearing native vegetation. Converting them requires investment in soil recovery, technical assistance and credit, and a policy framework that makes the recovery of degraded land more attractive than the opening of new areas. Programmes for the recovery of degraded pastures and for low-carbon agriculture point in this direction. Their scale will determine whether the growth of the next decade can combine higher production with lower pressure on native ecosystems.
6.7 Implications for policy
Four implications follow from the analysis. First, agricultural research and extension should receive priority, since future growth must come more from yields than from area. Second, climate adaptation, through drought-tolerant varieties, irrigation, crop insurance and better weather information, has become a macroeconomic issue, given the weight of agriculture in GDP growth and in the trade balance. Third, the diversification of export markets and products, including processed products with higher value added, would reduce exposure to a single buyer and to raw commodity prices. Fourth, policies for domestic staples, such as minimum price support, public stocks and incentives for rice and wheat in suitable regions, deserve renewed attention to limit the vulnerability of low-income consumers.
7. Scenarios to 2030/31
7.1 Three scenarios
Figure 6 presents three scenarios for grain production from Conab’s 2026/27 forecast of 367.1 million tonnes.
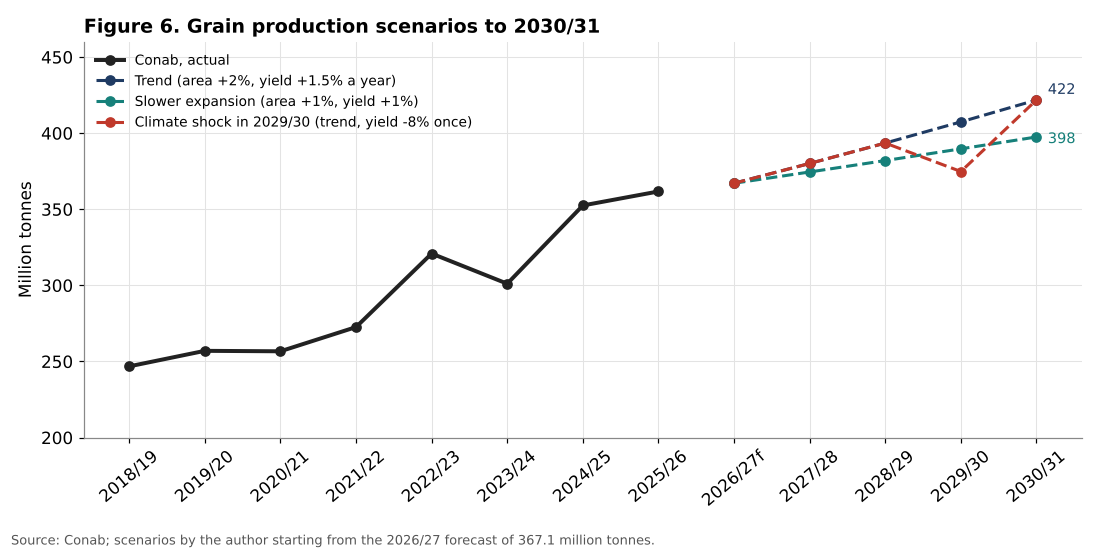
Trend scenario. Planted area continues to grow by 2 percent per year, close to the average of the past three seasons, and yields grow by 1.5 percent per year, in line with long-term trends. Production reaches about 422 million tonnes in 2030/31, an increase of 15 percent from 2026/27.
Slower expansion scenario. Environmental constraints, commercial requirements and lower profitability slow the expansion of area to 1 percent per year, and yields grow by only 1 percent per year. Production reaches about 398 million tonnes in 2030/31.
Climate shock scenario. The trend scenario applies, but a climate shock in 2029/30 reduces yields by 8 percent, similar to 2023/24, before recovering. Production falls to about 375 million tonnes in 2029/30, close to the 2026/27 level, before returning to about 422 million tonnes. A shock of this size would reduce production by about 33 million tonnes, equivalent to about US$13 billion of soybean exports at 2025 prices if it fell entirely on soybeans.
7.2 Interpretation
The scenarios show that Brazilian grain production is likely to exceed 400 million tonnes before 2030 if current trends continue, but that this threshold depends on continued area expansion. If area growth slows to 1 percent per year, yields would need to grow by about 2.5 percent per year to reach the same level, which would require a significant acceleration of productivity growth compared with the recent past.
The climate shock scenario illustrates that a single bad season can wipe out two or three years of growth, with significant effects on GDP and the trade balance.
7.3 Price scenarios
Volumes are only half of the story. Using the author’s calculation of the 2025 implied export price of soybeans, about US$402 per tonne, the value of the 2025/26 soybean crop is about US$72.5 billion. If world prices fell by 10 percent, the value would fall to about US$65 billion; if they rose by 10 percent, it would reach about US$80 billion. A swing of this size, about US$7 billion in either direction, is comparable to the effect of a moderate climate shock on volumes. Farm income in Brazil is therefore exposed to two sources of risk of similar magnitude: the weather at home and prices abroad. The exchange rate partly cushions price shocks in local currency, but it does not eliminate them.
7.4 Indicators to monitor
1. Conab’s monthly surveys for the 2026/27 season, especially soybean planting and the evolution of the rainy season. 2. Average yields per crop, to detect any acceleration or slowdown of productivity. 3. Agribusiness exports by destination, and the share of China. 4. International soybean and corn prices. 5. Indicators of land use change in the Cerrado and the Amazon.
8. Conclusion
This article has analysed the performance of Brazilian agriculture using Conab and IBGE data and the author’s own calculations. The main conclusions are:
1. Grain production reached a record 361.7 million tonnes in 2025/26 and is forecast at 367.1 million tonnes for 2026/27. Agricultural GDP grew by 11.7 percent in 2025 and contributed about a third of national growth. 2. Between 2018/19 and 2025/26, about 72 percent of the growth in grain production came from additional planted area (20.2 million hectares) and only 28 percent from higher yields. 3. Yields are highly sensitive to the weather, falling by about 8 percent in 2023/24 and rising by 13 percent in 2024/25. 4. Production is concentrated in soybeans and corn (about 90 percent of the harvest), and about two thirds of soybeans are exported, with China absorbing a third of agribusiness exports. Brazil depends on imports for about 55 percent of its wheat. 5. Under plausible assumptions, production could exceed 420 million tonnes by 2030/31, but only with continued expansion of area or a significant acceleration of productivity.
Brazilian agriculture remains one of the most competitive in the world and a pillar of the national economy. But its recent growth has relied more on land than on productivity, and it is increasingly exposed to climate risk and to the concentration of its markets. The next stage of growth will have to come from higher yields, better adaptation to climate change and more diversified markets.
Need this analysis for your organisation?
We prepare confidential briefings, executive talks and studies on countries, markets and policies, built on the same method as this article.
Request a briefingSupport independent analysis
Our studies are free to read and carry no advertising. If this one was useful, a small contribution helps us publish the next.
Support our workGo further: books by Global Strategy Files

Frequently asked questions
How big is Brazil’s grain harvest in 2026?
Brazil harvested a record 361.7 million tonnes of grains in the 2025/26 season, according to Conab’s final survey, and the first forecast for 2026/27 points to 367.1 million tonnes. IBGE estimates the 2026 calendar year harvest at 354.5 million tonnes.
Is Brazil’s agricultural growth driven by land or productivity?
Mainly by land. Between 2018/19 and 2025/26, grain production rose 46.6 percent, but planted area rose 31.9 percent and average yield only 11.1 percent, so about 72 percent of the growth came from some 20 million additional hectares.
How important is agriculture for Brazil’s economy?
Agriculture grew by 11.7 percent in 2025, the strongest of all sectors, and contributed about a third of national GDP growth. Soybeans and corn account for almost 90 percent of the harvest, and China absorbs a third of agribusiness exports.
What are the main risks for Brazilian agriculture?
Climate is the main source of uncertainty. Yields fell about 8 percent in the drought-affected 2023/24 season before rising 13 percent the following year. Dependence on China and on imports for more than half of wheat consumption add further risks.
Methodological note
All calculations were made by the author using official data. Production and area data are from Conab’s crop surveys, using the latest available value for each season. The 2026/27 values are from Conab’s first survey of October 2026. IBGE data are from the LSPA of September 2026 and the national accounts. Export data are from the Ministry of Agriculture’s statistics for 2025. Yields are production divided by planted area. The decomposition uses natural logarithms. The scenarios apply stated growth assumptions to the 2026/27 forecast.
References
Arias, D., Vieira, P. A., Contini, E., Farinelli, B. and Morris, M. (2017). Agriculture Productivity Growth in Brazil: Recent Trends and Future Prospects. World Bank, Washington, DC.
Conab (2022 to 2026). Acompanhamento da Safra Brasileira de Grãos, monthly surveys, including the 12th survey of the 2025/26 season (September 2026) and the 1st survey of the 2026/27 season (October 2026). Brasília.
Gasques, J. G., Bastos, E. T., Valdes, C. and Bacchi, M. R. P. (2012). Total Factor Productivity in Brazilian Agriculture. In K. O. Fuglie, S. L. Wang and V. E. Ball (eds.), Productivity Growth in Agriculture: An International Perspective. CABI, Wallingford.
IBGE (2026). Levantamento Sistemático da Produção Agrícola, September 2026. Rio de Janeiro.
IBGE (2026). Contas Nacionais Trimestrais, fourth quarter 2025 and second quarter 2026. Rio de Janeiro.
Lapola, D. M., Martinelli, L. A., Peres, C. A. and others (2014). Pervasive Transition of the Brazilian Land-Use System. Nature Climate Change, 4, 27 to 35.
Ministério da Agricultura e Pecuária (2026). Balança comercial do agronegócio, 2025. Brasília.
OECD and FAO (2025). OECD-FAO Agricultural Outlook 2025 to 2034. OECD Publishing, Paris.
Rada, N. (2013). Assessing Brazil’s Cerrado Agricultural Miracle. Food Policy, 38, 146 to 155.
Rattis, L., Brando, P. M., Macedo, M. N. and others (2021). Climatic Limit for Agriculture in Brazil. Nature Climate Change, 11, 1098 to 1104.
