
Can Artificial Intelligence Sustain American Growth? Data Centres, Productivity and the Risk of Overinvestment

Can Artificial Intelligence Sustain American Growth? Data Centres, Productivity and the Risk of Overinvestment
Driss EFFINA, PhD Independent Researcher, Global Strategy Files Reading time: about 27 minutes
Key takeaways
- Amazon, Microsoft, Alphabet and Meta guided to about 730 billion dollars of capital spending in 2026, against 226 billion in 2024.
- Hyperscaler capital spending is rising from about 0.8 percent of US GDP in 2024 to about 2.2 percent in 2026.
- AI-related investment accounted for about 39 percent of real GDP growth in the first nine months of 2025, more than at the dot-com peak.
- Justifying 1.37 trillion dollars spent in 2024 to 2026 requires about 360 to 410 billion dollars of annual gross profits.
Abstract
In 2026, investment linked to artificial intelligence has become the most dynamic component of American demand. The four largest cloud companies, Amazon, Microsoft, Alphabet and Meta, have guided to combined capital expenditure of about 730 billion dollars for the year, against about 410 billion in 2025 and 226 billion in 2024. Private spending on data centre construction reached a record annual rate of 84.95 billion dollars in August 2026, 73 percent more than a year earlier. Federal Reserve officials, in speeches given between 28 September and 1 October 2026, described this investment as a major support for growth but also as a growing source of price pressure. This article asks whether artificial intelligence can sustain American growth over time, or whether the current boom carries the seeds of a correction. Using company disclosures, Census Bureau construction data, Bureau of Labor Statistics productivity data, Bureau of Economic Analysis national accounts, estimates published by the Federal Reserve Bank of St. Louis and Energy Information Administration data, the author measures the scale of the investment wave, its contribution to growth, the evidence on productivity, the financial sustainability of the spending and the macroeconomic consequences of two contrasting outcomes. The main findings are as follows. The capital spending of the four hyperscalers is rising from about 0.8 percent of GDP in 2024 to about 2.2 percent in 2026, a scale comparable to the largest investment waves in modern American history. AI-related categories of investment accounted for about 39 percent of real GDP growth in the first nine months of 2025, more than at the peak of the dot-com boom. Labour productivity has grown at 2.1 percent a year in the current business cycle, faster than in the previous cycle, but there is not yet a clear break attributable to AI. The financial test is demanding: to justify the 1.37 trillion dollars spent between 2024 and 2026, the industry would need to generate annual gross profits of about 360 to 410 billion dollars. The article concludes that AI can raise American potential growth, but that the benefits will come later and more gradually than the investment, so that the economy faces a period in which the demand effects of AI dominate its supply effects.
Keywords: United States, artificial intelligence, data centres, investment, productivity, economic growth, overinvestment, technology cycles
JEL codes: E22, E32, O33, O47, O51
1. Introduction
Every major general purpose technology has gone through a phase in which investment ran ahead of returns. The railways of the nineteenth century, electrification in the early twentieth century and the internet in the late 1990s all combined a genuine transformation of the economy with episodes of overinvestment and financial losses. Artificial intelligence, and in particular the generative AI models that spread from 2023, is now going through its own investment phase, and the question of whether it will repeat this pattern is central to the American economic outlook.
The scale of the current wave is exceptional. In 2026, the four largest American cloud companies, often called hyperscalers, plan to spend about 730 billion dollars on capital expenditure, mostly on data centres, servers, chips and the electricity infrastructure needed to run them. This is about 78 percent more than in 2025, which was itself about 81 percent more than in 2024. Federal Reserve Governor Lisa Cook noted on 28 September 2026 that companies have spent only a small fraction of about 2 trillion dollars of announced plans, which suggests that more investment is in the pipeline.
The Federal Reserve has repeatedly referred to this investment in its assessment of the economy. In his speech of 1 October 2026 on the economy and monetary policy, Vice Chair Philip Jefferson noted that business investment had been strong, mainly due to spending related to AI, and that stronger than expected investment in the “AI buildout” could push growth above the baseline. He also noted that AI demand was raising the costs of related goods and services. President John Williams of the Federal Reserve Bank of New York described the inflationary impact of AI investment as “increasingly salient”, while pointing out that much of it is met by imports.
This article examines three questions. How large is the AI investment wave and how much does it contribute to growth? Is there evidence that AI is raising productivity, which is the only way it can sustain growth in the long run? And is the current pace of investment financially sustainable, or is there a risk of overinvestment and correction?
Section 2 presents the context. Section 3 reviews the literature. Section 4 describes the data and methods. Section 5 presents the results. Section 6 discusses them. Section 7 presents scenarios. Section 8 concludes.
2. Context
2.1 The American economy in 2026
The American economy grew at an annual rate of about 2.4 percent in the first half of 2026, according to Vice Chair Jefferson, roughly in line with its potential rate. The third estimate of the Bureau of Economic Analysis put real GDP growth at 2.5 percent in the first quarter and 2.2 percent in the second quarter. Real final sales to private domestic purchasers, a measure of underlying private demand, rose by 4.6 percent at an annual rate in the second quarter. The BEA noted that the upward revision to investment in the second quarter was led by nonresidential structures, “mainly data centers”.
This growth is taking place in a difficult environment: an oil price shock linked to the conflict in the Middle East, the effects of tariffs introduced in 2025, inflation above target and a Federal Reserve that raised its policy rate in September 2026 for the first time since 2023. AI investment has been one of the main forces sustaining demand in this environment.
2.2 The nature of AI investment
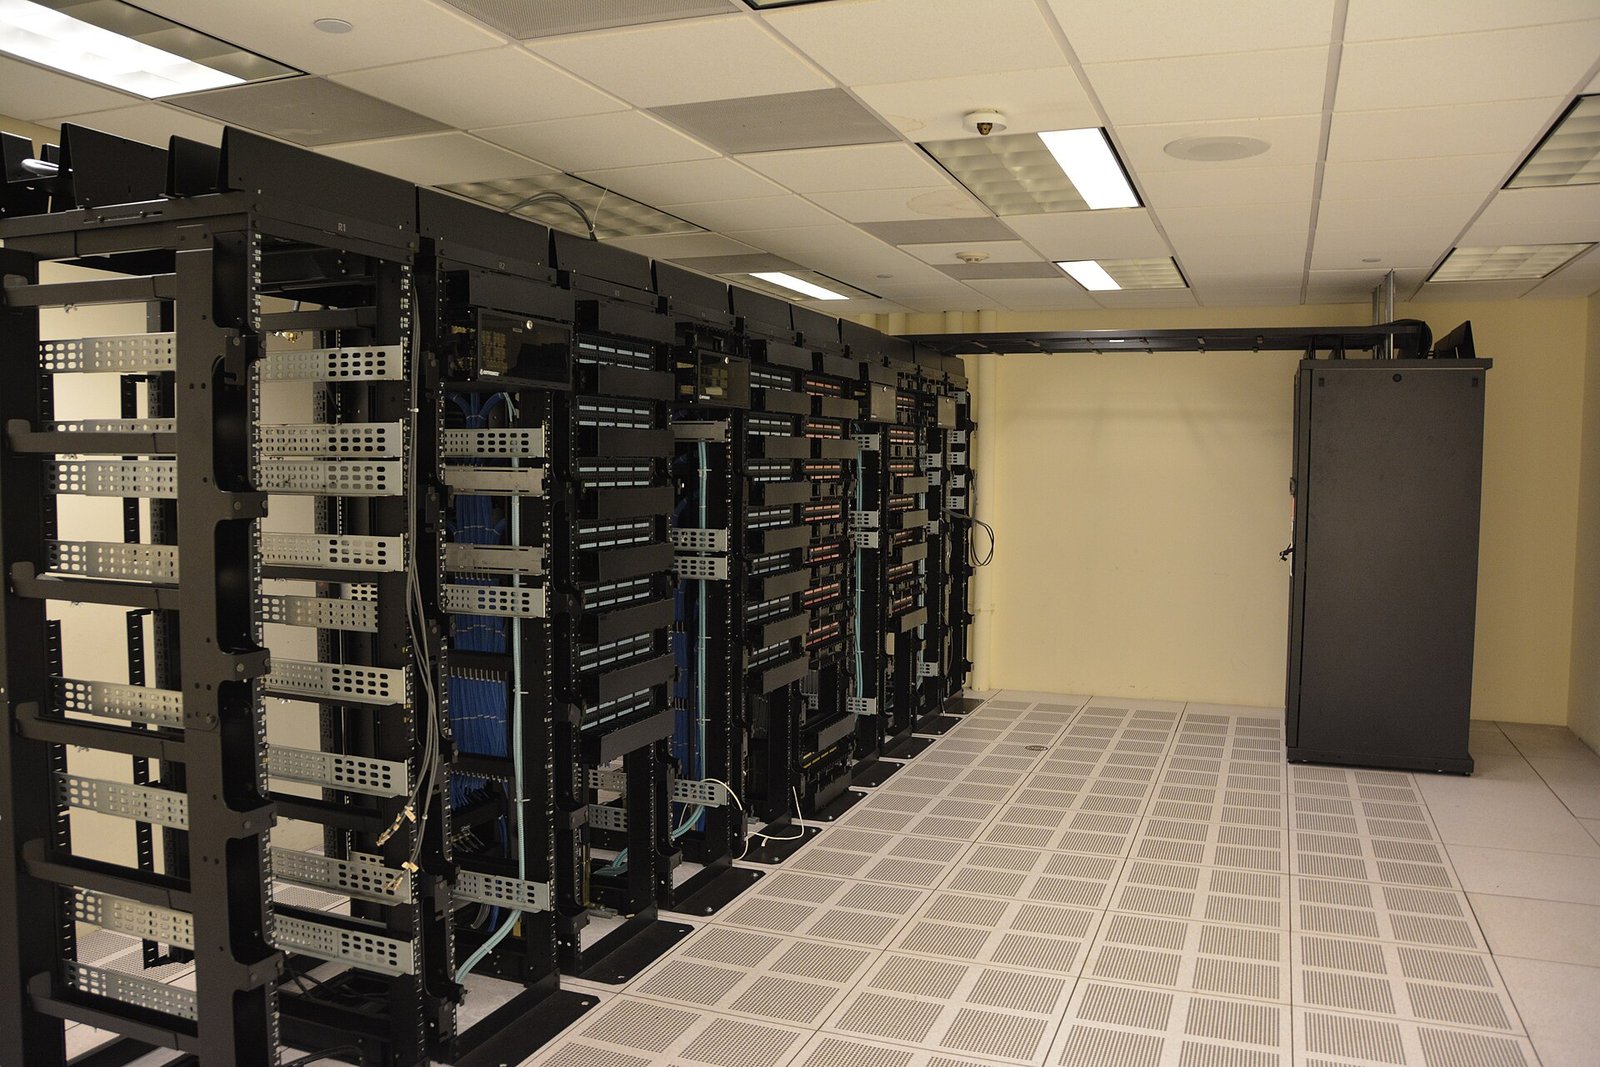
AI investment takes several forms. The most visible is the construction of data centres, large buildings that house servers and require considerable amounts of electricity and cooling. Inside them, the main expense is for equipment: graphics processing units and other specialised chips, servers, memory, networking equipment. A further part consists of software and research and development, including the training of large models.
In the national accounts, these expenditures appear in several categories of nonresidential fixed investment: structures (for data centres), information processing equipment (for servers and chips), and intellectual property products (for software and R&D). There is no single line for AI, which makes measurement difficult.
An important characteristic of this investment is that a large part of the equipment is imported. Advanced chips are mainly produced in Taiwan, and servers are often assembled in Mexico or Asia. When an American company buys an imported server, its investment increases, but so do imports, and the net effect on GDP is smaller than the gross amount of investment.
2.3 Electricity and physical constraints
Data centres consume large amounts of electricity. According to the EIA, American electricity consumption increased by 99 billion kilowatt hours in 2024 and 85 billion in 2025, and is expected to increase by 93 billion in 2026, a pace of growth not seen in decades. In the third quarter of 2026, sales to the commercial sector, which includes data centres, were about 5 percent higher than a year earlier. The average residential electricity price is expected to rise from 17.30 cents per kilowatt hour in 2025 to 18.21 cents in 2026, an increase of about 5.3 percent. Governor Cook noted that the rise in electricity costs may be partly due to AI.
3. Literature review
The literature relevant to this question can be organised around four themes.
The first concerns the productivity paradox. Robert Solow famously observed in 1987 that “you can see the computer age everywhere but in the productivity statistics”. It took until the second half of the 1990s for information technology to produce a visible acceleration in American productivity. Oliner and Sichel (2000) documented this acceleration and showed that it came both from the production of IT goods and from their use. Brynjolfsson, Rock and Syverson (2021) proposed an explanation for the delay: the “productivity J-curve”. When a new general purpose technology appears, firms must make large intangible investments (reorganisation, training, new processes) that are not measured as output, so that measured productivity first falls or stagnates before rising.
The second concerns the macroeconomic effects of AI. Estimates vary widely. Briggs and Kodnani (2023), at Goldman Sachs, estimated that generative AI could raise annual labour productivity growth in the United States by about 1.5 percentage points over a ten-year period after widespread adoption. Acemoglu (2025), in a paper titled “The Simple Macroeconomics of AI”, estimated a much smaller effect: an increase in total factor productivity of about 0.7 percent in total over ten years, based on the share of tasks that AI can perform profitably. The difference between these estimates reflects different assumptions about the share of tasks affected and the cost savings per task.
The third concerns micro evidence. Brynjolfsson, Li and Raymond (2025) found that the introduction of a generative AI assistant in a customer support centre raised productivity by about 14 percent on average, with much larger gains for less experienced workers. Noy and Zhang (2023) found significant time savings in professional writing tasks. Bick, Blandin and Deming (2024) documented that the adoption of generative AI in the United States is faster than the adoption of personal computers or the internet at comparable stages. The Federal Reserve’s 2026 Small Business Credit Survey, cited by Governor Cook, found that nearly half of small employer firms use AI and that 71 percent of those using it report increased productivity.
The fourth concerns investment cycles and finance. Perez (2002) described how technological revolutions typically go through an “installation period”, characterised by financial speculation and overinvestment, followed by a “deployment period” in which the technology spreads throughout the economy. Gordon (2016) argued that the great inventions of the late nineteenth and early twentieth centuries had much larger effects on living standards than information technology, and was sceptical about future productivity gains. Brandsaas and co-authors (2025), in a Federal Reserve working paper, developed a method to estimate aggregate data centre investment from project-level data.
4. Data and methodology
4.1 Data
The analysis uses:
- company disclosures and guidance for capital expenditure of Amazon, Microsoft, Alphabet and Meta, as compiled in the financial press after the second quarter 2026 earnings releases;
- Census Bureau construction spending data for August 2026, as reported in the press, for data centres and offices;
- the Federal Reserve Bank of St. Louis estimates of the contributions of AI-related investment categories to GDP growth in 2025;
- the BLS Productivity and Costs release for the second quarter of 2026 (revised, 3 September 2026);
- the BEA GDP releases for the second quarter of 2026;
- EIA electricity data from the October 2026 Short-Term Energy Outlook;
- speeches by Federal Reserve officials between 28 September and 1 October 2026;
- estimates by PIMCO and Goldman Sachs on the financing of hyperscaler capital spending, as reported in the press.
4.2 Scale of investment
Hyperscaler capital expenditure is expressed as a share of US nominal GDP. GDP is 29.18 trillion dollars in 2024. For 2025 and 2026, the author uses approximate values of 30.5 and 32.5 trillion dollars. This ratio is an indicator of scale, not of contribution to GDP: hyperscaler capital spending includes spending outside the United States, land, finance leases and imported equipment.
4.3 Revenue hurdle
To assess financial sustainability, the author calculates the annual gross profit that the industry would need to generate to cover the depreciation of the capital stock built between 2024 and 2026 and to earn a 10 percent return on it. Two assumptions about the average useful life of the assets are used: five years, typical of servers and chips, and six years. This calculation is deliberately simple and ignores operating costs such as electricity, which would raise the required revenue further.
4.4 Scenarios
Potential growth is calculated as the sum of labour input growth (assumed at 0.3 percent a year, reflecting slow labour force growth) and labour productivity growth under three assumptions. The direct effect of an investment correction on GDP is calculated as the reduction in capital expenditure multiplied by the share of domestic content (40, 50 or 60 percent), divided by GDP.
4.5 Limitations
The hyperscaler figures are based on company guidance, which may change. Census data on data centre construction are subject to revision. The St. Louis Fed estimates cover four categories of investment that include spending unrelated to AI. The share of imports in AI equipment is uncertain. The scenarios are illustrative.
5. Results
5.1 The scale of the investment wave
Figure 1 shows the combined capital expenditure of the four largest American cloud companies.
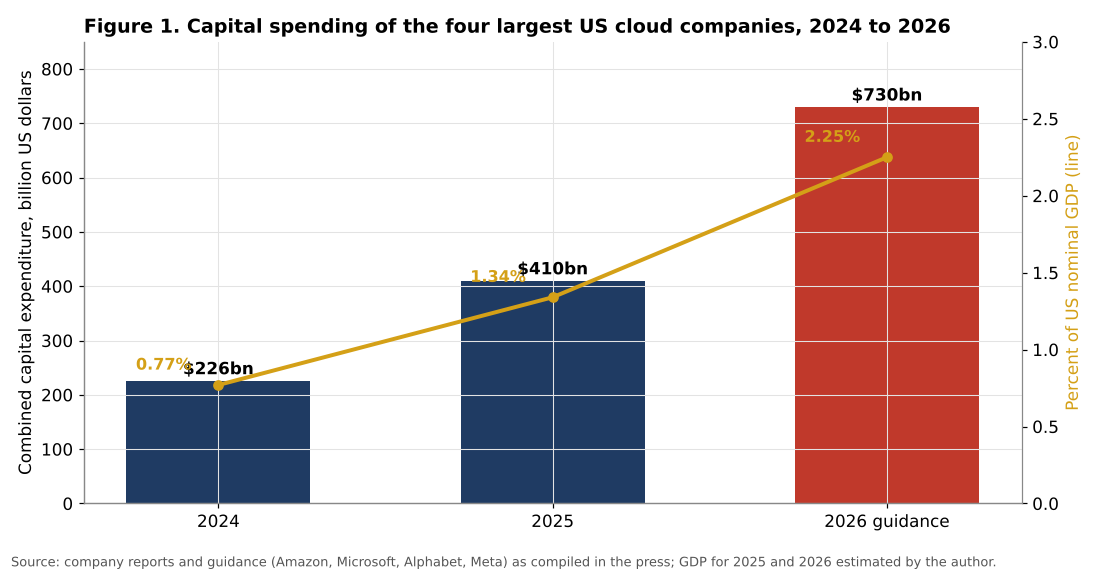
Combined capital spending rose from about 226 billion dollars in 2024 to about 410 billion in 2025, and is expected to reach about 730 billion in 2026 based on guidance updated after the second quarter. The individual guidance for 2026 is about 220 billion dollars for Amazon (raised from about 200 billion), 195 to 205 billion for Alphabet (raised from 180 to 190 billion), 130 to 145 billion for Meta, and about 175 billion for Microsoft after an accounting change related to the useful life of its data centres.
Expressed as a share of GDP, this spending rises from about 0.77 percent in 2024 to 1.34 percent in 2025 and about 2.25 percent in 2026. In two years, the ratio has nearly tripled. This is a remarkable concentration of national investment in the hands of four firms.
The quarterly figures confirm the acceleration. In the second quarter of 2026, Amazon spent about 53 billion dollars, Alphabet about 45 billion, Microsoft about 41 billion in its fiscal fourth quarter and Meta about 31 billion. Alphabet’s capital spending exceeded its operating cash flow in the quarter, producing negative free cash flow for the first time since its stock market listing in 2004, according to figures reported in the press.
5.2 The data centre boom
Figure 2 shows construction spending on data centres.
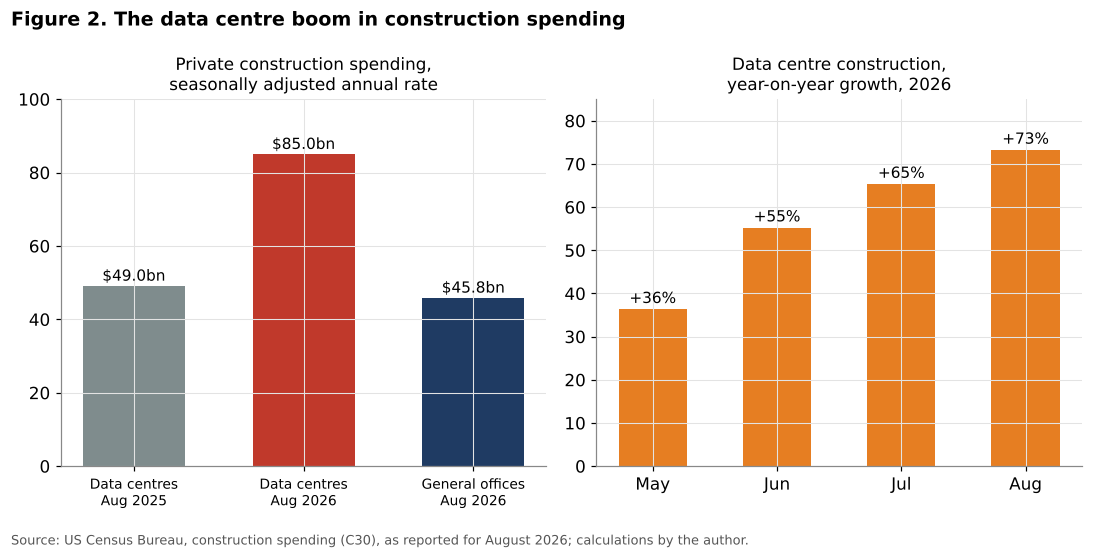
Private spending on the construction of data centres reached a seasonally adjusted annual rate of 84.95 billion dollars in August 2026, a record, against 49.05 billion in August 2025, an increase of 73 percent. The year-on-year growth rate has accelerated every month: 36 percent in May, 55 percent in June, 65 percent in July and 73 percent in August.
Data centre construction now exceeds spending on general office buildings, which was 45.8 billion dollars in August 2026, down 9.7 percent over the year. It represents about 3.9 percent of total construction spending in the United States, against a very small share a decade ago.
This shift illustrates a structural change in the American economy. Offices, which were the main form of commercial construction for decades, are in decline, weighed down by remote work and high vacancy rates. Data centres, which house the infrastructure of the digital economy, are taking their place. But data centre construction is also more concentrated geographically, in places with access to cheap electricity, land and water, and it employs relatively few workers once completed.
5.3 Contribution to growth
Figure 3 shows the contribution of AI-related investment categories to real GDP growth in 2025, according to estimates by the Federal Reserve Bank of St. Louis.
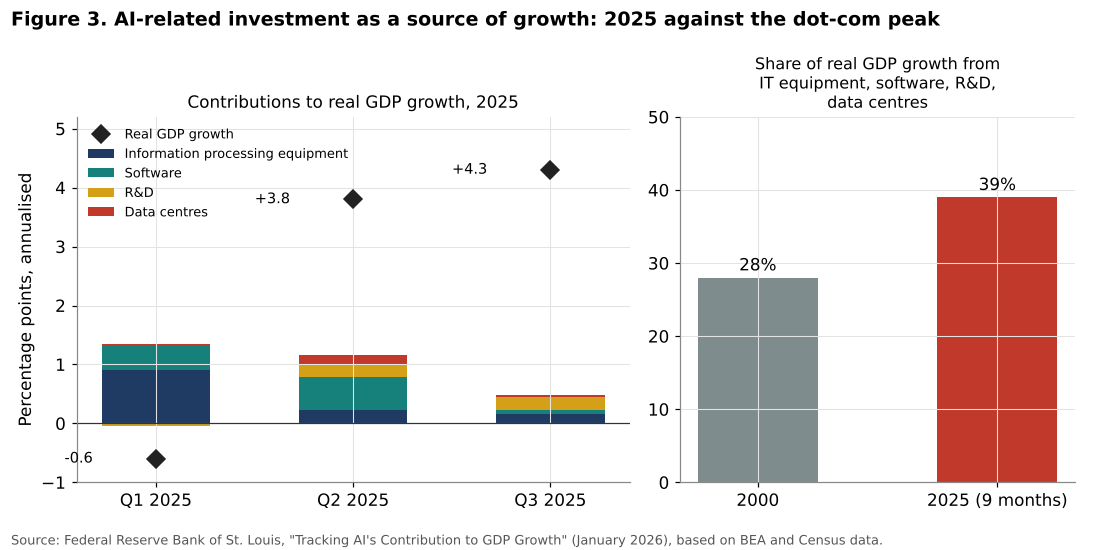
The St. Louis Fed tracks four categories: information processing equipment, software, research and development, and data centre construction. Their combined contribution to annualised real GDP growth was about 1.30 percentage points in the first quarter of 2025, 1.16 points in the second quarter and 0.48 points in the third quarter. In the first quarter, when GDP contracted at an annual rate of 0.6 percent, these categories prevented a sharper contraction. In the second quarter, they accounted for about 30 percent of growth.
Over the first nine months of 2025, these categories contributed about 0.97 percentage points to annualised real GDP growth of 2.51 percent, or about 39 percent of growth. At the peak of the dot-com boom in 2000, the same categories (excluding data centres, which were not tracked separately) contributed 0.81 points, or about 28 percent of growth. The long-run average contribution of the four categories is only about 0.39 points. In other words, the current wave contributes about two and a half times more to growth than these categories do on average.
Some analysts have produced even higher estimates for 2026, suggesting that AI-related categories accounted for most of GDP growth in the first quarter of 2026. These estimates should be treated with caution, because the categories they use include spending unrelated to AI, and because they do not account for the imports needed to produce the investment. President Williams of the New York Fed noted that much of the AI investment is met by imports and therefore contributes less to GDP growth than gross figures suggest.
5.4 The productivity evidence
Figure 4 shows labour productivity growth in the nonfarm business sector and in manufacturing.
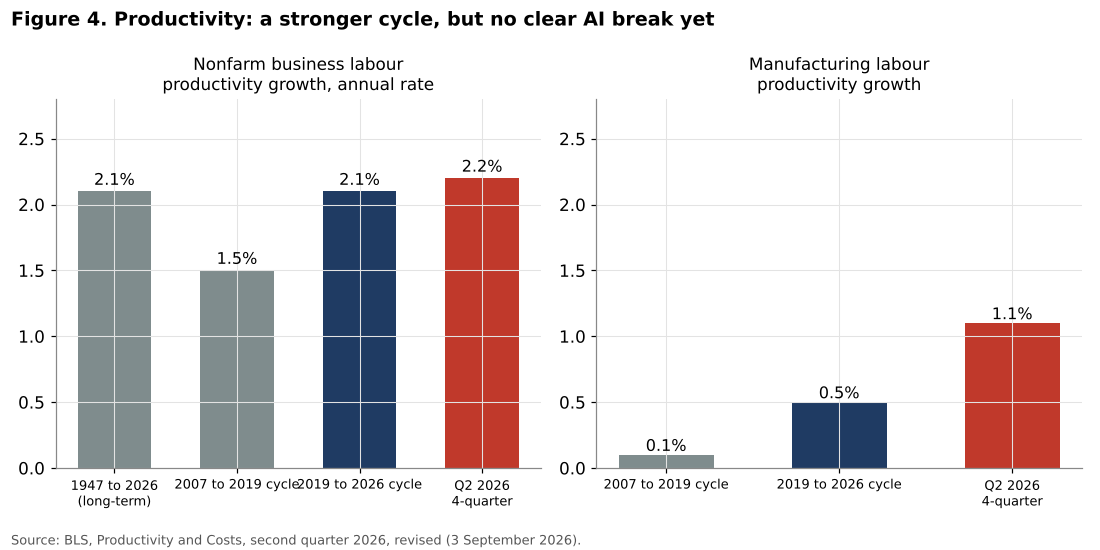
The productivity data are encouraging but not conclusive. Labour productivity in the nonfarm business sector rose by 2.2 percent over the year to the second quarter of 2026, and by 1.4 percent at an annual rate in the second quarter itself. Over the current business cycle, from the fourth quarter of 2019 to the second quarter of 2026, productivity has grown at an average annual rate of 2.1 percent. This is significantly faster than the 1.5 percent of the previous cycle (2007 to 2019) and equal to the long-term average since 1947.
The FOMC statement of September 2026 described productivity growth as “strong”. However, the current cycle began before the generative AI boom, and the acceleration of productivity since 2019 has many possible causes: the reallocation of workers after the pandemic, the surge in new business formation, the adoption of remote work and digital tools, and the composition of employment. It is not possible, with aggregate data, to attribute a significant part of this acceleration to AI.
In manufacturing, productivity growth has been much weaker: 0.5 percent a year in the current cycle, against 0.1 percent in the previous one and a long-term rate of 2.1 percent since 1987. The second quarter of 2026 was better, with growth of 1.1 percent over the year and 2.4 percent at an annual rate in the quarter.
The micro evidence suggests that AI raises productivity in specific tasks, sometimes substantially. But the aggregation of these task-level gains into economy-wide productivity takes time, because firms must reorganise, workers must learn and complementary investments must be made. The productivity J-curve described by Brynjolfsson, Rock and Syverson (2021) suggests that measured productivity may even be held back during the investment phase. Governor Cook said she expected productivity gains from AI to bring “modest disinflation within the next few years”, but not soon enough to offset price pressures in the short term.
5.5 The financing test
Figure 5 examines the financial sustainability of the investment wave.
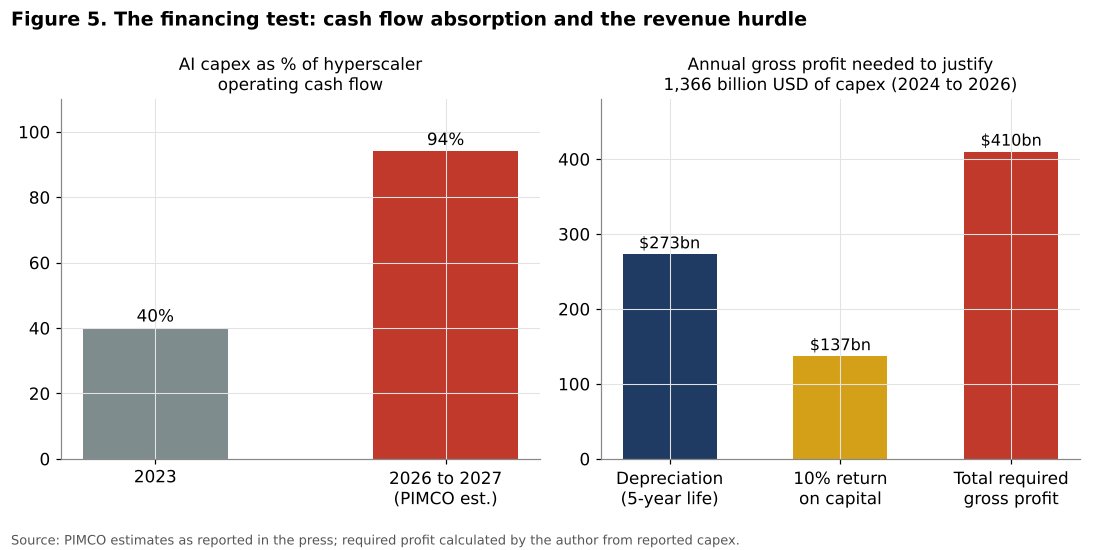
The left panel shows that, according to estimates by PIMCO reported in the press, AI capital spending is expected to absorb about 94 percent of hyperscaler operating cash flow in 2026 and 2027, against about 40 percent in 2023. In other words, the companies that have financed the AI boom mainly from their own cash are now reaching the limits of this model. They are increasingly turning to debt: according to Goldman Sachs, the share of hyperscaler capital spending financed by investment grade bonds rose from about 26 percent in 2025 to about 33 percent in the first half of 2026, and is expected to exceed a third in 2027.
The right panel shows the revenue hurdle calculated by the author. The cumulative capital spending of the four hyperscalers between 2024 and 2026 amounts to about 1,366 billion dollars. If these assets have an average useful life of five years, their annual depreciation is about 273 billion dollars. A 10 percent return on the capital invested requires a further 137 billion dollars. To justify the investment made so far, the industry would therefore need to generate annual gross profit, before depreciation, of about 410 billion dollars. With a useful life of six years, the requirement falls to about 364 billion dollars. And this calculation does not include the investment planned for 2027 and beyond, nor the operating costs of running data centres, especially electricity.
The question of useful lives is itself contentious. Several companies have extended the depreciable lives of their servers and data centres, which reduces annual depreciation charges and increases reported profits. Critics argue that, given the rapid pace of improvement in AI chips, the economic life of the equipment may be shorter than its accounting life, so that reported profits overstate economic returns. If economic lives are shorter, the revenue hurdle is higher.
There is no reliable public figure for the revenue currently generated by AI services, but it is generally considered to be well below these thresholds. The gap between investment and revenue is the core of the overinvestment debate.
5.6 Inflationary effects
The AI investment wave also has inflationary effects, which have become a concern for the Federal Reserve. Governor Cook noted that AI investment has pushed up prices for chips, computers and software, and that core goods prices were running above a 3 percent annual pace in 2026. Vice Chair Jefferson noted that AI demand is raising costs for producing related goods and services. Data centre construction competes for construction workers, electrical equipment and electricity with other sectors, which spreads price pressures across the economy. The increase in electricity prices, about 4.4 percent over the year to September 2026 in the CPI, is partly attributed to data centre demand.
This is a classic feature of investment booms: in the short run, investment raises demand before it raises supply. The productivity gains that may eventually lower costs come later. In the meantime, the central bank must deal with the demand pressure.
5.7 Imports and the domestic footprint
The gross figures for AI investment overstate its contribution to American GDP because a large part of the equipment is produced abroad. Advanced chips are mostly manufactured in Taiwan, which holds about 70 percent of global semiconductor manufacturing capacity according to estimates reported by Allianz Trade, and servers are frequently assembled in Mexico and Asia. According to the same report, the United States has roughly tripled its purchases of advanced AI-related products since 2023. In the national accounts, each imported server raises investment and imports by the same amount, so its net effect on GDP is zero; only the domestic value added, such as construction, installation, electrical work, domestic components and services, adds to GDP.
The author’s scenario calculations illustrate the importance of this point. If 50 percent of the 730 billion dollars of hyperscaler spending planned for 2026 consists of domestic value added, the direct footprint of this spending on American GDP is about 1.1 percent of GDP, half of the gross figure. With 40 percent domestic content, it is about 0.9 percent; with 60 percent, about 1.35 percent. The domestic share is highest for data centre construction, which is almost entirely domestic, and lowest for chips and servers.
This has a policy implication. Part of the stimulus from AI investment leaks abroad, to the benefit of Asian and Mexican producers, which helps explain the rapid growth of exports of AI-related goods from Taiwan, South Korea and Mexico. It also means that tariffs on these products would raise the cost of the AI buildout for American companies without necessarily increasing domestic production in the short term, an issue discussed in the next article in this series on tariffs.
5.8 The electricity bottleneck
Electricity is the physical counterpart of the investment wave. The EIA expects American electricity consumption to increase by about 93 billion kilowatt hours in 2026 and 68 billion in 2027, after increases of 99 and 85 billion in 2024 and 2025. Four consecutive years of strong growth mark a break with the stagnation of electricity demand between 2007 and 2021, when efficiency gains offset economic growth. Sales to the commercial sector, where data centres are classified, rose by about 5 percent over the year in the third quarter of 2026.
The consequence is visible in prices. The average residential price is expected to rise by about 5.3 percent in 2026, and wholesale prices at the main trading hubs by about 11 percent. For households, this is a channel through which the AI boom affects living standards directly, independently of whether they use AI. For the economy, the capacity of the grid to connect new data centres, and the time needed to build new generation and transmission capacity, are becoming constraints on the pace of investment. In this sense, the energy system may impose the slowdown that financial markets have not yet imposed.
6. Discussion
6.1 Demand now, supply later
The central conclusion of this analysis is that, in 2026, the macroeconomic effects of AI are mainly demand effects. AI investment supports GDP growth, employment in construction and electrical work, and the profits of equipment suppliers. Its supply effects, through higher productivity, are still uncertain and largely in the future.
This sequence has important implications. For growth, it means that the current contribution of AI depends on the continuation of investment. If investment slows, growth will slow, regardless of the long-term promise of the technology. For inflation, it means that AI adds to price pressures in the short term. For monetary policy, it complicates the Fed’s task: the central bank must decide whether to accommodate investment that may raise future productivity or to restrain demand that is adding to current inflation.
6.2 Lessons from the dot-com cycle
The comparison with the dot-com boom is instructive. In 2000, investment in information technology contributed about 28 percent of GDP growth. When the bubble burst in 2001, IT investment fell sharply, contributing to a recession. Yet the productivity gains from IT continued for several years after the crash, as firms learned to use the equipment they had bought. The overinvestment of the late 1990s was financially costly for investors, but the infrastructure built during the boom, especially fibre optic networks, was eventually used.
The current AI wave contributes an even larger share of growth than IT did in 2000. If it followed the same pattern, a correction could have a significant macroeconomic effect. However, there are differences. The dot-com boom was financed largely by equity markets and by young companies with little revenue. The AI boom is financed mainly by large, highly profitable companies with strong balance sheets, although their reliance on debt is increasing. This makes a sudden collapse less likely, but it does not exclude a slowdown if returns disappoint.
6.3 Concentration risks
The AI investment wave is highly concentrated: four companies account for most of the spending, and a few chip suppliers account for most of the equipment. The stock market valuation of the largest technology companies represents a very large share of total market capitalisation. This concentration creates a risk that a change in sentiment about AI, triggered for example by disappointing revenue or a technological shift that makes current equipment obsolete, could have broad effects on financial markets and on household wealth, which in turn affects consumption.
6.4 Distribution of gains
The gains from AI are also unevenly distributed. They accrue first to the owners and shareholders of technology companies, to the regions where data centres are built and to workers with skills complementary to AI. Governor Cook noted that recent college graduates face more difficulty finding first jobs, possibly because AI is performing entry-level tasks, and that employment may have declined in occupations such as software coding and translation. If productivity gains are captured mainly by capital, they may increase inequality and do little for the broad-based consumption that drives most of the economy. This is one of the dimensions of the two-speed economy examined in a later article in this series.
6.5 Energy as a constraint
Electricity is becoming a binding constraint on the expansion of AI. The construction of data centres is limited by access to the grid, and the increase in demand is raising electricity prices for all consumers. The EIA expects natural gas to remain the main source of electricity generation, at about 40 percent, with solar rising from 7 to 9 percent between 2025 and 2027. The growth of AI is therefore linked to energy policy, to the expansion of the grid and to the price of natural gas, which is itself affected by the 2026 energy shock.
7. Scenarios
7.1 A productivity dividend
Figure 6, left panel, shows potential growth from 2027 to 2030 under three productivity paths.
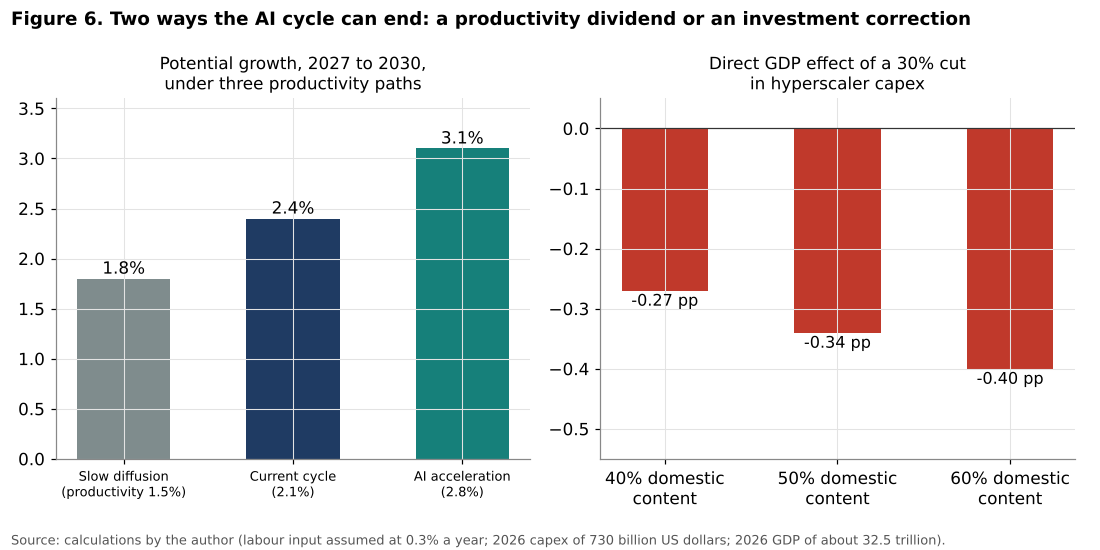
Slow diffusion. Productivity growth returns to 1.5 percent a year, the rate of the 2007 to 2019 cycle, as the current acceleration fades and AI takes longer to spread. With labour input growing at 0.3 percent a year, potential growth is about 1.8 percent.
Current cycle. Productivity growth continues at 2.1 percent a year, its average since 2019. Potential growth is about 2.4 percent, consistent with the FOMC’s median projection of real GDP growth of 2.2 to 2.4 percent in 2027 and 2028.
AI acceleration. AI adoption raises productivity growth to 2.8 percent a year, comparable to the best years of the late 1990s and early 2000s. Potential growth is about 3.1 percent.
The difference between these scenarios is large. By 2030, the level of GDP in the AI acceleration scenario would be about 5.2 percent higher than in the slow diffusion scenario, which, at current prices, represents roughly 1.7 trillion dollars a year. Even the current cycle scenario implies a GDP level about 2.4 percent higher than slow diffusion.
7.2 An investment correction
The right panel of Figure 6 shows the direct effect on GDP of a 30 percent cut in hyperscaler capital spending relative to 2026, which would correspond to a scenario in which the companies scale back their plans because of disappointing returns.
A 30 percent cut represents about 219 billion dollars. If 40 percent of this spending consists of domestic value added (the rest being imports, land and spending abroad), the direct effect on GDP is about 0.27 percentage points. With 50 percent domestic content, it is about 0.34 points, and with 60 percent, about 0.40 points. These direct effects would be amplified by indirect effects on employment, construction, electricity investment and the stock market. A total effect of 0.5 to 1 percentage point of GDP growth over a year is plausible, which would be enough to bring growth close to stagnation if it coincided with other negative shocks.
7.3 Assessment
The two outcomes are not mutually exclusive. The most likely scenario, in the author’s view, combines a gradual slowdown of investment growth from 2027, as capital spending reaches the limits of cash flow and the revenue hurdle becomes binding, with a slow but real contribution of AI to productivity. In this scenario, AI does not produce a sudden acceleration of growth, but it helps sustain productivity growth at around 2 percent a year, which allows potential growth of about 2.3 to 2.5 percent despite slow labour force growth.
The main risk is a disorderly correction, in which a change in sentiment triggers a sharp fall in investment and in technology stock prices before the productivity gains have materialised. The main upside is that AI adoption spreads faster than expected, as the survey evidence on adoption suggests it might.
7.4 Indicators to monitor
The author suggests monitoring:
1. the quarterly capital expenditure and cash flow of the four hyperscalers, and the share financed by debt; 2. Census data on data centre construction spending; 3. nonfarm business labour productivity, especially in sectors that use AI intensively; 4. the price indexes for information processing equipment and electricity; 5. the adoption of AI by firms, measured by Census Bureau business surveys and the Federal Reserve’s surveys of small businesses.
8. Conclusion
Can artificial intelligence sustain American growth? The answer depends on the time horizon.
In the short term, AI investment is already supporting growth. The capital spending of the four largest cloud companies is reaching about 2.2 percent of GDP in 2026, data centre construction is growing by more than 70 percent a year, and AI-related categories of investment accounted for about 39 percent of GDP growth in 2025, more than at the peak of the dot-com boom. But this support is a demand effect, which lasts only as long as the investment continues, and which adds to inflationary pressures.
In the long term, AI can sustain growth only if it raises productivity. The evidence so far is encouraging but not conclusive: productivity growth in the current cycle, at 2.1 percent a year, is stronger than in the previous one, and micro studies show substantial gains in specific tasks, but there is not yet a visible break in aggregate data attributable to AI.
Between the two lies a period of risk. The financial test is demanding: the industry needs to generate annual gross profits of about 360 to 410 billion dollars to justify the investment made between 2024 and 2026, and capital spending is now absorbing nearly all of the hyperscalers’ operating cash flow. If returns disappoint, a correction in investment could subtract up to several tenths of a percentage point from GDP growth directly, and more through indirect effects.
The history of general purpose technologies suggests that both outcomes are possible at the same time: an investment correction followed by a long period of productivity gains. For the American economy, the challenge is to reach the second phase without a severe disruption in the first.
Need this analysis for your organisation?
We prepare confidential briefings, executive talks and studies on countries, markets and policies, built on the same method as this article.
Request a briefingSupport independent analysis
Our studies are free to read and carry no advertising. If this one was useful, a small contribution helps us publish the next.
Support our workGo further: books by Global Strategy Files


Frequently asked questions
How much are US tech companies investing in AI in 2026?
The four largest cloud companies, Amazon, Microsoft, Alphabet and Meta, guided to combined capital spending of about 730 billion dollars in 2026, against about 410 billion in 2025 and 226 billion in 2024, rising to about 2.2 percent of US GDP.
How much does AI investment contribute to US growth?
A great deal. AI-related categories of investment accounted for about 39 percent of real GDP growth in the first nine months of 2025, more than at the peak of the dot-com boom, and data centre construction reached a record annual rate of 84.95 billion dollars in August 2026.
Has AI raised US productivity yet?
Not clearly. Labour productivity has grown at 2.1 percent a year in the current business cycle, faster than in the previous cycle, but there is not yet a clear break attributable to artificial intelligence, so the benefits are likely to come later than the investment.
Is there a risk of overinvestment in AI data centres?
Yes, the financial test is demanding. To justify the 1.37 trillion dollars spent between 2024 and 2026, the industry would need annual gross profits of about 360 to 410 billion dollars, so demand effects of AI currently dominate its supply effects.
Methodological note
All calculations were carried out by the author. Hyperscaler capital spending figures are taken from company guidance and quarterly reports as compiled in the financial press after the second quarter 2026 results; they include finance leases where reported by the companies. Shares of GDP use 2024 nominal GDP of 29.18 trillion dollars and author approximations of 30.5 trillion dollars for 2025 and 32.5 trillion dollars for 2026. Contributions to growth in 2025 are taken from the Federal Reserve Bank of St. Louis. Productivity data are from the BLS release of 3 September 2026. The revenue hurdle and the scenarios are illustrative calculations by the author and do not constitute investment advice.
References
Acemoglu, D. (2025). The Simple Macroeconomics of AI. Economic Policy, 40(121), 13 to 58.
Allianz Trade (2026). Report on global trade in AI-enabling goods, as summarised by Insurance Business, 2026.
Bick, A., Blandin, A. and Deming, D. J. (2024). The Rapid Adoption of Generative AI. NBER Working Paper 32966.
Brandsaas, E. and others (2025). Estimating Aggregate Data Center Investment with Project-Level Data. Finance and Economics Discussion Series 2025-109. Board of Governors of the Federal Reserve System.
Briggs, J. and Kodnani, D. (2023). The Potentially Large Effects of Artificial Intelligence on Economic Growth. Goldman Sachs Global Economics Analyst, March 2023.
Brynjolfsson, E., Li, D. and Raymond, L. (2025). Generative AI at Work. Quarterly Journal of Economics, 140(2), 889 to 942.
Brynjolfsson, E., Rock, D. and Syverson, C. (2021). The Productivity J-Curve: How Intangibles Complement General Purpose Technologies. American Economic Journal: Macroeconomics, 13(1), 333 to 372.
Bureau of Economic Analysis (2026). Gross Domestic Product, Second Quarter 2026 (Third Estimate). News release, September 2026.
Bureau of Labor Statistics (2026). Productivity and Costs, Second Quarter 2026, Revised. News release, 3 September 2026.
Cook, L. D. (2026). An Update on AI and the Economy. Speech, Board of Governors of the Federal Reserve System, 28 September 2026.
Energy Information Administration (2026). Short-Term Energy Outlook, October 2026. Washington, DC.
Federal Reserve Bank of St. Louis (2026). Tracking AI’s Contribution to GDP Growth. On the Economy, January 2026.
Gordon, R. J. (2016). The Rise and Fall of American Growth. Princeton University Press.
Jefferson, P. N. (2026). The U.S. Economy and Monetary Policy. Speech at the Darden School of Business, University of Virginia, 1 October 2026.
Noy, S. and Zhang, W. (2023). Experimental Evidence on the Productivity Effects of Generative Artificial Intelligence. Science, 381(6654), 187 to 192.
Oliner, S. D. and Sichel, D. E. (2000). The Resurgence of Growth in the Late 1990s: Is Information Technology the Story? Journal of Economic Perspectives, 14(4), 3 to 22.
Perez, C. (2002). Technological Revolutions and Financial Capital: The Dynamics of Bubbles and Golden Ages. Edward Elgar.
Solow, R. M. (1987). We’d Better Watch Out. New York Times Book Review, 12 July 1987, p. 36.
