
Canada’s Export Diversification in 2026: How Much Is Real, and How Much Is Gold?

Canada’s Export Diversification in 2026: How Much Is Real, and How Much Is Gold?
Driss EFFINA, PhD Independent Researcher, Global Strategy Files Reading time: about 25 minutes
Key takeaways
- Canadian exports to countries other than the United States rose 17.2 percent in 2025 and 32.2 percent over the twelve months to August 2026.
- The United Kingdom, largely through unwrought gold, accounted for 58 percent of the rise in non-American exports from April 2025 to April 2026.
- The equivalent number of non-American export markets fell from about 11 to about 8, so diversification became more concentrated.
- The US share of exports could fall to about 63 percent by 2030, or return above 71 percent if the gold boom reversed.
Abstract
Since 2025, Canadian political leaders have made the diversification of exports away from the United States a national priority. The trade data appear to show remarkable success: exports to countries other than the United States rose by 17.2 percent in 2025 and by 32.2 percent over the twelve months to August 2026, and the American share of Canadian merchandise exports has fallen to its lowest level on record. This article examines the quality of this diversification. Using Statistics Canada and Global Affairs Canada data, the author computes the contributions of each market and each product group to the growth of non-American exports, concentration indices for export destinations, and three scenarios for the American share to 2030. The results show that diversification so far is real in volume but narrow in substance. The United Kingdom alone, largely through shipments of unwrought gold, accounted for 58 percent of the increase in monthly non-American exports between April 2025 and April 2026, and its share of non-American exports rose from about 15 percent in 2024 to 31 percent in December 2025. The concentration of non-American exports has increased: the equivalent number of non-American markets, measured by the inverse of the Herfindahl index among the main partners, fell from about 11 to about 8. By product, commodities, chiefly energy and metal products including gold, account for all of the estimated growth of Canadian exports in the first eight months of 2026, while motor vehicles and forestry products subtracted from it. The number of firms exporting only to non-American markets increased by 1.8 percent in 2025, the first increase since 2019, which is a more durable sign of change. In scenarios to 2030, the American share could fall to about 63 percent if current trends continue, but could return above 71 percent if the gold boom reversed. The article concludes that genuine diversification will require manufacturing and services to find new markets, which depends on infrastructure, trade agreements and the international expansion of firms.
Keywords: Canada, export diversification, trade policy, Herfindahl index, gold, energy, CETA, CPTPP, trade infrastructure
JEL codes: F14, F13, F15, Q37, O51
1. Introduction
The trade conflict with the United States has led Canadian governments to make export diversification an explicit objective of economic policy. The objective is not new: Canada has pursued it at various times since the 1970s, notably with the “Third Option” of the Trudeau government in 1972, which aimed to reduce dependence on the United States by strengthening relations with Europe and Japan, and more recently with the free trade agreements with the European Union (CETA, provisionally applied since 2017) and the Pacific region (CPTPP, in force for Canada since the end of 2018). Each time, the American share of exports eventually returned to its historical level.
The difference in 2025 and 2026 is the scale of the shock. American tariffs, legal uncertainty and the CUSMA review have given Canadian firms strong incentives to look for other customers. And the data show changes of a magnitude never seen before: the American share of merchandise exports fell from 75.9 percent in 2024 to 71.7 percent in 2025, and to 68.3 percent over the twelve months to August 2026. In October 2025, it fell to 67.3 percent in a single month, the lowest on record outside the pandemic.
But a fall in the American share can result from very different mechanisms. It can reflect new markets for manufactured goods, which would indicate a lasting change in the structure of trade. It can reflect a temporary boom in commodity prices, which would reverse when prices fall. Or it can reflect a decline in exports to the United States without any real gain elsewhere. This article distinguishes these mechanisms with the available data.
The previous articles in this series examined Canada’s dependence on the American market, its housing market and its productivity. This article, the last of the series on Canada, focuses on the composition and durability of export diversification.
Section 2 presents the context. Section 3 reviews the literature on export diversification. Section 4 presents the data and methods. Section 5 presents the results. Section 6 discusses them. Section 7 presents scenarios to 2030. Section 8 concludes.
2. Context
2.1 The instruments of diversification
Canada has an extensive network of free trade agreements. Beyond CUSMA, the most important are the Comprehensive Economic and Trade Agreement with the European Union, the Comprehensive and Progressive Agreement for Trans-Pacific Partnership, which includes Japan, Australia, Vietnam, Mexico and, since December 2024, the United Kingdom, the trade continuity agreement with the United Kingdom, and the free trade agreement with South Korea. Canada is negotiating with the Association of Southeast Asian Nations, and has signed or is negotiating agreements with Indonesia, Ecuador and other partners. In principle, Canadian exporters already have preferential access to markets representing a large part of the world economy.
In practice, these agreements have been under-used. Many Canadian exporters, particularly small and medium-sized firms, have never needed to look beyond the American market, and the costs of entering distant markets, including transport, certification, distribution networks and language, are significant.
2.2 Infrastructure
Physical infrastructure determines what can be exported, and where. For most of its history, Canada’s export infrastructure for energy was oriented almost exclusively toward the United States. Two major projects have changed this. The expansion of the Trans Mountain pipeline, which entered service in May 2024 and nearly tripled its capacity to about 890,000 barrels per day, allows Canadian crude oil to reach tankers on the Pacific coast and from there Asian and other markets. LNG Canada, in Kitimat, British Columbia, began exporting liquefied natural gas to Asia in 2025, making Canada an exporter of liquefied natural gas for the first time on a large scale. These two projects, decided years before the trade conflict, are key drivers of the diversification of energy exports.
2.3 Obstacles in other markets
Diversification has also met obstacles. In 2025, China imposed tariffs on Canadian canola oil, canola meal and other agricultural and fishery products, and preliminary anti-dumping duties on canola seed, in response to Canadian tariffs on Chinese electric vehicles, steel and aluminium. These measures affected a major Canadian export to China. Relations with India, another large potential market, were strained for several years. The geopolitical environment makes diversification toward some large emerging markets more difficult than economic factors alone would suggest.
3. Literature review
The literature on export diversification offers several relevant insights.
The first concerns the relationship between diversification and development. Imbs and Wacziarg (2003) showed that countries diversify their production as they become richer, up to a high level of income, after which they tend to specialise again. Cadot, Carrère and Strauss-Kahn (2011) found a similar pattern for export diversification. Canada, as a rich economy with large natural resources, is relatively specialised in commodities.
The second concerns the margins of trade. Hummels and Klenow (2005) showed that larger economies export more goods to more markets (the extensive margin) rather than simply more of the same goods (the intensive margin). Besedeš and Prusa (2011) showed that the survival of new export relationships is low: many new trade relationships do not last more than one or two years. This finding is important for interpreting the surge of Canadian exports to new markets: many of these new flows may prove temporary.
The third concerns the role of firms. Melitz (2003) showed that only the most productive firms can bear the fixed costs of exporting, and that trade liberalisation leads to a reallocation of resources toward these firms. Bernard, Jensen, Redding and Schott (2007) documented that exporting is concentrated in a small number of large firms. Diversification therefore depends on the ability of firms to expand and to absorb the costs of entering new markets.
The fourth concerns gravity. As discussed in the article on Canada’s dependence on the American market, gravity models show that distance strongly reduces trade (Head and Mayer, 2014). The economic size of distant markets must be very large to compensate for distance. This explains why Canada’s trade with Europe and Asia has historically been much smaller than its trade with the United States, despite free trade agreements.
Finally, the Fraser Institute (2026) documented that Canadian dependence on the American market has been “sticky” since 2011, despite diversification policies, while the non-American share of Canadian services exports rose from 38.8 to 45.4 percent between 1999 to 2011 and 2012 to 2024. Services may offer more scope for diversification than goods.
4. Data and methodology
4.1 Data
- Statistics Canada international merchandise trade data on a balance of payments basis, by principal trading partner, for April 2025 and April 2026, and annual data for 2024 and 2025.
- Global Affairs Canada monthly trade reports for December 2025 and August 2026, which give exports by market and by product group, with year-to-date growth rates.
- Statistics Canada data on the number of exporting enterprises in 2025, as reported by The Hub (2026).
- The Fraser Institute (2026) for long-run structural shares.
4.2 Indicators
1. Contributions to the growth of non-American exports. For each partner, the change in monthly exports between April 2025 and April 2026 is divided by the total change in exports to non-American destinations. 2. Concentration of destinations. The Herfindahl-Hirschman index is the sum of the squared shares (in percent) of each partner. It is calculated for the ten principal partners; the rest of the world, which represents about 10 percent of exports and is dispersed among many countries, is treated as fragmented, which makes the index a lower bound. The inverse of the index, multiplied by 10,000, gives the “equivalent number of markets”: the number of equal-sized markets that would produce the same concentration. The index is calculated for all exports and for non-American exports only. 3. Contributions of product groups to export growth. For each product group, the level of exports in August 2026 is deflated by its year-to-date growth to estimate its weight in 2025, and its contribution to total growth is the weight multiplied by its growth rate. This is an approximation, since it uses monthly levels as weights. 4. Scenarios for the American share. Starting from exports over the twelve months to July 2026 (571.0 billion dollars to the United States out of 833.7 billion), the author projects exports to the United States and to other countries under different growth rates.
4.3 Limitations
The April comparisons use single months, which are volatile. The product group contributions use monthly weights. The data are in nominal terms and are affected by prices, particularly for gold and energy. The scenarios are illustrative.
5. Results
5.1 Growth by market
Figure 1 shows the change in Canadian goods exports by market in 2025.
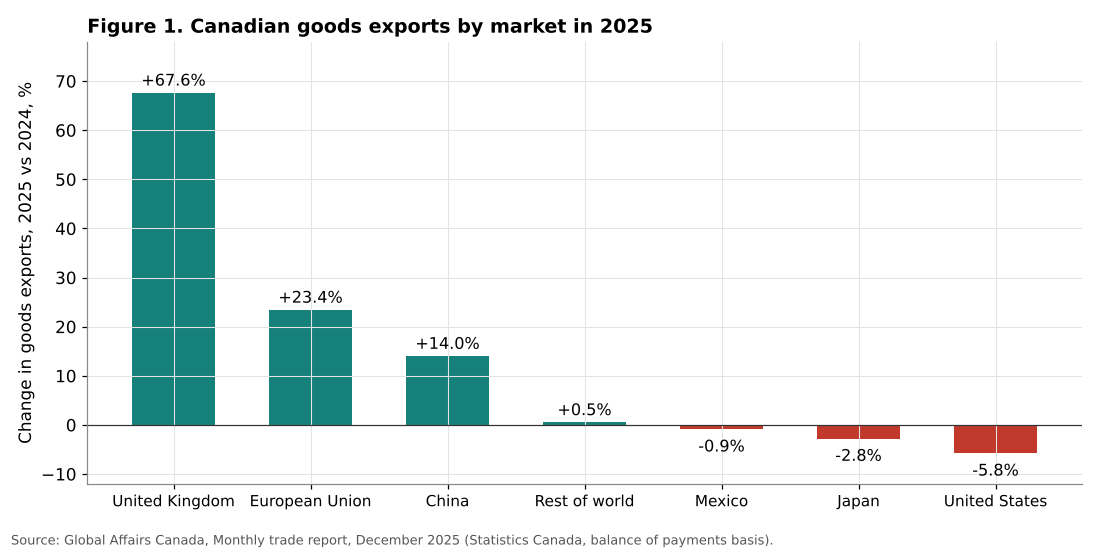
In 2025, exports to the United States fell by 5.8 percent, while exports to the United Kingdom rose by 67.6 percent, to the European Union by 23.4 percent and to China by 14.0 percent. Exports to Mexico (-0.9 percent) and Japan (-2.8 percent) declined slightly, and exports to the rest of the world were almost unchanged (+0.5 percent). Total goods exports were roughly stable (-0.2 percent).
The pattern continued in 2026. In the first eight months of 2026, compared with the same period of 2025, exports to the United Kingdom rose by a further 81.7 percent, to China by 39.3 percent, to Mexico by 22.0 percent and to the European Union by 16.2 percent, while exports to Japan fell by 6.8 percent. Total exports rose by 15.1 percent, driven by higher energy prices and volumes and by precious metals, and exports to the United States recovered by 7.6 percent.
5.2 Who drove the growth of non-American exports?
Figure 2 decomposes the change in monthly non-American exports between April 2025 and April 2026.
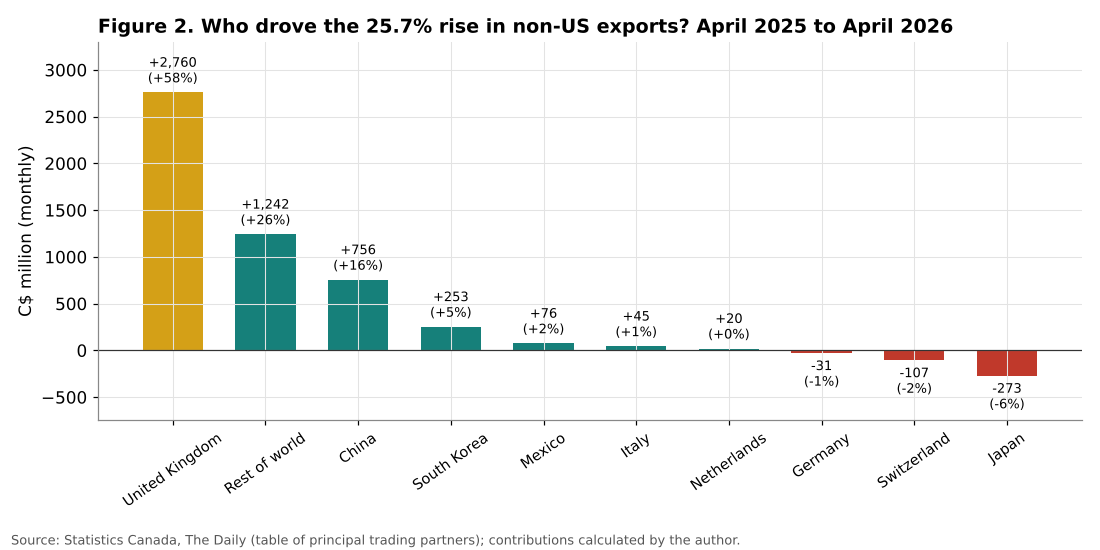
Monthly exports to destinations other than the United States rose from 18.4 billion dollars in April 2025 to 23.2 billion in April 2026, an increase of 4.7 billion dollars or 25.7 percent. The contributions of individual markets were very unequal:
| Market | Change (C$ million) | Contribution |
|---|---|---|
| United Kingdom | +2,760 | 58% |
| Rest of world | +1,242 | 26% |
| China | +756 | 16% |
| South Korea | +253 | 5% |
| Mexico | +76 | 2% |
| Italy | +45 | 1% |
| Netherlands | +20 | 0% |
| Germany | -31 | -1% |
| Switzerland | -107 | -2% |
| Japan | -273 | -6% |
Table 1. Contributions to the change in monthly non-American exports, April 2025 to April 2026. Source: Statistics Canada; calculations by the author.
The United Kingdom alone accounted for 58 percent of the increase. China accounted for 16 percent and South Korea for 5 percent. The large European economies, Germany, Italy and the Netherlands, contributed very little, and exports to Japan fell. The rest of the world, a heterogeneous group including India, Southeast Asia, the Middle East and Latin America, contributed about a quarter.
The case of the United Kingdom is crucial. Canadian exports to the United Kingdom consist to a large extent of unwrought gold, refined in Canada and shipped to London, which is the centre of the global gold market. As the price of gold reached record levels in 2025 and 2026, the value of these shipments soared. In 2024, Canadian exports to the United Kingdom were 27.0 billion dollars on a customs basis, already 88 percent more than in 2023. In 2025, they rose by a further two thirds. This growth reflects the price of gold and decisions about where to store and trade it rather than a deepening of commercial relationships between Canadian and British firms.
5.3 Concentration of non-American exports
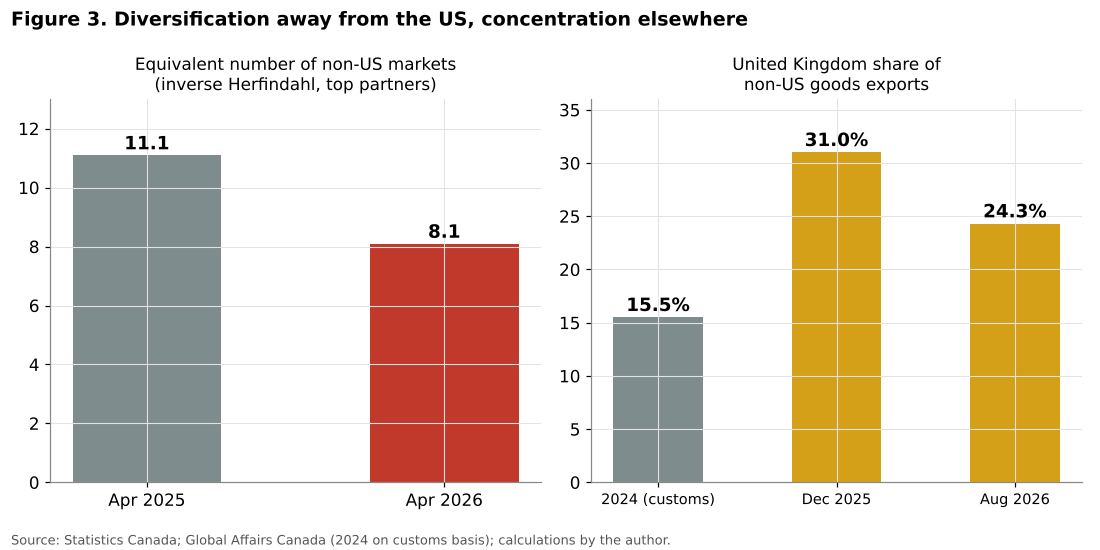
Figure 3 presents two measures of the concentration of non-American exports.
The Herfindahl index of all exports, calculated for the ten principal partners, was about 4,900 in both April 2025 and April 2026, corresponding to an equivalent number of markets of about 2. This very high concentration simply reflects the weight of the United States, which was about 69 percent in both months.
Among non-American destinations, however, concentration increased markedly. The Herfindahl index of non-American exports rose from about 900 in April 2025 to about 1,230 in April 2026, and the equivalent number of non-American markets fell from about 11 to about 8. In other words, the growth of non-American exports has made them less diversified, not more, because it has been concentrated in one market.
The share of the United Kingdom in non-American goods exports illustrates this. It was about 15.5 percent in 2024 (customs basis), rose to 31.0 percent in December 2025 and was 24.3 percent in August 2026. Canada has partly replaced a dependence on one buyer of many goods, the United States, with a dependence on one buyer of one good, the London gold market.
5.4 Which products?
Figure 4 shows the estimated contribution of each product group to the growth of total exports in the first eight months of 2026.
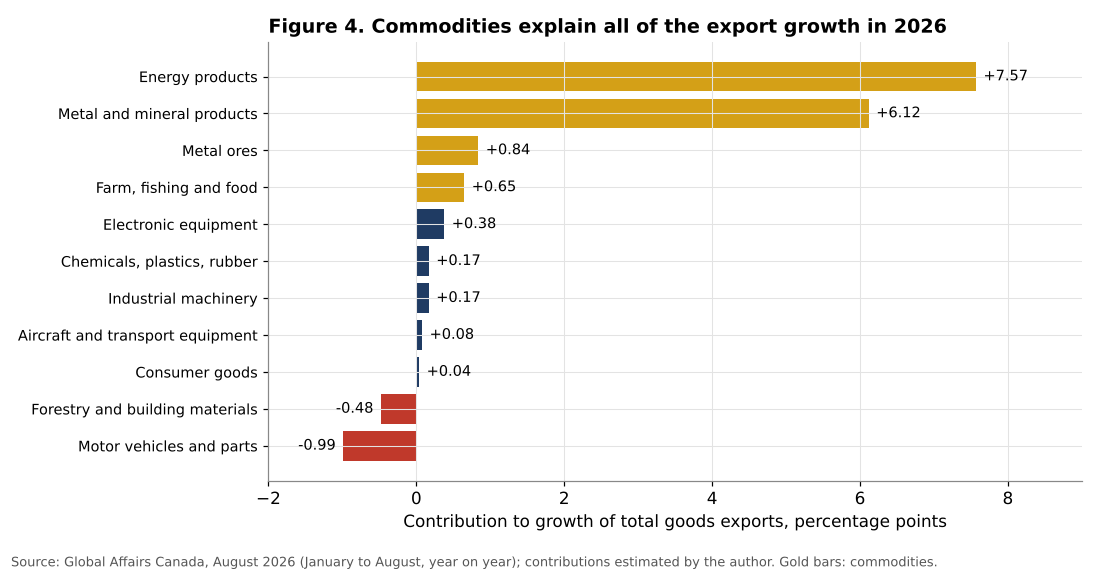
The results are unambiguous. Energy products contributed about 7.6 percentage points to the growth of total goods exports, and metal and non-metallic mineral products, which include gold, about 6.1 points. Metal ores contributed 0.8 points and farm, fishing and food products 0.7 points. Together, commodities account for all of the estimated export growth of about 14.6 percent (official figure: 15.1 percent). Manufactured goods contributed almost nothing: industrial machinery, electronic equipment, aircraft, chemicals and consumer goods together added less than 1 point, while motor vehicles and parts (-1.0 point) and forestry and building materials (-0.5 point) subtracted from growth.
| Product group | YTD growth 2026 | Contribution (points) |
|---|---|---|
| Energy products | +35.7% | +7.57 |
| Metal and mineral products | +44.1% | +6.12 |
| Metal ores | +23.4% | +0.84 |
| Farm, fishing and food | +8.1% | +0.65 |
| Electronic equipment | +7.1% | +0.38 |
| Industrial machinery | +2.4% | +0.17 |
| Chemicals, plastics, rubber | +3.4% | +0.17 |
| Aircraft and transport equipment | +1.9% | +0.08 |
| Consumer goods | +0.3% | +0.04 |
| Forestry and building materials | -7.6% | -0.48 |
| Motor vehicles and parts | -7.8% | -0.99 |
Table 2. Contributions of product groups to export growth, January to August 2026. Source: Global Affairs Canada; calculations by the author.
This confirms the pattern identified in the article on Canada’s dependence on the American market: commodities, which are traded on world markets at world prices, can be redirected easily; manufactured goods, embedded in North American supply chains, cannot.
5.5 Firms and services
Figure 5 presents two indicators of slower, but potentially more durable, structural change.
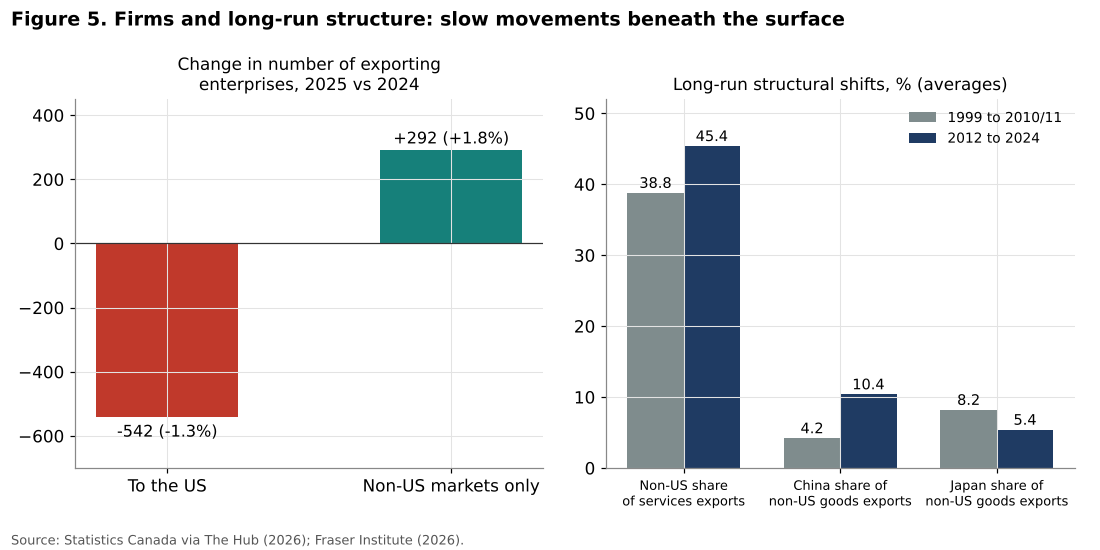
According to Statistics Canada data reported by The Hub, the total number of exporting enterprises in Canada was 47,948 in 2025, almost unchanged from 2024 (-0.2 percent). The number of firms exporting to the United States fell by 542 (-1.3 percent), mainly among small and medium-sized enterprises. The number of firms exporting only to non-American markets rose by 292 (+1.8 percent), the first increase since 2019.
This is a small change in absolute terms, but it is qualitatively important. The literature on firm heterogeneity shows that diversification at the level of the economy depends on the entry of firms into new markets, which involves fixed costs that only some firms can bear. The increase in the number of firms selling only outside the United States suggests that at least some firms are making the investment needed to access new markets.
Services also deserve attention. The Fraser Institute documented that the share of non-American destinations in Canadian services exports rose from 38.8 percent on average in 1999 to 2011 to 45.4 percent in 2012 to 2024, a much larger and more steady shift than for goods. Services exports, including software, engineering, financial and educational services, are less affected by distance and by tariffs, and may offer the most promising avenue for durable diversification. In 2025, Canadian services exports grew by 3.2 percent, and they continued to grow in 2026.
Over the long run, the composition of non-American goods exports has also shifted. According to the Fraser Institute, the share of China rose from 4.2 percent to 10.4 percent between the two periods it studied, while that of Japan fell from 8.2 to 5.4 percent, reflecting the rise of China as a buyer of Canadian commodities.
5.6 Energy: the infrastructure effect
Energy deserves a separate analysis, because it is the product group where diversification is most likely to be durable. In 2025, Canadian energy exports fell by 6.9 percent, mainly because of lower prices. In 2026, they recovered strongly: in the first eight months, energy exports were 35.7 percent higher than a year earlier, and in August 2026 alone they reached 19.0 billion dollars, against 13.6 billion in December 2025. The increase reflects higher oil prices linked to the conflict in the Middle East, higher volumes, and a surge in refined petroleum exports, whose prices rose by more than 50 percent over the year.
Most Canadian energy exports still go to the United States, through the dense network of pipelines that cross the border. But the share that can reach other markets has increased structurally since 2024. Crude oil loaded at the Westridge Marine Terminal near Vancouver can be shipped to Asia, to California or to other destinations, and Canadian liquefied natural gas now reaches Asian buyers. These flows give Canadian producers an alternative that did not exist before, which strengthens their bargaining position and reduces the discount at which Canadian crude was sold to American refiners. The value of this alternative is not fully reflected in the share of exports going to other markets: even when most oil is still sold to American buyers, the existence of other outlets raises its price.
5.7 The trade balance perspective
Diversification of exports has not been accompanied by a corresponding change in imports. In 2025, Canada’s merchandise trade deficit with countries other than the United States widened to 112.9 billion dollars, from 108.4 billion in 2024, because imports from these countries rose by 12.4 percent, faster than exports in absolute terms. In August 2026, the monthly deficit with non-American partners was 7.0 billion dollars. Canada continues to buy much more from Asia and Europe than it sells to them, and finances this deficit through its surplus with the United States.
This asymmetry has two implications. First, the diversification of exports does not reduce Canada’s dependence on the American market as a source of net foreign earnings. Second, it suggests that there is potential for import substitution in some sectors, but also that Canadian firms are deeply integrated into global supply chains as buyers of components, machinery and consumer goods from Asia and Europe, which makes them sensitive to trade disruptions on both sides.
6. Discussion
6.1 Three types of diversification
The analysis suggests that the diversification observed in 2025 and 2026 has three components of very different quality.
The first is price-driven diversification: the increase in the value of gold exports to the United Kingdom, and to a lesser extent of other precious metals. This component explains a large part of the fall of the American share, but it is reversible: if gold prices fell, or if gold flows shifted to other trading centres, it would disappear.
The second is infrastructure-driven diversification: the increase of energy exports to non-American markets made possible by the Trans Mountain expansion and LNG Canada. This component is more durable, because it is based on long-lived physical assets and long-term contracts. Its size depends on energy prices, but the ability to reach non-American buyers will remain.
The third is firm-driven diversification: the entry of Canadian firms into new markets for manufactured goods and services. This is the most durable and most valuable component, because it creates new commercial relationships and capabilities. The data show that it exists, as the increase in the number of firms exporting only outside the United States suggests, but that it is still small.
6.2 Why manufacturing has not diversified
Manufactured goods have not found alternative markets for several reasons. First, many Canadian manufacturing industries are integrated into North American supply chains, particularly the automotive industry, in which parts and vehicles cross the border several times. These products are designed for a specific customer in a specific supply chain and cannot be sold elsewhere. Second, distance and transport costs make it difficult for Canadian manufacturers to compete in Europe and Asia against local producers or against competitors closer to these markets. Third, entering a new market requires investments in distribution, marketing, certification and after-sales service that take years to pay off, and many firms prefer to wait for the outcome of the CUSMA review before committing to them.
6.3 The role of public policy
Public policy can support diversification in several ways.
Infrastructure. The experience of Trans Mountain and LNG Canada shows that infrastructure can change the geography of trade. Additional port capacity on the Pacific and Atlantic coasts, rail and road links, and energy export facilities, including liquefied natural gas on the Atlantic coast for European markets, would expand the range of possible destinations. These projects require long approval processes and large investments, and the federal government has introduced legislation to accelerate the approval of projects of national interest.
Trade agreements. Canada already has preferential access to many markets but under-uses it. Programmes that help firms, particularly small and medium-sized firms, to use CETA and CPTPP, through information, trade missions, export financing and insurance from Export Development Canada, and support for certification, can reduce the fixed costs of entry. New agreements with Southeast Asia, India and South America would broaden access further.
Diplomacy. Trade with China and India depends on political relations. The tariffs imposed by China on Canadian agricultural products in 2025 show that diversification toward large emerging markets carries its own risks. A diversified trade strategy must therefore seek many partners rather than replace one large dependence with another.
Services. Policies that support the export of services, including the recognition of professional qualifications, digital trade provisions in trade agreements and the attraction of foreign students and tourists, could strengthen the most dynamic component of diversification.
6.4 The limits of diversification
It is important to be realistic about what diversification can achieve. Gravity models predict that the United States will remain Canada’s dominant market as long as the American economy remains large and close. No realistic amount of diversification could replace the American market for most Canadian manufacturers within a decade. The objective of diversification should therefore be to reduce vulnerability, by ensuring that a significant share of exports and a significant number of firms have alternatives, rather than to replace the American market.
6.5 Lessons from other countries
International experience suggests that large and durable changes in export destinations are possible, but that they take decades and usually require a combination of external shocks and domestic adjustment. Australia offers the clearest example. When the United Kingdom joined the European Economic Community in 1973, Australia lost privileged access to its main historical market. Over the following decades, it reoriented its exports toward Japan, then Korea, and later China, helped by geographical proximity to Asia and by the complementarity between its resources and Asian industrialisation. This shift was driven mainly by commodities, which is similar to the Canadian case, and it made Australia dependent on China, which became a source of vulnerability when political relations deteriorated around 2020.
Mexico offers a contrasting example. Despite free trade agreements with the European Union, Japan and many other countries, Mexico remains even more dependent on the American market than Canada, because its manufacturing sector is deeply integrated into North American supply chains. The lesson for Canada is that free trade agreements alone do not diversify trade when the structure of production is oriented toward a neighbouring market.
6.6 Measuring diversification correctly
The analysis also has a methodological implication. The share of the United States in total exports, which dominates public discussion, is a poor indicator of diversification, because it can fall for reasons unrelated to the creation of new commercial relationships: a rise in the price of a commodity sold elsewhere, a fall in exports to the United States, or a change in the routing of shipments. Better indicators would include the American share excluding precious metals and energy, the number of exporting firms by destination, the number of distinct product and market combinations exported, the survival rate of new export relationships, and the concentration of exports among non-American markets. Statistics Canada already publishes data that would allow most of these indicators to be calculated regularly. Publishing a regular dashboard of diversification indicators would allow policymakers and the public to distinguish lasting progress from temporary fluctuations.
6.7 Diversification and the negotiation with the United States
Finally, diversification has a strategic value in the negotiation with the United States. A Canada that can credibly sell part of its energy, minerals and agricultural products elsewhere has more bargaining power than a Canada that depends entirely on American buyers. The exemption of Canadian energy, potash and critical minerals from the Section 338 duties of 2026 suggests that the United States recognises its own need for these products. Diversification of commodities is therefore not only a commercial strategy but also a source of leverage, even if the bulk of Canadian manufacturing remains tied to the North American market.
7. Scenarios to 2030
7.1 Three paths for the American share
Figure 6 presents three scenarios for the share of the United States in Canadian goods exports to 2030.
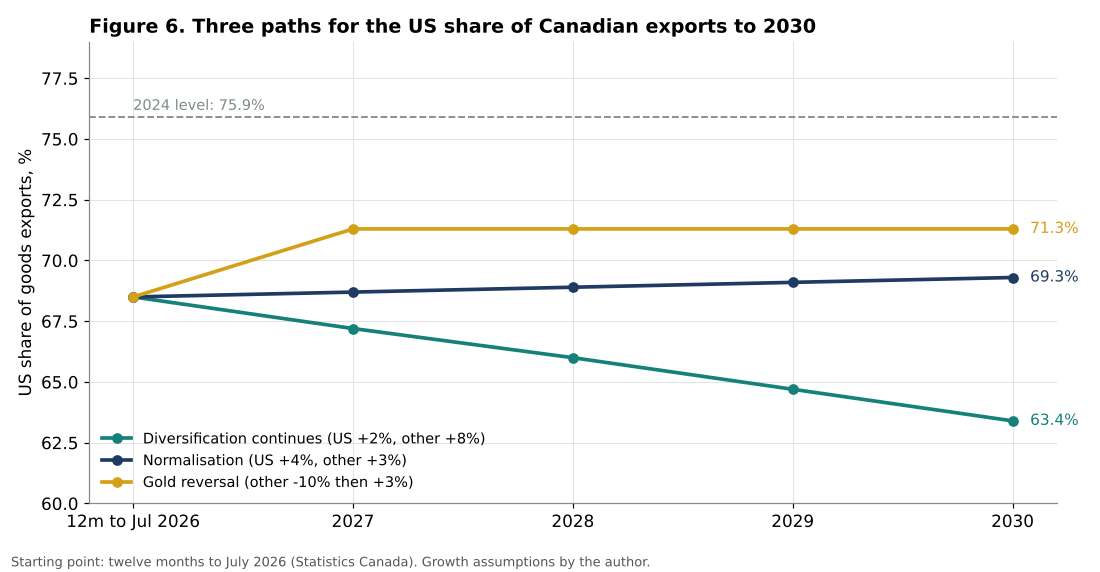
The starting point is the twelve months to July 2026, when the United States received 571 billion dollars of Canadian goods out of a total of 834 billion, a share of 68.5 percent.
Scenario A: Diversification continues. Exports to the United States grow by 2 percent per year, while exports to other markets grow by 8 percent per year, as infrastructure, trade agreements and firm entry continue to support non-American sales. The American share falls to about 63.4 percent in 2030, a level never seen in the modern history of Canadian trade.
Scenario B: Normalisation. An agreement in the CUSMA review restores more normal trading conditions. Exports to the United States grow by 4 percent per year and exports to other markets by 3 percent. The American share stabilises around 69 percent.
Scenario C: Gold reversal. The price of gold falls, and exports to other markets decline by 10 percent in 2027 before growing by 3 percent per year thereafter, while exports to the United States grow by 3 percent per year. The American share rises back to about 71 percent, close to its 2025 level.
7.2 Assessment
The scenarios show that the future of the American share depends heavily on a single price, that of gold, and on the outcome of a single negotiation, the CUSMA review. In the author’s view, scenario B is the most likely central case, because the factors that bind Canadian manufacturing to the American market have not changed and because part of the recent diversification is reversible. But the energy infrastructure built in recent years means that the American share is unlikely to return to the 75 to 76 percent observed before 2025.
Two further observations support this assessment. First, the growth of exports to China in 2026, at 39.3 percent over the first eight months, shows that large Asian markets remain open to Canadian commodities despite the trade frictions of 2025, which gives some support to scenario A. Second, the decline of exports to Japan, a long-standing partner with which Canada has a free trade agreement through CPTPP, shows that agreements alone do not guarantee growth; demand conditions and the competitiveness of Canadian products matter as much.
7.3 Indicators to monitor
1. The American share of exports excluding unwrought gold and precious metals, which would show the underlying trend. 2. The equivalent number of non-American markets, calculated from monthly partner data. 3. Exports of manufactured goods to non-American markets, particularly machinery, electronics and aircraft. 4. The number of firms exporting outside the United States, published annually by Statistics Canada. 5. Services exports by destination.
8. Conclusion
This article has examined the quality of Canada’s export diversification since 2025. Its main conclusions are:
1. The diversification is real in volume: non-American exports rose by 17.2 percent in 2025 and by about a quarter between April 2025 and April 2026. 2. It is narrow in substance: the United Kingdom, largely through gold, accounted for 58 percent of the increase in monthly non-American exports between April 2025 and April 2026, and the concentration of non-American exports increased, with the equivalent number of markets falling from about 11 to about 8. 3. Commodities, chiefly energy and metal products including gold, account for all of the estimated growth of Canadian exports in 2026, while manufactured goods have not found new markets. 4. The number of firms exporting only outside the United States rose by 1.8 percent in 2025, the first increase since 2019, a modest but meaningful sign of change. 5. The American share could fall to about 63 percent by 2030 if trends continue, but could return to about 71 percent if the gold boom reverses.
Canada’s export diversification has so far been driven more by the price of gold and by energy infrastructure decided years ago than by a transformation of its commercial relationships. Durable diversification will require Canadian manufacturing and services firms to establish themselves in new markets, which takes years of investment, supportive public policy and stable international relations. The trade conflict with the United States has created a strong incentive to begin this process. The data show that it has begun, but that it is only at its beginning.
Need this analysis for your organisation?
We prepare confidential briefings, executive talks and studies on countries, markets and policies, built on the same method as this article.
Request a briefingSupport independent analysis
Our studies are free to read and carry no advertising. If this one was useful, a small contribution helps us publish the next.
Support our workGo further: books by Global Strategy Files


Frequently asked questions
Is Canada diversifying its exports away from the United States?
Yes in value, but narrowly. Exports to countries other than the United States rose 17.2 percent in 2025 and 32.2 percent over the twelve months to August 2026, yet commodities, chiefly energy and metal products including gold, account for all of the estimated export growth in 2026.
What role does gold play in Canada’s export diversification?
A very large one. The United Kingdom, mainly through shipments of unwrought gold, accounted for 58 percent of the increase in monthly non-American exports between April 2025 and April 2026, and its share of non-American exports rose from about 15 to 31 percent.
Are more Canadian firms exporting outside the United States?
Slightly. The number of firms exporting only to non-American markets increased by 1.8 percent in 2025, the first increase since 2019, which is a more durable sign of change than the surge in gold and energy shipments.
What will the US share of Canadian exports be in 2030?
In the scenarios to 2030, the American share of Canadian merchandise exports could fall to about 63 percent if current trends continue, but could return above 71 percent if the gold boom reversed. Genuine diversification will require manufacturing and services to find new markets.
Methodological note
All calculations were carried out by the author using data from Statistics Canada (principal trading partners, balance of payments basis, April 2025 and April 2026; annual 2025), Global Affairs Canada (monthly trade reports, December 2025 and August 2026; annual report 2024), The Hub (2026) for the number of exporting enterprises, and the Fraser Institute (2026). The Herfindahl index is computed on the ten principal partners, treating the rest of the world as fragmented. Product contributions use August 2026 levels deflated by year-to-date growth as weights. The scenarios start from the twelve months to July 2026. All results depend on nominal values and are therefore affected by prices.
References
Bernard, A. B., Jensen, J. B., Redding, S. J. and Schott, P. K. (2007). Firms in International Trade. Journal of Economic Perspectives, 21(3), 105 to 130.
Besedeš, T. and Prusa, T. J. (2011). The Role of Extensive and Intensive Margins and Export Growth. Journal of Development Economics, 96(2), 371 to 379.
Cadot, O., Carrère, C. and Strauss-Kahn, V. (2011). Export Diversification: What’s behind the Hump? Review of Economics and Statistics, 93(2), 590 to 605.
Fraser Institute (2026). Assessing Canada’s Trade Dependence on the United States, 1999 to 2024. Vancouver.
Global Affairs Canada, Office of the Chief Economist (2025). Highlights of Canada’s Merchandise Trade Performance, 2024 Update. Ottawa.
Global Affairs Canada, Office of the Chief Economist (2026). Monthly Trade Reports, December 2025 and August 2026. Ottawa.
Head, K. and Mayer, T. (2014). Gravity Equations: Workhorse, Toolkit, and Cookbook. In Handbook of International Economics, Vol. 4, 131 to 195. Elsevier.
Hummels, D. and Klenow, P. J. (2005). The Variety and Quality of a Nation’s Exports. American Economic Review, 95(3), 704 to 723.
Imbs, J. and Wacziarg, R. (2003). Stages of Diversification. American Economic Review, 93(1), 63 to 86.
Melitz, M. J. (2003). The Impact of Trade on Intra-Industry Reallocations and Aggregate Industry Productivity. Econometrica, 71(6), 1695 to 1725.
Statistics Canada (2026). Canadian International Merchandise Trade, April 2026 and August 2026. The Daily. Ottawa.
The Hub (2026). Fewer Canadian Companies Exported to the U.S. in 2025 as Trade War Raged On. 29 April 2026.
