
China’s Local Government Debt in 2026: The Collapse of Land Finance and the Limits of Infrastructure-Led Growth

China’s Local Government Debt in 2026: The Collapse of Land Finance and the Limits of Infrastructure-Led Growth
Driss EFFINA, PhD Independent Researcher, Global Strategy Files Reading time: about 27 minutes
Key takeaways
- Land revenue of Chinese local governments fell from 8.70 trillion yuan in 2021 to 4.15 trillion in 2025 and about 3.0 trillion in 2026.
- Official local government debt doubled from 30.5 trillion yuan in 2021 to 60.7 trillion at the end of September 2026, about 42 percent of GDP.
- Land revenue now equals less than 5 percent of local debt, against 35 percent in 2018, and interest absorbs more than half of it.
- More than half of local bonds issued in 2025 refinanced or swapped existing debt, and infrastructure investment has contracted since 2025.
Abstract
This article analyses the financial position of Chinese local governments at the end of the third quarter of 2026, a few days after the Ministry of Finance allowed localities to use 550 billion yuan of unused debt quotas to fill budget gaps and fund infrastructure projects. Using official data from the Ministry of Finance and the National Bureau of Statistics (NBS), together with the general government debt series of the International Monetary Fund, the author builds a set of original indicators: the ratio of land revenue to local debt, the share of local debt interest covered by land revenue, the composition of local bond issuance by use, the relationship between the annual increase in local debt and infrastructure investment, the gap between official and IMF measures of public debt, and projections of the local debt ratio to 2030 under three scenarios. The results show a structural break. Revenue from land use rights fell from 8.70 trillion yuan in 2021 to 4.15 trillion in 2025 and, on current trends, to about 3.0 trillion in 2026, a cumulative fall of about two thirds. Over the same period, official local government debt rose from 30.5 trillion yuan to 60.7 trillion at the end of September 2026, or about 42 percent of GDP. Land revenue, which was equivalent to about 35 percent of the local debt stock in 2018, now represents less than 5 percent of it, and interest on local bonds absorbs more than half of land revenue. More than half of local bonds issued in 2025 went to refinance or swap existing debt rather than to finance new projects, and infrastructure investment has contracted since 2025 despite record borrowing. The article concludes that local government debt is no longer a tool of growth but a constraint to be managed, and that the next stage of adjustment will require a redistribution of fiscal resources from the central government to the localities.
Keywords: China, local government debt, land finance, local government financing vehicles, special bonds, infrastructure investment, fiscal federalism, debt sustainability
JEL codes: H63, H74, H77, E62, O53, R51
1. Introduction
On 9 October 2026, Reuters and the Chinese financial press reported that the Ministry of Finance would allow local governments to use 550 billion yuan of unused debt quotas before the end of the year. Of this amount, 300 billion yuan was to support the general budgets of counties and districts, and 250 billion yuan was to take the form of special bonds for projects in regions with real funding needs. The measure, decided after a State Council executive meeting on 28 September, required no new approval from the National People’s Congress because it used quota space that already existed under the annual debt limits.
At first sight, this was a routine fiscal adjustment, similar to those made in 2022, 2024 and 2025. But it says something important about the state of Chinese local finance in 2026. Four years after the real estate market began to contract, local governments are facing a shortfall in revenue that ordinary budget instruments can no longer cover. A significant share of the new money is not going to new roads, bridges or industrial parks, but to the day-to-day functioning of counties and to the repayment of arrears. The model that financed China’s infrastructure boom for two decades, in which local governments sold land to developers and borrowed against future land revenue, has stopped working.
This article sets out to measure the extent of this change with official data and the author’s own calculations. It addresses five questions. How much land revenue have local governments lost? How has their debt evolved, and how heavy is it relative to the economy and to their revenue? What is new borrowing being used for? Is borrowing still translating into infrastructure investment? And what are the likely trajectories of local debt to 2030?
The article is the last of four on China in this series of 2026 analyses. The previous article measured the contraction of the real estate sector, showing that new construction starts have fallen to about 22 percent of their 2021 level. The present article follows the consequences of that contraction into public finance.
Section 2 sets out the institutional context. Section 3 reviews the literature. Section 4 describes the data and methodology. Section 5 presents the results. Section 6 discusses them. Section 7 presents scenarios to 2030. Section 8 concludes.
2. Context
2.1 The fiscal architecture
China is a unitary state, but its public spending is among the most decentralised in the world. Local governments, from provinces down to counties and townships, carry out the large majority of public expenditure, including most spending on education, health, social protection and infrastructure. However, since the tax sharing reform of 1994, the central government has collected a much larger share of tax revenue than it spends directly. The gap is covered by transfers from the centre and by local revenue sources outside the general budget.
The most important of these sources has been land. Under Chinese law, urban land is owned by the state, and local governments have the power to convert rural land to urban use and to sell long-term use rights to developers. The proceeds are recorded in the government fund budget, separately from the general public budget, and they have been used to finance infrastructure, to compensate farmers whose land was requisitioned and to support local development.
2.2 The rise of financing vehicles
Until 2015, the Budget Law did not allow local governments to borrow directly. To get around this restriction, local governments created local government financing vehicles (LGFVs), state-owned companies that borrowed from banks and later issued bonds and used trust and other shadow banking channels to finance infrastructure. These companies were typically backed by land assets and implicit guarantees from the local government.
The 2008 stimulus programme marked the start of a rapid expansion of LGFV borrowing. Local governments were encouraged to support growth through infrastructure, and banks were instructed to lend. By the early 2010s, LGFV debt had become a major concern for the central authorities and for international institutions.
2.3 Successive attempts to contain the debt
The revised Budget Law of 2014, which came into force in 2015, allowed provincial governments to issue bonds directly, subject to an annual limit set by the National People’s Congress. At the same time, the State Council’s Document 43 of 2014 required local governments to separate themselves from LGFVs, and a first debt swap programme converted about 12 trillion yuan of existing LGFV debt into official local government bonds over 2015 to 2018.
The separation was never complete. LGFVs continued to borrow, and the distinction between official local debt, which is recorded in the budget, and “hidden debt”, which consists of LGFV and other liabilities for which the local government bears responsibility in practice, became a central feature of Chinese public finance.
From 2019, special purpose bonds became the main instrument for local infrastructure financing. These bonds are supposed to finance projects that generate their own revenue, such as toll roads, industrial parks or land reserves, and they are repaid from the government fund budget, in practice largely from land revenue.
2.4 The 2024 debt package
In November 2024, the Standing Committee of the National People’s Congress approved a package of 10 trillion yuan to address hidden local debt. According to the Ministry of Finance, hidden debt amounted to 14.3 trillion yuan at the end of 2023. The package had three components: an increase of 6 trillion yuan in the local debt limit, to be used over 2024 to 2026 at a rate of 2 trillion per year to issue refinancing bonds that replace hidden debt; the allocation of 800 billion yuan per year of new special bonds over five years, a total of 4 trillion, to the same purpose; and 2 trillion yuan of hidden debt linked to shantytown renovation, due after 2029, to be repaid according to the original contracts. The stated objective was to reduce hidden debt to 2.3 trillion yuan by 2028.
2.5 The 2026 budget
The 2026 budget, presented to the National People’s Congress in March 2026, set the general budget deficit at about 4 percent of GDP, or 5.89 trillion yuan, 230 billion yuan more than in 2025. The quota for local special bonds was kept at 4.4 trillion yuan, the same as in 2025, and the quota for ultra-long special treasury bonds at 1.3 trillion yuan. The ceiling for local government debt was set at about 63.2 trillion yuan.
Analysts noted that the fiscal stance was similar to 2025, at a time when revenue was weakening. The decision of October 2026 to release unused quotas indicates that the budget set in March was insufficient to meet local needs.
3. Literature review
The literature on Chinese local government debt can be grouped into four strands.
The first strand documents the origins and scale of the debt. Lu and Sun (2013), in an IMF working paper, provided one of the first systematic analyses of LGFVs and estimated their debt at the time. Zhang and Barnett (2014) analysed the fiscal vulnerabilities arising from local government finance and proposed an “augmented” measure of public debt that includes off-budget borrowing. This concept has since been used in all IMF Article IV reports on China.
The second strand links local debt to the 2008 stimulus and to the land market. Bai, Hsieh and Song (2016), in a widely cited Brookings paper, argue that the 2008 stimulus, by encouraging local governments to borrow through LGFVs, had a “long shadow”: it gave local governments access to financial resources that they used to favour specific firms and projects, worsening the allocation of capital. Chen, He and Liu (2020) show that when the stimulus bank loans that LGFVs had taken in 2009 began to mature, LGFVs turned to shadow banking and bond markets to refinance them, which explains the rapid growth of non-bank credit in the early 2010s.
The third strand deals with the macroeconomic effects of local debt. Huang, Pagano and Panizza (2020) show that the rise of local public debt in China crowded out private investment by firms dependent on local bank credit. Liu and Xiong (2020) describe the loop between land prices, local government revenue, infrastructure spending and LGFV debt, and warn that a fall in land prices could break this loop. Rogoff and Yang (2021) estimate the weight of real estate and related activities in the Chinese economy and highlight the dependence of local finances on land.
The fourth strand is institutional. Successive IMF Article IV reports have recommended a comprehensive restructuring of LGFV debt, a reform of intergovernmental fiscal relations to give local governments revenue commensurate with their responsibilities, and a greater role for the central government balance sheet. The IMF’s World Economic Outlook database now includes an estimate of general government debt for China that is much broader than the official figures.
This article contributes to this literature by measuring the consequences of the land revenue collapse with data up to September 2026, by quantifying how much of current borrowing goes to debt resolution rather than investment, and by documenting the decoupling of local borrowing from infrastructure investment since 2025, which earlier studies, written in a period of rising land revenue, could not observe.
4. Data and methodology
4.1 Sources
The data come from:
- the Ministry of Finance of China: annual fiscal accounts (general public budget and government fund budget), revenue from land use rights transfers, outstanding local government debt at the end of each year, local bond issuance by type, debt limits approved by the National People’s Congress, and monthly fiscal releases for 2026;
- the National Bureau of Statistics: nominal GDP and fixed asset investment, including the infrastructure aggregate (excluding power);
- the International Monetary Fund: World Economic Outlook series for general government gross debt as a percentage of GDP;
- press reports by Reuters, Caixin and Yicai on the October 2026 quota release and on end-2025 debt statistics, which relay official figures.
4.2 Estimates for 2026
For land revenue, the year-on-year decline for January to August 2026 (-28.6 percent) is applied to the 2025 annual figure, giving an estimate of about 2.96 trillion yuan for 2026. This assumption is uncertain because land sales are seasonal and tend to be concentrated at the end of the year, but it is consistent with the trend of the first eight months.
For local government debt, the stock at the end of September 2026 (60.7 trillion yuan) is used. For GDP, nominal growth of 3.5 percent in 2026 is assumed, giving about 145 trillion yuan.
4.3 Derived indicators
The author computes:
1. Land revenue in percent of GDP, as a measure of the macroeconomic weight of land finance. 2. Local debt in percent of GDP, using official end-of-period debt. 3. Land revenue in percent of the local debt stock, an indicator of the capacity of the main dedicated revenue source to service the debt. It can be read as the number of percentage points of the debt stock that could theoretically be repaid each year if all land revenue were used for this purpose. 4. Interest on local bonds in percent of land revenue. Interest for 2025 (1.48 trillion yuan) is official. For 2021 to 2024, interest is estimated by applying an average cost of debt of about 3.3 to 3.5 percent to the average stock, calibrated on the official 2024 figure implied by the reported 9.6 percent increase in 2025. For 2026, the average stock is multiplied by an average cost of 2.75 percent, reflecting the lower rates on recent issuance. 5. Composition of bond issuance by use. The 4.93 trillion yuan of refinancing bonds issued in 2025 are split between the swap of hidden debt (2 trillion yuan, according to the annual quota of the swap programme) and the rollover of maturing bonds (the remainder). Of the 5.38 trillion yuan of new bonds, 0.8 trillion are attributed to the swap programme according to its annual quota. 6. Annual increase in local debt compared with infrastructure investment growth. 7. Gap between the IMF and official debt measures. The official measure is the sum of central and local government debt reported by the Ministry of Finance. The IMF measure is the WEO general government gross debt. 8. Debt dynamics to 2030. The local debt ratio is projected using the identity: debt at the end of year t equals debt at the end of year t-1 plus net new borrowing, and GDP grows at an assumed nominal rate.
4.4 Limitations
Official local debt excludes most LGFV debt, which makes it an incomplete measure of local liabilities. The swap programme transfers hidden debt into official debt, which raises official debt without increasing total liabilities. This must be kept in mind when interpreting the increase in official debt since 2024. The estimates of interest for years other than 2025 are approximations. Finally, land revenue figures are gross: a large part is spent on land acquisition and compensation, so net land revenue available for other uses is much lower.
5. Results
5.1 The collapse of land revenue
Figure 1 shows revenue from land use rights transfers from 2015 to 2026.
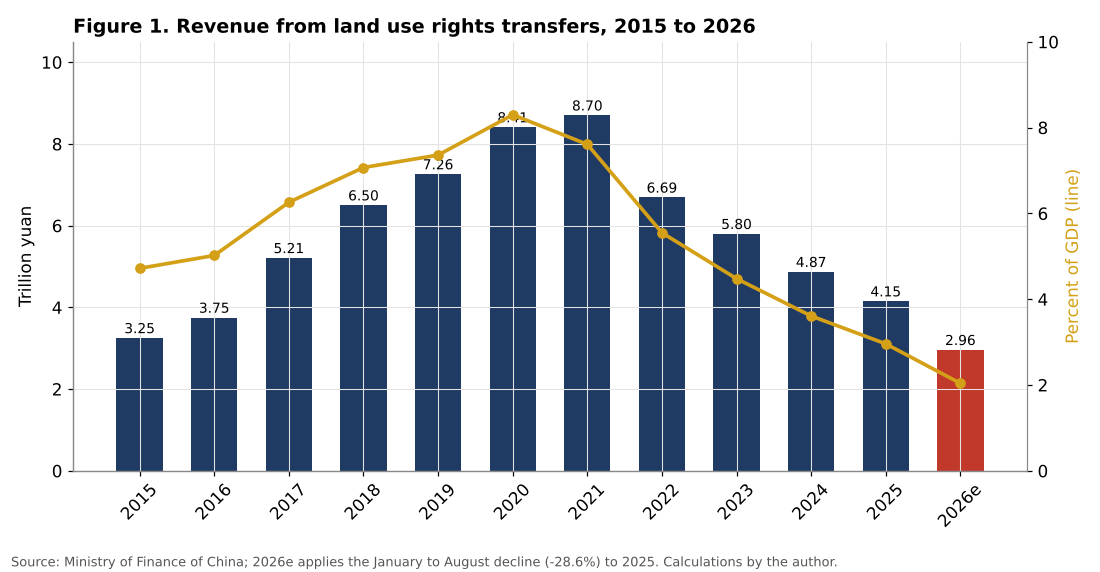
Land revenue rose from 3.25 trillion yuan in 2015 to a peak of 8.70 trillion in 2021, an increase of 168 percent in six years, much faster than GDP. In 2020, the peak year in relation to the economy, it was equivalent to 8.3 percent of GDP.
The reversal was abrupt. Land revenue fell by 23.3 percent in 2022, 13.2 percent in 2023, 16 percent in 2024 and 14.7 percent in 2025, to 4.15 trillion yuan. In the first eight months of 2026, it fell by a further 28.6 percent year on year, to 1.38 trillion yuan. If this trend continues for the rest of the year, land revenue in 2026 would be about 2.96 trillion yuan, 66 percent below the 2021 peak and lower than in 2015.
In relation to the economy, land revenue fell from 8.3 percent of GDP in 2020 to 3.0 percent in 2025 and an estimated 2.0 percent in 2026. Compared with the 2021 level, local governments lost a cumulative total of about 19 trillion yuan of land revenue between 2022 and 2026, equivalent to more than 13 percent of 2025 GDP.
| Year | Land revenue (trn yuan) | Change | % of GDP |
|---|---|---|---|
| 2019 | 7.26 | +11.4% | 7.4 |
| 2020 | 8.41 | +15.9% | 8.3 |
| 2021 | 8.70 | +3.5% | 7.6 |
| 2022 | 6.69 | -23.3% | 5.6 |
| 2023 | 5.80 | -13.2% | 4.5 |
| 2024 | 4.87 | -16.0% | 3.6 |
| 2025 | 4.15 | -14.7% | 3.0 |
| 2026e | 2.96 | -28.6% | 2.0 |
Table 1. Revenue from land use rights transfers. Source: Ministry of Finance; 2026 estimate and GDP ratios calculated by the author.
The acceleration of the decline in 2026 is notable. It suggests that the fall in land revenue is not slowing as the base gets lower, but intensifying. This is consistent with the results of the previous article in this series, which showed that new construction starts fell by 24.8 percent in the first eight months of 2026 and that developers’ bank loans fell by a third. Developers who do not start new projects do not buy land.
The collapse of land revenue is the central fact of Chinese local public finance in the 2020s. It explains the weakness of the government fund budget, whose revenue fell by 7 percent in 2025 to 5.77 trillion yuan, and it largely explains the record comprehensive deficit of 12.65 trillion yuan in 2025, combining the general and government fund budgets.
5.2 The rise of official local debt
Figure 2 shows the evolution of official local government debt.
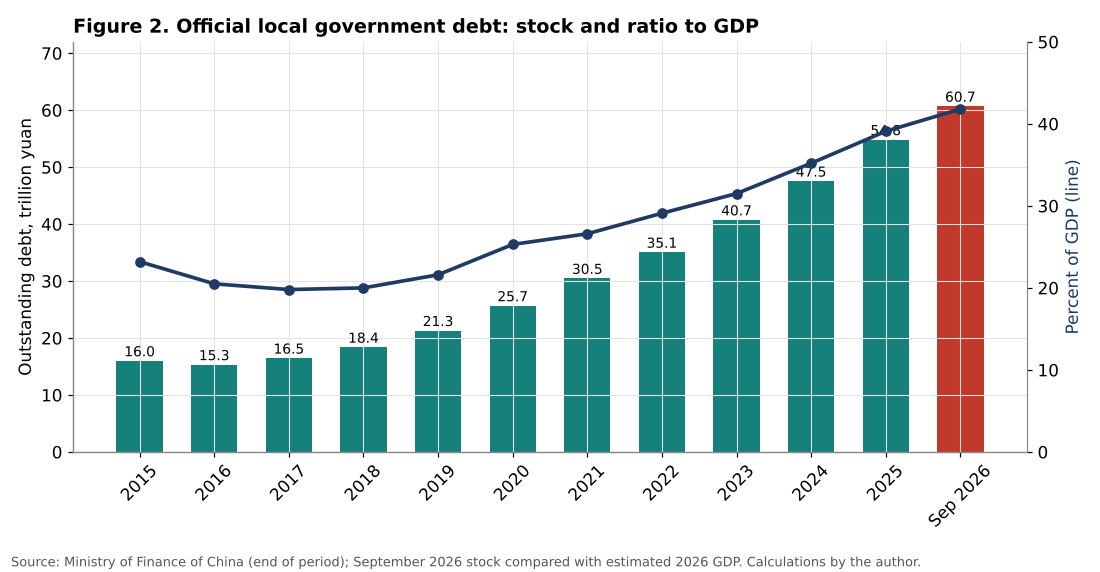
Official local government debt was about 16 trillion yuan in 2015, after the first swap of LGFV debt. It remained stable relative to GDP until 2019, at about 20 percent. It then increased rapidly: 25.7 trillion yuan at the end of 2020, 35.1 trillion at the end of 2022, 47.5 trillion at the end of 2024 and 54.8 trillion at the end of 2025. At the end of September 2026, it reached 60.7 trillion yuan.
As a share of GDP, local debt rose from 21.6 percent in 2019 to 39.1 percent in 2025 and to about 42 percent of estimated 2026 GDP. In other words, the local debt ratio almost doubled in six years.
The annual increase in local debt has also accelerated: 2.9 trillion yuan in 2019, 4.4 trillion in 2020, 5.7 trillion in 2023, 6.8 trillion in 2024 and 7.3 trillion in 2025, an increase of 15 percent. In the first nine months of 2026 alone, it was 5.9 trillion yuan.
This acceleration must be interpreted carefully. Since 2024, a significant part of the increase in official debt reflects the swap of hidden debt: 2.8 trillion yuan per year (2 trillion of refinancing bonds and 800 billion of new special bonds) replaces LGFV debt that was already owed but not recorded in official statistics. This part of the increase does not represent new liabilities but a transfer of liabilities from the hidden to the official balance sheet. Even taking this into account, however, the increase in official debt excluding the swap was about 4.5 trillion yuan in 2025, which is comparable to the annual increases of 2021 and 2022, years in which local governments were explicitly asked to support growth.
The debt is also within the limits approved by the National People’s Congress: 57.99 trillion yuan in 2025 and 63.2 trillion yuan in 2026. The October 2026 release of 550 billion yuan of unused quotas uses part of the gap between the limit and actual debt. According to estimates relayed by Caixin, about 1.4 trillion yuan of unused quota remained available after planned issuance for the year.
5.3 The fiscal scissors
Figure 3 brings together the two trends.
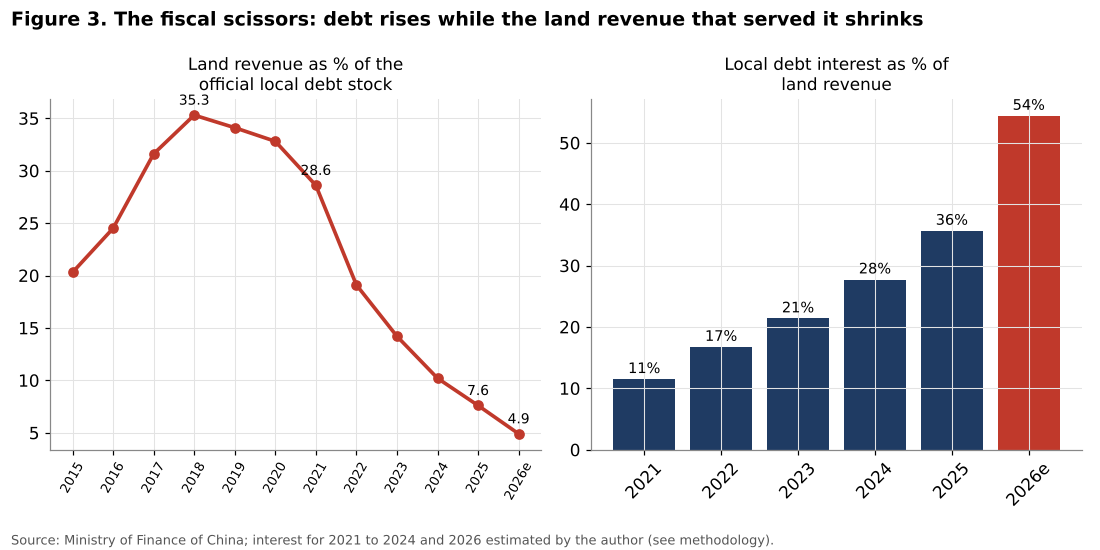
The left panel shows land revenue as a share of the official local debt stock. In 2018, land revenue was equivalent to 35 percent of local debt: in theory, local governments could have repaid more than a third of their debt each year with land revenue alone. This ratio fell to 28.6 percent in 2021, 14.2 percent in 2023, 7.6 percent in 2025, and an estimated 4.9 percent in 2026. In seven years, the capacity of land revenue to support local debt has been divided by seven.
This indicator is crucial because special bonds, which make up the majority of local debt, are by design repaid from the government fund budget, which is dominated by land revenue. When land revenue falls, the projects financed by special bonds lose their main source of repayment, and local governments have to refinance them or pay them out of the general budget.
The right panel shows interest on local bonds as a share of land revenue. In 2021, interest was equivalent to about 11 percent of land revenue. In 2025, with interest of 1.48 trillion yuan and land revenue of 4.15 trillion, the ratio was 36 percent. In 2026, the author estimates that it will exceed 50 percent. In other words, more than half of what local governments receive from land sales will be absorbed by the interest on their official debt alone, before any repayment of principal, any compensation of farmers, and any new investment. And since a large part of gross land revenue is in fact spent on land acquisition and compensation, the share of net land revenue absorbed by interest is even higher.
This is the fiscal scissors: debt rising on one side, the revenue that was supposed to service it falling on the other. Its consequence is that local debt can only be serviced by new borrowing, by transfers from the central government or by cuts in other expenditure.
5.4 What local bonds are used for
Figure 4 breaks down local bond issuance in 2025 by use.
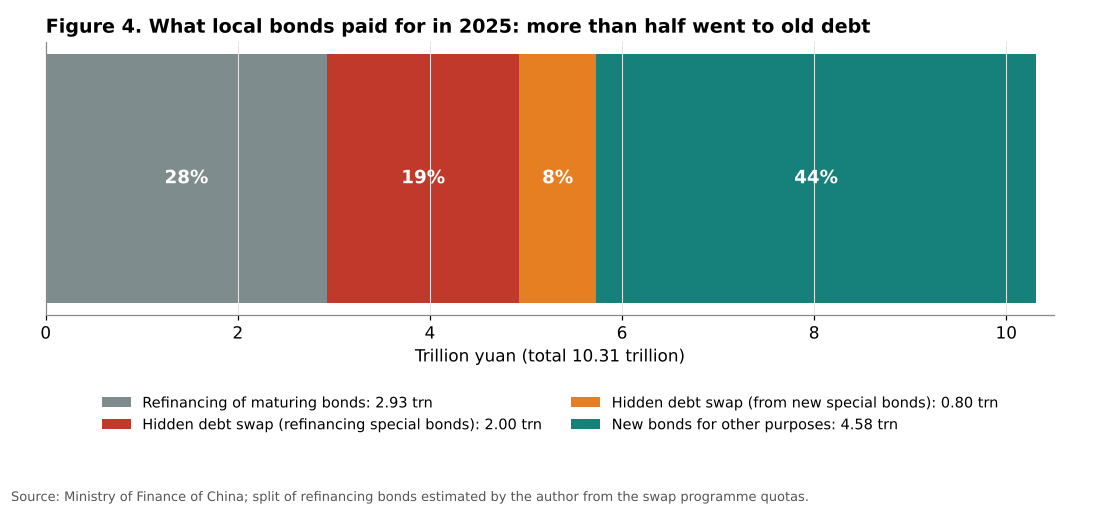
Local governments issued a record 10.31 trillion yuan of bonds in 2025, the first time annual issuance exceeded 10 trillion. The author estimates the breakdown as follows:
- about 2.93 trillion yuan (28 percent) to roll over maturing local bonds;
- 2.0 trillion yuan (19 percent) of refinancing bonds to swap hidden debt;
- 0.8 trillion yuan (8 percent) of new special bonds allocated to the swap of hidden debt;
- about 4.58 trillion yuan (44 percent) of new bonds for other purposes.
In total, about 56 percent of local bonds issued in 2025 were used to deal with existing debt, and only about 44 percent were available for new spending. Moreover, the new bonds “for other purposes” include special bonds used to buy back idle land, to purchase unsold housing for conversion into affordable housing, and to pay arrears owed by local governments to companies, uses that are linked to the real estate crisis and do not create new infrastructure. The share of local borrowing actually going to new infrastructure is therefore well below half.
The Ministry of Finance reported that about 87 percent of maturing principal in 2025 was rolled over with refinancing bonds, and only about 410 billion yuan was repaid from fiscal resources. Local debt is therefore being rolled over almost entirely.
The terms of the debt have improved. The average maturity of local bonds issued in 2025 lengthened to 15.4 years from 14.4 years, and the average issuance rate fell to 1.97 percent from 2.29 percent. The swap of hidden debt, which typically carried rates of 4 to 7 percent, for official bonds at about 2 percent reduces the interest burden: the Ministry of Finance had estimated that the swap programme would save about 600 billion yuan of interest over five years. However, because the stock of official debt is growing faster than the average rate is falling, total interest on local bonds still increased by 9.6 percent in 2025.
5.5 More borrowing, less building
Figure 5 compares the annual increase in official local debt with the growth rate of infrastructure investment.
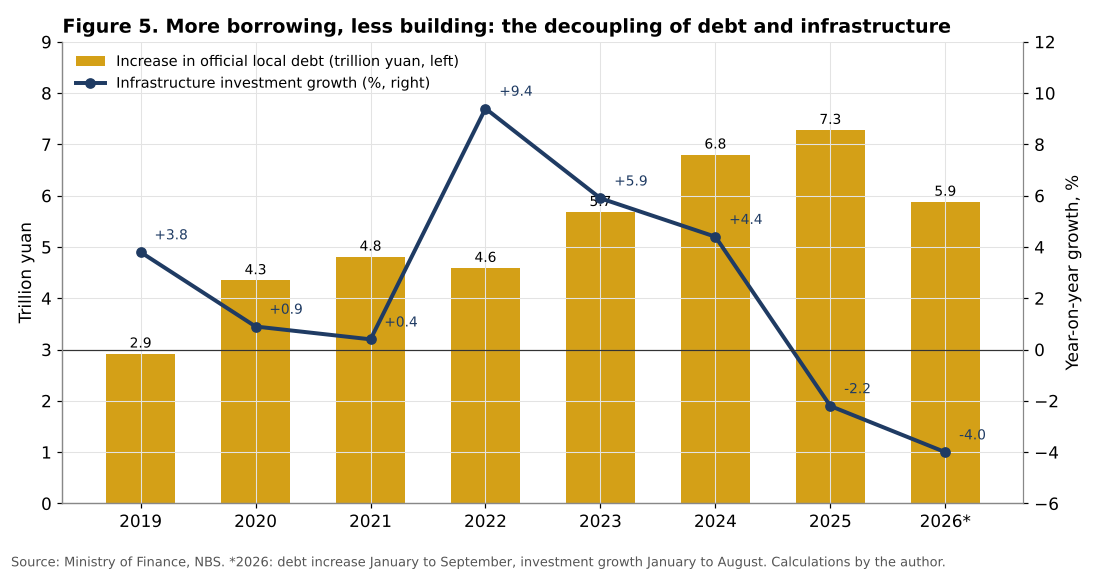
Until 2024, the relationship between local borrowing and infrastructure investment was broadly positive, though not tight: in 2022, when local governments were asked to support growth, infrastructure investment grew by 9.4 percent and local debt increased by 4.6 trillion yuan. In 2023 and 2024, infrastructure investment slowed to 5.9 and 4.4 percent, while the increase in debt accelerated.
In 2025, the relationship broke. Local debt increased by a record 7.3 trillion yuan, yet infrastructure investment fell by 2.2 percent, a rare decline in the published series. In the first eight months of 2026, infrastructure investment fell by 4.0 percent, while local debt increased by 5.9 trillion yuan in the first nine months. The sub-components are even weaker: investment in water conservancy, environment and public facilities management, a sector dominated by local governments, fell by 11.0 percent, and investment in road transport by 8.0 percent. By region, investment fell by 25.5 percent in the northeast, the region with the weakest local finances.
The author calls this phenomenon decoupling: borrowing continues to rise, but it no longer translates into physical investment. Three factors explain it.
First, as shown above, more than half of new borrowing goes to existing debt. Replacing an LGFV loan with a local bond does not create a single kilometre of road.
Second, the loss of land revenue has to be compensated. Local governments use part of their borrowing capacity to cover operating expenses that land revenue used to finance, as the allocation of 300 billion yuan of the October 2026 quotas to county and district general budgets illustrates.
Third, the authorities have tightened controls on new LGFV borrowing as part of the debt resolution effort, which has reduced the off-budget financing of infrastructure. LGFVs, which were historically the main executors of local infrastructure projects, have been asked to stop borrowing for new projects and in many cases to transform into ordinary commercial companies.
The result is that the infrastructure lever, which China used to counter every slowdown since 2008, has lost much of its power. The fiscal multiplier of local borrowing, in terms of physical investment, has fallen sharply.
5.6 How large is public debt really?
Figure 6, left panel, compares two measures of Chinese public debt.
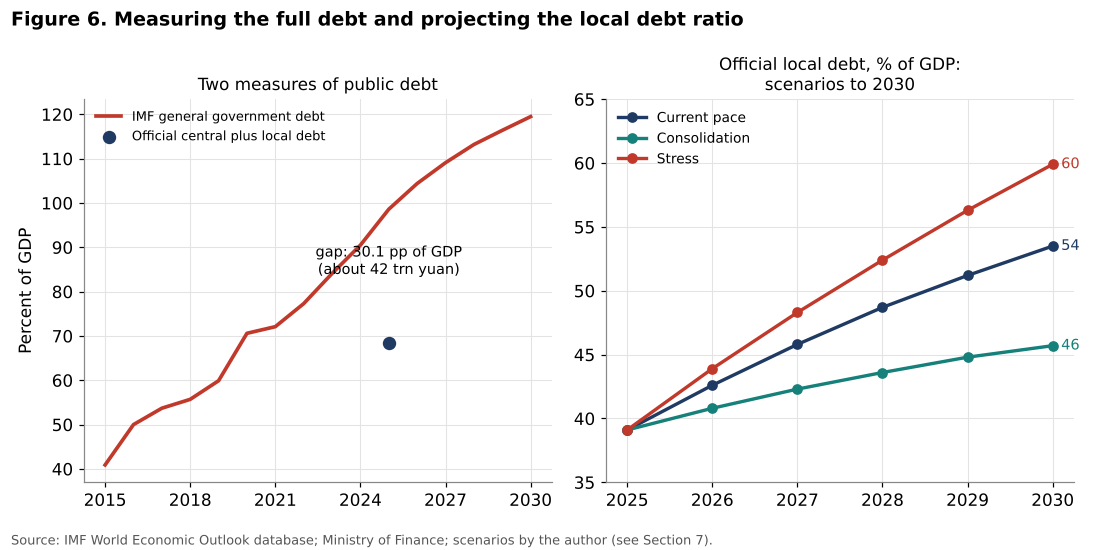
According to the Ministry of Finance, total government debt at the end of 2025 was about 96 trillion yuan: 41.23 trillion yuan of central government debt and 54.82 trillion of local government debt, or 68.5 percent of GDP. This is well below the averages for the G20 and G7.
The IMF estimate of general government gross debt for China is much higher: 98.6 percent of GDP in 2025, rising to 104.4 percent in 2026 and to about 120 percent in 2030 in the IMF projections. The difference between the two measures is about 30 percentage points of GDP in 2025, or about 42 trillion yuan. This gap corresponds mainly to the part of LGFV debt and other off-budget liabilities that the IMF considers to be government debt.
The IMF measure has risen without interruption since 2015, from 41 percent of GDP to 99 percent in ten years. It also shows that the general government deficit, measured more broadly, has been 6 to 10 percent of GDP every year since 2019, far more than the official deficit of 3 to 4 percent.
The comparison between the two measures has two implications. First, the official debt figures significantly understate the liabilities for which the state is ultimately responsible. Second, the swap of hidden debt into official debt, which is increasing official debt by 2.8 trillion yuan a year, does not change the total, but brings official statistics closer to the IMF measure. The real question is not the level of official debt but the evolution of total public liabilities, which, on the IMF measure, continue to increase by about 6 to 8 percentage points of GDP a year.
5.7 Interest burden and maturity
The total interest burden of local governments is still moderate in relation to GDP: about 1.06 percent of GDP for official local bonds in 2025. However, it should be compared with the resources actually available to local governments rather than with GDP. As shown above, interest absorbs 36 percent of land revenue in 2025 and probably more than half in 2026. In terms of the general public budget, interest payments of all governments rose by 4.8 percent in 2025 to 1.35 trillion yuan, while general budget revenue fell by 1.7 percent to 21.6 trillion yuan, the first annual decline since 2020.
The low interest rate environment is currently a factor of stability. Chinese government bond yields have been at historically low levels since 2024, which allows local governments to refinance at about 2 percent. This advantage would disappear if yields were to rise, but with inflation close to zero and monetary policy accommodative, this risk seems limited in the short term.
6. Discussion
6.1 The end of land finance
The results confirm that the land finance model, which underpinned local public finance and infrastructure investment for two decades, has come to an end. This is not a temporary cyclical weakness: land revenue has fallen for five consecutive years, the decline accelerated in 2026, and the structural drivers of land demand, notably urbanisation and household formation, are weakening.
Even if the real estate market stabilises at a new lower level, as the previous article in this series suggests is likely before 2030, land revenue will not return to the levels of 2020 and 2021. The author estimates that, in a stabilised market with starts of 450 to 600 million square metres per year, against almost 2 billion at the peak, land revenue could stabilise at between 2 and 3 trillion yuan per year, or about 1.5 to 2 percent of GDP, compared with more than 8 percent at the peak. Local governments will therefore permanently lose resources equivalent to about 5 to 6 percent of GDP.
6.2 A problem of distribution rather than of total debt
The comparison between official and IMF debt measures shows that China’s total public debt is high and rising. However, the Chinese state as a whole has substantial assets, including state-owned enterprises, financial institutions and land, and the vast majority of its debt is held domestically and denominated in local currency. The risk of a sovereign debt crisis in the classical sense is therefore low.
The real problem is the distribution of debt and revenue between levels of government. The central government has relatively low debt (about 29 percent of GDP) and broad borrowing capacity at very low rates, while local governments carry the bulk of debt and have lost their main independent revenue source. This mismatch is the root of the difficulties: localities that cannot pay their suppliers, delay wages or cut public services, while the central government has room to borrow.
The policy response so far has partly recognised this. The 2024 package mobilised central approval for additional local borrowing, and the central government has issued ultra-long special treasury bonds to finance projects that local governments previously financed. But the bulk of the adjustment still takes place on local balance sheets. A more fundamental reform, involving an increase in central government transfers, a reassignment of expenditure responsibilities to the centre, or new local tax sources such as a property tax, has been discussed for years but not implemented.
6.3 The risk of debt dependence
The data show that local governments are now in a situation where almost all maturing debt is refinanced, interest absorbs a growing share of dedicated revenue, and a growing share of new borrowing is needed to cover past obligations. This is a classic situation of debt dependence, in which the debt grows by itself, independently of new investment.
In the short term, this is manageable as long as interest rates remain low and bond markets remain open to local governments, which is guaranteed in practice by the central authorities and by state-owned banks, which hold most local bonds. In the long term, it means that local borrowing capacity is increasingly absorbed by the past, leaving less room for future spending.
6.4 Consequences for growth
The decoupling of debt and infrastructure has important consequences for growth. For two decades, infrastructure investment was the main countercyclical tool of Chinese economic policy. When exports or real estate weakened, local governments were asked to accelerate infrastructure spending, financed by LGFVs and later by special bonds. This tool is now much less effective.
The decline of infrastructure investment in 2025 and 2026, combined with the contraction of real estate investment, explains why total fixed asset investment fell by 3.8 percent in 2025 and by 7.2 percent in the first eight months of 2026. It also explains why the government has shifted its emphasis to consumption support, as discussed in an earlier article in this series, and to investment in strategic industries and technology, which are financed more by the central government and by policy banks.
There is a positive side to this development. Many economists, starting with Bai, Hsieh and Song (2016), have argued that local infrastructure investment had become increasingly inefficient, with low returns, excess capacity in transport and industrial parks, and a misallocation of capital. A reduction of this type of investment could, in the long term, improve the efficiency of capital use. But in the short term, it reduces demand and growth, at a time when the economy faces other headwinds.
6.5 Regional disparities
The national aggregates hide large disparities. Wealthy coastal provinces, such as Guangdong, Zhejiang and Jiangsu, have diversified tax bases and still attract land buyers in their main cities. Provinces in the northeast and parts of the west, such as Guizhou, Yunnan, Tianjin and parts of Inner Mongolia, have much weaker revenue, high LGFV debt and declining populations. The 25.5 percent decline in investment in the northeast in the first eight months of 2026 is an indication of the severity of the situation in these regions.
The October 2026 decision to allocate the 250 billion yuan of special bond quotas to “regions with real funding needs” and to support county budgets reflects this concern. It is likely that the central government will have to provide increasing support to the most fragile regions in the coming years.
6.6 Implications for policy
The analysis leads to four policy observations.
First, the swap of hidden debt is useful because it lowers interest costs and brings liabilities into the open, but it does not reduce total debt. It must be accompanied by measures that reduce the flow of new off-budget borrowing and that restructure non-viable LGFVs.
Second, the fiscal gap created by the loss of land revenue requires a permanent solution. Releasing unused quotas at the end of each year, as in 2022, 2024, 2025 and 2026, is a temporary remedy that adds to debt.
Third, the central government has the capacity to take on a larger share of the adjustment, through higher transfers or the direct financing of expenditure currently carried out by localities. The IMF has made this recommendation repeatedly.
Fourth, the fall in infrastructure investment should not necessarily be reversed. It would be better to redirect public spending toward social protection, health and education, which would support household consumption, rather than to revive the type of local investment that generated the debt in the first place.
7. Scenarios to 2030
7.1 Method
The right panel of Figure 6 presents three scenarios for the ratio of official local debt to GDP between 2025 and 2030. The projections use a simple accumulation rule: each year, the debt stock increases by a fixed amount of net new borrowing, and nominal GDP grows at a fixed rate.
Current pace. Net new borrowing remains at 7.3 trillion yuan per year, the 2025 level, which includes the hidden debt swap. Nominal GDP grows by 4 percent per year. The local debt ratio rises from 39.1 percent in 2025 to about 54 percent in 2030.
Consolidation. Net new borrowing falls to 5.0 trillion yuan per year, as the swap programme ends and local governments reduce new borrowing. Nominal GDP grows by 4.5 percent per year, helped by a recovery of prices. The ratio rises more slowly, to about 46 percent in 2030.
Stress. Net new borrowing rises to 8.5 trillion yuan per year, as local governments borrow more to compensate for the continuing decline of land revenue and as more hidden debt is recognised. Nominal GDP grows by only 3 percent, reflecting persistent deflationary pressure. The ratio reaches about 60 percent in 2030.
7.2 Interpretation
In all three scenarios, the official local debt ratio continues to rise until 2030. Even in the consolidation scenario, it increases by about 7 percentage points. This reflects a simple arithmetic: with nominal GDP of about 145 trillion yuan, a local debt ratio of 40 percent is stabilised only if net new borrowing does not exceed about 2.3 to 2.6 trillion yuan per year at nominal growth of 4 to 4.5 percent. Current borrowing is about three times this level.
The scenarios concern only official local debt. Since part of the increase comes from the swap of hidden debt, the increase in total public liabilities is lower than these figures suggest. On the other hand, the IMF projections, which include a broader perimeter, show general government debt rising from 99 percent of GDP in 2025 to about 120 percent in 2030, which is consistent with the current pace scenario.
The key variable is nominal GDP growth. Since 2023, China has experienced low inflation and at times deflation of the GDP deflator, which means that nominal growth has been lower than real growth. Each percentage point less of nominal growth raises the local debt ratio by about 0.4 percentage points a year at current levels. A return to moderate inflation would therefore significantly ease the debt dynamics.
7.3 Indicators to monitor
The author suggests monitoring five indicators:
1. Monthly land revenue published by the Ministry of Finance: a stabilisation of the year-on-year decline would be the first sign that the land finance shock is ending. 2. The share of refinancing and swap bonds in total local bond issuance. 3. Infrastructure investment growth, and especially the categories dominated by local governments (water conservancy and public facilities). 4. The gap between the debt limit and the actual stock, which indicates the room for manoeuvre without new legislative approval. 5. The GDP deflator, which determines nominal growth and therefore the debt ratio.
8. Conclusion
This article has documented the transformation of Chinese local public finance between 2021 and 2026. The main findings are:
1. Land revenue fell from 8.70 trillion yuan in 2021 to 4.15 trillion in 2025 and an estimated 2.96 trillion in 2026, a fall of about two thirds. As a share of GDP, it has fallen from more than 8 percent to about 2 percent. 2. Official local government debt doubled from 30.5 trillion yuan in 2021 to 60.7 trillion at the end of September 2026, or from about 27 percent of GDP to about 42 percent. 3. Land revenue now represents less than 5 percent of the official local debt stock, against 35 percent in 2018, and interest on local bonds absorbs more than half of land revenue. 4. More than half of local bonds issued in 2025 went to existing debt rather than new spending, and almost all maturing debt is rolled over. 5. Infrastructure investment has been falling since 2025, despite record local borrowing: local debt and infrastructure investment have decoupled. 6. The IMF’s measure of general government debt, at about 99 percent of GDP in 2025, is about 30 percentage points higher than the official measure.
These results lead to a clear conclusion. Local government debt in China is no longer a lever of growth but a constraint to be managed. The model in which local governments financed infrastructure with land revenue and debt has reached its limits. The release of unused quotas in October 2026, like the similar decisions in previous years, gives local governments breathing space but does not solve the underlying problem, which is a lasting mismatch between local spending responsibilities and local resources.
The solution requires a rebalancing of fiscal relations between the centre and the localities, the restructuring of non-viable financing vehicles, and a redirection of public spending from physical investment toward households. Until such a reform takes place, local government debt will continue to rise faster than GDP, and its contribution to growth will continue to decline.
Need this analysis for your organisation?
We prepare confidential briefings, executive talks and studies on countries, markets and policies, built on the same method as this article.
Request a briefingSupport independent analysis
Our studies are free to read and carry no advertising. If this one was useful, a small contribution helps us publish the next.
Support our workGo further: books by Global Strategy Files


Frequently asked questions
How large is Chinese local government debt in 2026?
Official Chinese local government debt reached 60.7 trillion yuan at the end of September 2026, about 42 percent of GDP, double the 30.5 trillion yuan of 2021. The IMF’s broader measure of general government debt was about 99 percent of GDP in 2025.
Why are Chinese local governments in financial difficulty?
They lost their main revenue source. Revenue from land use rights fell from 8.70 trillion yuan in 2021 to an estimated 2.96 trillion in 2026, about two thirds less, while debt kept rising. Interest on local bonds now absorbs more than half of land revenue.
What are Chinese local government bonds used for?
More than half of local bonds issued in 2025 went to refinance or swap existing debt rather than finance new projects. Of the record 10.31 trillion yuan issued, only about 44 percent was available for new spending, including projects linked to the property crisis.
Is infrastructure still driving growth in China?
Much less than before. Despite record local borrowing of 7.3 trillion yuan in 2025, infrastructure investment fell 2.2 percent that year and 4.0 percent in January to August 2026, so local debt is now a constraint to manage rather than a growth tool.
Methodological note
All indicators, estimates and charts in this article were produced by the author from official data. Land revenue and local debt figures are from the Ministry of Finance of China, as published in its annual and monthly releases and relayed by Reuters, Caixin and Yicai. Infrastructure investment growth rates are from NBS releases. The IMF debt series is from the World Economic Outlook database (accessed in October 2026). GDP figures are the latest NBS nominal values. The 2026 land revenue estimate applies the January to August growth rate to the 2025 total. The breakdown of 2025 bond issuance by use is an estimate based on the quotas of the hidden debt swap programme. Interest for years other than 2025 is estimated. The debt projections are illustrative and depend on the stated assumptions.
References
Bai, C.-E., Hsieh, C.-T. and Song, Z. (2016). The Long Shadow of China’s Fiscal Expansion. Brookings Papers on Economic Activity, Fall 2016, 129 to 181.
Caixin Global (2026). Beijing Lets Local Governments Tap 550 Billion Yuan in Unused Debt Quotas. 9 October 2026.
Chen, Z., He, Z. and Liu, C. (2020). The Financing of Local Government in China: Stimulus Loan Wanes and Shadow Banking Waxes. Journal of Financial Economics, 137(1), 42 to 71.
Huang, Y., Pagano, M. and Panizza, U. (2020). Local Crowding-Out in China. Journal of Finance, 75(6), 2855 to 2898.
International Monetary Fund (2025). People’s Republic of China: 2025 Article IV Consultation. IMF Country Report. Washington, DC.
International Monetary Fund (2026). World Economic Outlook Database. General government gross debt and net lending, China. Washington, DC.
Liu, C. and Xiong, W. (2020). China’s Real Estate Market. In M. Amstad, G. Sun and W. Xiong (eds.), The Handbook of China’s Financial System. Princeton University Press.
Lu, Y. and Sun, T. (2013). Local Government Financing Platforms in China: A Fortune or Misfortune? IMF Working Paper WP/13/243. International Monetary Fund.
Ministry of Finance of the People’s Republic of China (2025). Report on the Execution of the Central and Local Budgets for 2024 and on the Draft Central and Local Budgets for 2025. Beijing.
Ministry of Finance of the People’s Republic of China (2026). Fiscal revenue and expenditure statistics for 2025 and for January to August 2026. Beijing.
National Bureau of Statistics of China (2026). Investment in Fixed Assets from January to August 2026. Press release, 16 September 2026.
Reuters (2026). China’s January to August government land sales revenue down 28.6% year on year. September 2026.
Reuters (2026). China ramps up fiscal push to meet growth target. 9 October 2026.
Rogoff, K. and Yang, Y. (2021). Has China’s Housing Production Peaked? China and World Economy, 29(1), 1 to 31.
Yicai Global (2026). China’s Local Government Debt Remains Controllable Despite Growing 15% in 2025, Finance Ministry Says. February 2026.
Zhang, Y. S. and Barnett, S. (2014). Fiscal Vulnerabilities and Risks from Local Government Finance in China. IMF Working Paper WP/14/4. International Monetary Fund.
