
Australia’s Productivity Stagnation: Measuring a Decade of Lost Growth and Its Consequences for Wages, Inflation and Living Standards

Australia’s Productivity Stagnation: Measuring a Decade of Lost Growth and Its Consequences for Wages, Inflation and Living Standards
Driss EFFINA, PhD Independent Researcher, Global Strategy Files Reading time: about 26 minutes
Key takeaways
- Australian labour productivity in June 2026 was only 3.6 percent higher than in June 2014, an average of about 0.3 percent a year.
- Productivity is about 20 percent below the level implied by its 60 year average growth of 1.8 percent a year since 2014.
- Australia produces about 86 percent of US output per hour worked and about 89 percent of Germany's.
- Real wages measured by the Wage Price Index were 3.5 percent lower in December 2025 than in December 2021.
Abstract
Labour productivity is the main long-run source of rising real wages and living standards. In Australia, it has barely grown for more than a decade. According to the Productivity Commission, labour productivity across the whole economy in June 2026 was only 3.6 percent higher than in June 2014, an average of about 0.3 percent a year, and was 0.2 percent lower than a year earlier. This article measures the extent and consequences of this stagnation using data from the Productivity Commission, the Australian Bureau of Statistics (ABS), the Reserve Bank of Australia (RBA) and the OECD. The author builds five indicators: a counterfactual comparison between actual productivity and historical growth paths, a decomposition of output growth by productivity cycle and industry, an international comparison of output per hour, an estimate of the real wage gap, and scenarios for productivity to 2035. The results show that productivity is about 20 percent below the level it would have reached if it had grown at its 60-year average of 1.8 percent a year since 2014, and 10 percent below the path implied by the already weak 2010s average. Non-farm labour productivity per hour in mid-2026 is roughly at its end-2019 level. Australia produces about 86 percent of US output per hour worked. Real wages measured by the Wage Price Index were 3.5 percent lower in December 2025 than in December 2021. In 2024-25, multifactor productivity in the market sector fell by 0.5 percent, with mining, accommodation and manufacturing recording the largest declines. The article concludes that productivity stagnation is now the central constraint on Australian economic policy: it explains the persistence of inflation, the weakness of real wages and the difficulty of building enough housing, and it cannot be solved by monetary policy.
Keywords: Australia, labour productivity, multifactor productivity, real wages, unit labour costs, potential growth, structural reform, non-market sector
JEL codes: O47, O56, E24, J31, D24
1. Introduction
Paul Krugman’s often quoted remark that productivity is not everything, but in the long run it is almost everything, has rarely been more relevant to Australia than in 2026. In its September 2026 decision to raise the cash rate for the fourth time in the year, the Reserve Bank of Australia pointed to weak productivity growth as a key reason why unit labour costs remain above the rate consistent with the inflation target. Its Governor described productivity as a key constraint on growth and real wages, while noting that productivity policy lies outside the central bank’s remit. In the housing sector, examined in the previous article in this series, the Productivity Commission found that the productivity of residential construction has fallen over thirty years, one reason why supply has not kept pace with demand.
This article examines the productivity problem directly. It asks five questions. How large is the slowdown, measured against Australia’s own history? Is it concentrated in particular sectors or spread across the economy? How does Australia compare with other advanced economies? What are its consequences for wages and inflation? And what difference would a recovery make?
The analysis relies on official data: the Productivity Commission’s quarterly productivity updates, the ABS estimates of industry multifactor productivity for 2024-25, the RBA’s table of labour costs and productivity, and OECD estimates of output per hour. All counterfactuals, decompositions and scenarios are the author’s own calculations.
Section 2 presents the context. Section 3 reviews the literature. Section 4 describes data and methods. Section 5 presents the results. Section 6 discusses them. Section 7 presents scenarios. Section 8 concludes.
2. Context
2.1 Productivity and living standards
Labour productivity measures the quantity of output produced per hour worked. Over long periods, it is the main determinant of real income per person, because the number of hours worked per person cannot rise indefinitely. In Australia, labour productivity grew by an average of about 1.8 percent a year over the sixty years to 2019-20, according to the Productivity Commission. This growth, compounded over decades, explains most of the increase in Australian living standards since the 1960s.
2.2 A slowdown in two stages
The slowdown occurred in two stages. In the decade to 2020, labour productivity growth fell to about 1.1 percent a year, a decline of about one third relative to the long-run average. The Productivity Commission’s five-year inquiry, published in 2023, documented this slowdown and proposed 71 recommendations to reverse it.
Since then, the situation has worsened. After the pandemic, measured productivity first rose sharply, because lockdowns temporarily removed many low productivity jobs, then fell sharply in 2022 and 2023 as these jobs returned and hours worked grew faster than output. In the September 2026 update, the Productivity Commission reported that labour productivity was flat in the June quarter of 2026, after a 0.6 percent fall in the March quarter, and 0.2 percent lower than a year earlier. Output rose by 2.1 percent over the year, but hours worked rose by 2.3 percent. Productivity across the whole economy was barely 1 percent above its average of 2015 to 2019.
2.3 Market and non-market sectors
The Productivity Commission distinguishes between the market sector, which produces goods and services sold in markets, and the non-market sector, mainly health, education and public administration, where output is difficult to measure and is often estimated from inputs. Since June 2014, productivity in the market sector has increased by 7.5 percent, while productivity in the non-market sector has fallen by 2.5 percent and is below its March 2007 level. Since the non-market sector has grown rapidly, notably with the expansion of the National Disability Insurance Scheme and of health and aged care, its weak measured productivity weighs increasingly on the aggregate.
2.4 Policy response
The Commonwealth government has made productivity a stated priority. The May 2026 Budget progressed, according to the Productivity Commission, 13 of the 17 reform areas identified in its five pillars of productivity inquiries, covering areas such as competition, regulation, the energy transition, data and digital technology, and the care economy. The Productivity Commission is conducting further inquiries into housing supply, business dynamism and reporting requirements. But as the Commission itself notes, no single policy can restore long-term average growth.
3. Literature review
The study of productivity growth is one of the oldest topics in economics. Solow (1957) introduced the growth accounting framework that decomposes output growth into contributions from capital, labour and a residual, now called multifactor productivity, which captures improvements in technology and efficiency. This framework is still used by the ABS and the Productivity Commission.
The global productivity slowdown since the mid-2000s has generated a large literature. Fernald (2015) documented that the slowdown in the United States began before the global financial crisis and was linked to the fading of the information technology boom. Gordon (2016) argued that the great inventions of the late nineteenth and early twentieth centuries had a larger impact on productivity than the digital revolution, and that slower growth may be a new normal. Brynjolfsson, Rock and Syverson (2021) proposed the concept of a productivity “J curve”: new general purpose technologies such as artificial intelligence initially require large intangible investments that depress measured productivity, before generating gains later.
A second strand studies the dispersion of productivity between firms. Andrews, Criscuolo and Gal (2016), in an influential OECD paper, showed that productivity at the global frontier firms continued to grow strongly after 2000, while that of other firms stagnated, suggesting that the slowdown reflects a failure of technology diffusion. Applying this framework to Australia, Andrews, Hambur, Hansell and Wheeler (2022), in a Treasury working paper, found that Australian firms are on average far from the global productivity frontier and that the speed at which they catch up has slowed. Hambur (2023) found evidence of rising market power in Australian industries, which may reduce the pressure to innovate.
A third strand is specific to Australia. The Productivity Commission’s five-year inquiry (2023) identified five areas for reform: building a skilled workforce, harnessing data and digital technology, creating a more dynamic economy, lifting productivity in the non-market sector, and achieving net zero emissions at least cost. The RBA has studied the link between productivity, unit labour costs and inflation, which became central to monetary policy discussions from 2023.
This article contributes to this literature by updating the measurement of the slowdown to mid-2026, by quantifying the gap between actual productivity and historical growth paths, and by linking productivity explicitly to real wages and the inflation outlook.
4. Data and methodology
4.1 Data
The data come from:
- the Productivity Commission’s productivity update of September 2026, which gives labour productivity for the whole economy and for the market and non-market sectors up to the June quarter of 2026;
- the ABS Estimates of Industry Multifactor Productivity for 2024-25, which provide multifactor productivity by industry and growth accounting by productivity cycle;
- RBA Table H4, which reports non-farm labour productivity per hour, average earnings per hour and unit labour costs from the national accounts;
- RBA Tables G1 and H4, for the Consumer Price Index and the Wage Price Index;
- OECD Productivity Statistics, for GDP per hour worked in US dollars at purchasing power parity in 2023.
4.2 Methods
1. Counterfactual paths. The actual level of labour productivity in June 2026, relative to June 2014, is compared with the levels that would have been reached if productivity had grown at 1.1 percent a year (the average of the decade to 2020) or 1.8 percent a year (the sixty-year average) over the same twelve years. 2. Growth accounting by cycle. The ABS decomposes market sector output growth over each productivity cycle into contributions from capital services, hours worked and multifactor productivity. These contributions are presented as published. 3. International comparison. GDP per hour worked in Australia is compared with that of eleven other OECD countries. 4. Real wages. Real wage growth is calculated as the difference between year-ended growth in the Wage Price Index and year-ended growth in the Consumer Price Index. A cumulative real wage index is calculated from December 2021 to December 2025. 5. Wage growth consistent with the inflation target. With stable profit margins, unit labour cost growth consistent with the 2.5 percent inflation target is about 2.5 percent. Wage growth consistent with the target is therefore about 2.5 percent plus productivity growth. 6. Scenarios. Productivity is projected from 2026 to 2035 under three constant growth rates: 0.3, 1.1 and 1.8 percent a year.
4.3 Limitations
Productivity measurement is subject to significant uncertainty. Output in the non-market sector is poorly measured. Quarterly productivity estimates are volatile and frequently revised. The pandemic produced large composition effects. International comparisons depend on purchasing power parity estimates and on the measurement of hours worked. The counterfactual paths are illustrative and do not imply that the long-run average could have been maintained.
5. Results
5.1 Six years without progress
Figure 1 shows the year-ended growth of non-farm labour productivity per hour since 2019 and its level since early 2022.
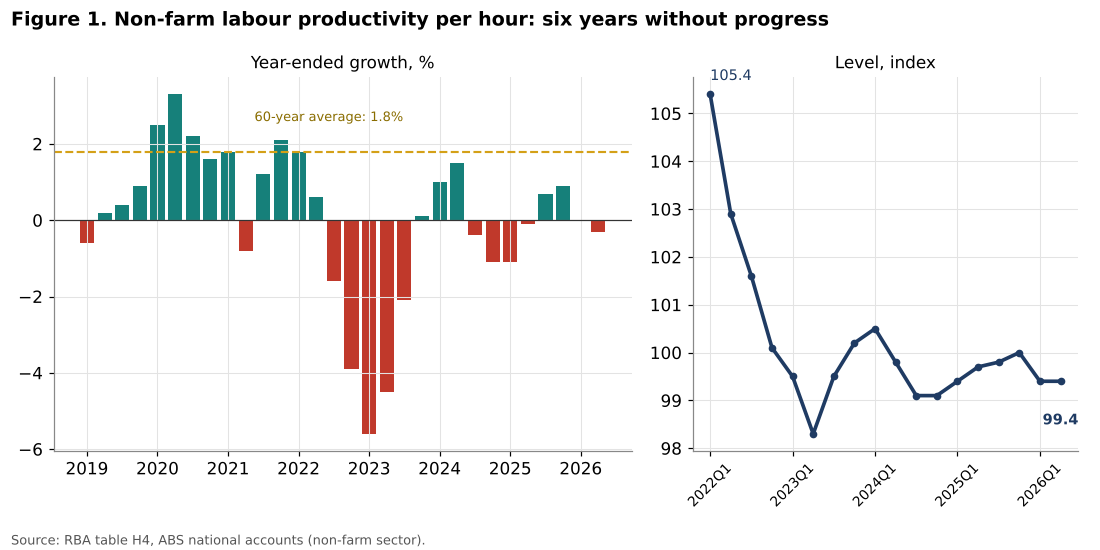
The pattern is clear. During the pandemic, measured productivity rose strongly: year-ended growth reached 3.3 percent in the June quarter of 2020. This reflected a composition effect: the jobs lost during lockdowns were concentrated in low productivity sectors such as hospitality and retail, which raised average productivity mechanically.
From 2022, as these jobs returned and the labour market tightened, productivity fell sharply. Year-ended growth reached -5.6 percent in the March quarter of 2023. The level of productivity fell from an index of 105.4 in the March quarter of 2022 to 98.3 in the June quarter of 2023. It has since fluctuated in a narrow range, between 99 and 100.5, and was 99.4 in the June quarter of 2026, about 5.7 percent below its early 2022 level.
Over the full period from the end of 2019 to mid-2026, non-farm productivity per hour has essentially not grown. The average of year-ended growth rates in the December quarters of 2019 to 2025 and the June quarter of 2026 is close to zero. Six and a half years of economic activity, including a pandemic, a recovery, an inflation episode and a period of tight monetary policy, have produced no increase in output per hour worked.
5.2 A decade of lost growth
Figure 2 compares the actual level of productivity in June 2026 with two counterfactual growth paths since June 2014.
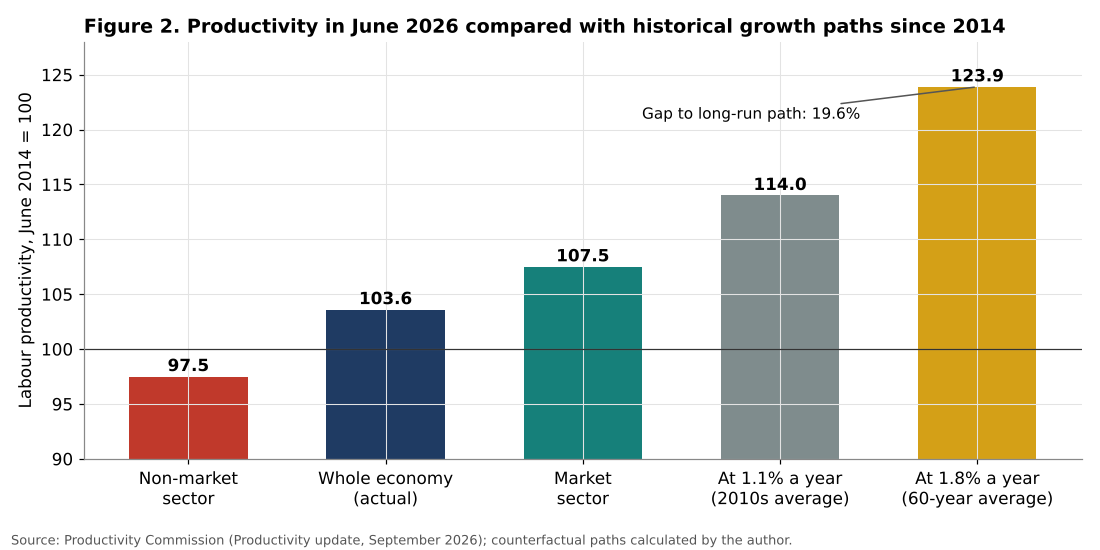
According to the Productivity Commission, labour productivity across the whole economy in June 2026 was 3.6 percent higher than in June 2014, an average annual growth rate of only 0.3 percent. In the market sector, productivity rose by 7.5 percent over the period, or about 0.6 percent a year. In the non-market sector, it fell by 2.5 percent.
If productivity had grown at 1.1 percent a year, the average of the decade to 2020, its level would be 14 percent above June 2014 rather than 3.6 percent. If it had grown at 1.8 percent a year, its sixty-year average, it would be 23.9 percent higher. In other words, productivity in 2026 is about 10 percent below the path of the already weak 2010s, and about 20 percent below the path of its long-run history.
This gap is large. It means that, at the same number of hours worked, Australian output in 2026 would be about one fifth higher if productivity had kept to its historical trend. Since output per person is the basis of income per person, the gap represents a loss of potential income of a similar order. Part of this loss is the result of global trends, since productivity growth has slowed in almost all advanced economies. But the slowdown in Australia since 2014 is particularly marked.
5.3 How Australia compares
Figure 3 compares GDP per hour worked in Australia with that of other OECD countries in 2023.
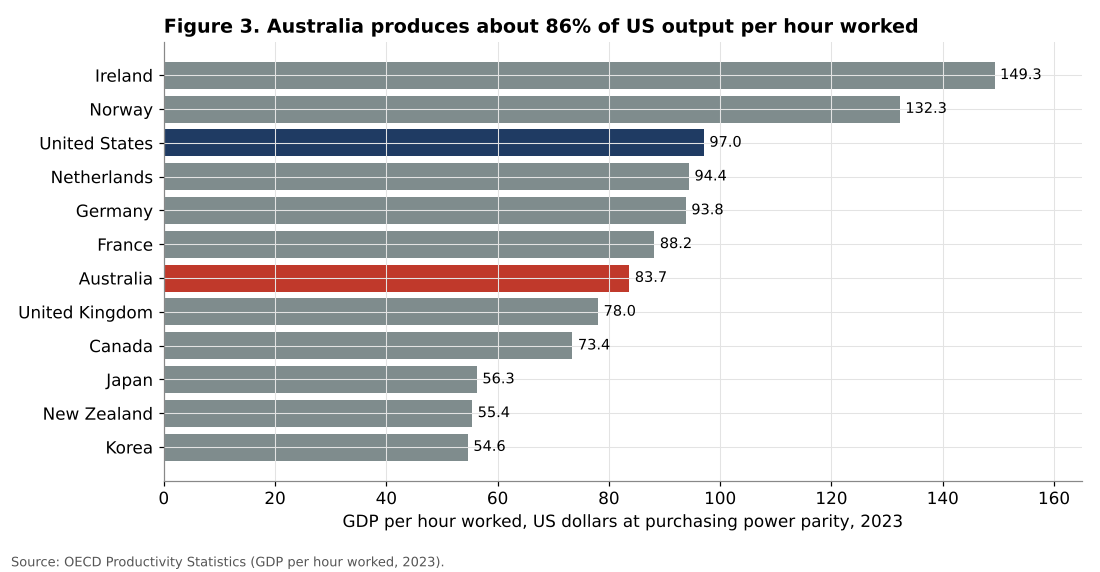
In 2023, Australia produced about US$83.7 of GDP per hour worked, measured at purchasing power parity. This is about 86 percent of the level of the United States (US$97.1) and 89 percent of that of Germany (US$93.8). It is below the Netherlands (US$94.4) and France (US$88.2), but above the United Kingdom (US$78.1) and Canada (US$73.4), and far above Japan, New Zealand and Korea. Ireland and Norway are outliers because of the weight of multinational profits and oil and gas respectively.
| Country | GDP per hour worked, 2023 (US$ PPP) | Australia as % of country |
|---|---|---|
| United States | 97.1 | 86% |
| Netherlands | 94.4 | 89% |
| Germany | 93.8 | 89% |
| France | 88.2 | 95% |
| Australia | 83.7 | 100% |
| United Kingdom | 78.1 | 107% |
| Canada | 73.4 | 114% |
| New Zealand | 55.4 | 151% |
Table 1. GDP per hour worked, 2023. Source: OECD; ratios calculated by the author.
Australia therefore has a sizeable gap with the most productive large economies. Since Australia has comparable levels of education and institutions, and a capital-intensive mining sector that should raise average productivity, this gap suggests that there is room to catch up. The research by Treasury economists on the distance of Australian firms from the global frontier supports this interpretation: the problem is not that Australia cannot access the best technologies, but that they diffuse slowly through the economy.
5.4 Where growth comes from
Figure 4 presents two decompositions from the ABS estimates of industry multifactor productivity.
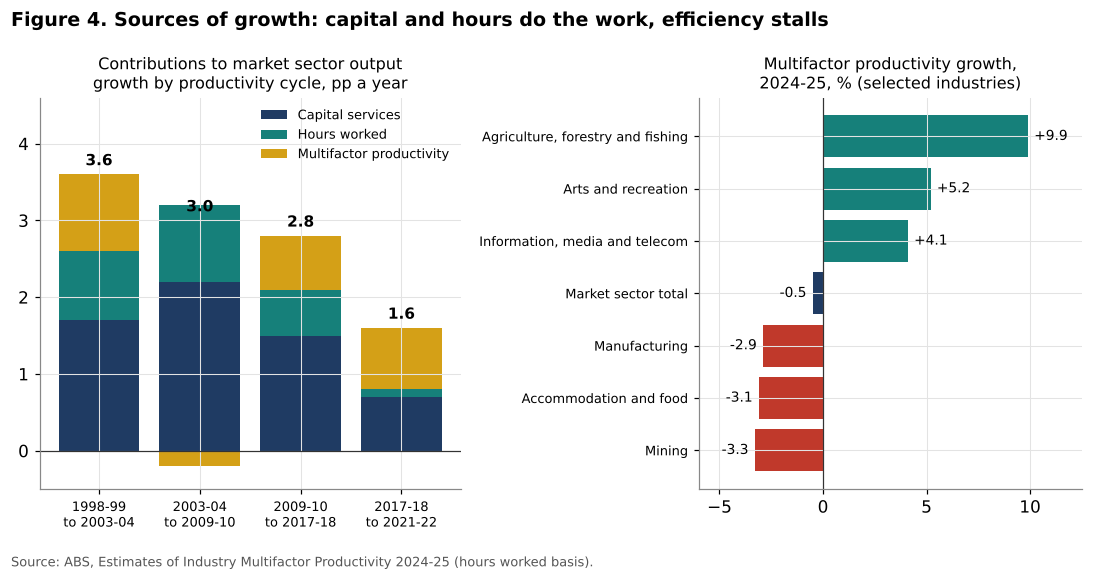
The left panel shows the contributions to market sector output growth in each productivity cycle defined by the ABS. In the cycle from 1998-99 to 2003-04, output grew by 3.6 percent a year, with capital services contributing 1.7 points, hours worked 0.9 points and multifactor productivity 1.0 point. In the following cycle, from 2003-04 to 2009-10, which corresponds to the mining investment boom, output growth slowed to 3.0 percent, with capital contributing 2.2 points but multifactor productivity falling (-0.2 points). From 2009-10 to 2017-18, output grew by 2.8 percent, with multifactor productivity contributing 0.7 points. In the last complete cycle, from 2017-18 to 2021-22, output growth slowed to 1.6 percent a year.
The most recent year confirms the weakness. In 2024-25, market sector multifactor productivity fell by 0.5 percent and labour productivity by 0.2 percent. Output (gross value added) grew by only 0.9 percent, hours worked by 1.0 percent and capital services by 1.8 percent. In other words, all of the growth of output came from more inputs; none came from more efficient use of them.
The right panel shows multifactor productivity growth in selected industries in 2024-25. The performance was very uneven. Agriculture, forestry and fishing recorded growth of 9.9 percent, largely because of favourable seasonal conditions. Arts and recreation (5.2 percent) and information, media and telecommunications (4.1 percent) also grew strongly. At the other end, mining recorded a decline of 3.3 percent, its fifth consecutive annual fall, followed by accommodation and food services (-3.1 percent) and manufacturing (-2.9 percent). Multifactor productivity fell in nine of the sixteen market sector industries.
The case of mining deserves comment. Mining productivity has been falling for several years as companies extract lower grade ore, develop more difficult deposits and expand their capital stock ahead of production. In 2024-25, mining was the largest single detractor from market sector labour productivity growth, subtracting about 1.0 percentage point. Construction subtracted about 0.3 points, its labour productivity falling by 2.9 percent. The largest positive contribution came from financial and insurance services (about 0.4 points). The reallocation of hours between industries added about 0.4 points, including 0.7 points from mining.
5.5 Productivity and real wages
Figure 5 shows the growth of wages and prices and the resulting real wage growth.
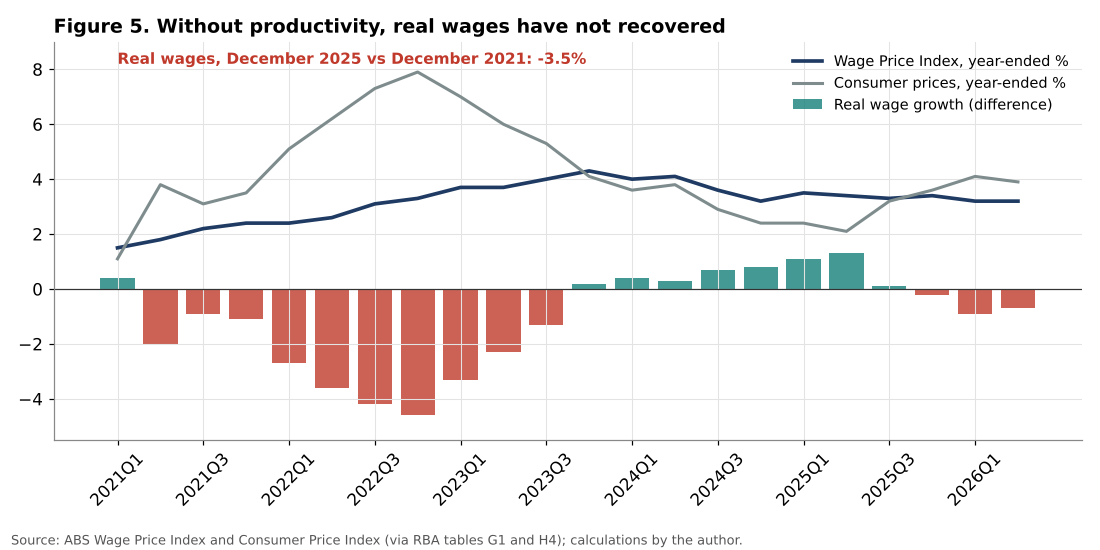
Real wages, measured by the Wage Price Index deflated by the Consumer Price Index, fell sharply in 2022 and early 2023, when inflation peaked at 7.9 percent while wage growth was around 3 percent. From the September quarter of 2023 to mid-2025, real wages grew again, by up to 1.3 percent a year, as inflation fell faster than wage growth. Since the second half of 2025, with inflation rising again, real wage growth has turned negative: -0.9 percent in the March quarter of 2026 and -0.7 percent in the June quarter.
Cumulatively, the author estimates that real wages in December 2025 were about 3.5 percent below their level of December 2021. Four years after the start of the inflation episode, the purchasing power of wages has not recovered, and the renewed rise in inflation in 2026 means that the gap has widened again.
The link with productivity is direct. In the long run, real wages can only grow sustainably at the rate of productivity growth. When productivity is flat, any increase in real wages raises unit labour costs, which either reduces profit margins or raises prices. In the year to June 2026, average earnings per hour in the non-farm sector rose by 3.2 percent and productivity fell by 0.3 percent, so unit labour costs rose by about 3.5 percent.
5.6 Productivity and inflation
This arithmetic explains why productivity has become central to Australian monetary policy. With stable profit margins, unit labour cost growth of 2.5 percent is consistent with inflation at the midpoint of the target. The wage growth compatible with the target therefore depends on productivity:
| Productivity growth | Wage growth consistent with 2.5% inflation |
|---|---|
| 0.0% (recent experience) | about 2.5% |
| 1.1% (2010s average) | about 3.6% |
| 1.8% (long-run average) | about 4.3% |
Table 2. Wage growth consistent with the inflation target under different productivity assumptions. Source: calculations by the author.
With productivity growth of zero, wage growth must fall to about 2.5 percent for inflation to return durably to the midpoint of the target, which implies zero real wage growth. With productivity growth of 1.8 percent, wages could grow by 4.3 percent a year without adding to inflation, allowing real wages to rise by 1.8 percent a year.
Current wage growth of about 3.2 percent is moderate by historical standards. In a normal productivity environment, it would be fully consistent with the inflation target. It is only because productivity is not growing that it generates unit labour cost growth above the target. The RBA’s statement in September 2026 that unit labour cost growth was above the target-consistent rate “because of weak productivity rather than strong wages” captures this point precisely.
This has an uncomfortable implication. If productivity does not recover, the RBA can only bring inflation back to target by reducing wage growth, which requires a looser labour market and higher unemployment. Productivity stagnation therefore turns a supply problem into a demand management problem, and the cost is borne by workers.
5.7 The non-market sector
The divergence between the market and non-market sectors deserves attention. Since 2014, measured productivity in the non-market sector, which includes health care, education, public administration and the expanding care economy, has fallen by 2.5 percent, while market sector productivity has risen by 7.5 percent. The non-market sector’s share of employment has grown, notably because of the expansion of disability and aged care services and the growth of health spending as the population ages.
Part of the weak measured productivity of this sector is a measurement problem: in many services, output is estimated from inputs, so productivity growth is by construction close to zero. But part is real: these services are labour intensive and have been slow to adopt technologies that save labour. The Productivity Commission has recommended shifting government funding from inputs to outcomes and using digital technologies such as telehealth to raise productivity in these services. As the non-market sector grows, its productivity will increasingly determine the aggregate.
5.8 Growth from hours, not from efficiency
The national accounts also show how Australia has maintained aggregate growth despite flat productivity. Over the year to June 2026, output rose by 2.1 percent and hours worked by 2.3 percent. In other words, all of the growth of the economy came from working more hours, and slightly more than all of it, since output per hour fell. This reflects the strong growth of the population, which rose by 1.4 percent in the year to March 2026, and the high participation rate of the working age population.
Growth driven by hours rather than by productivity has three consequences. First, it does not raise income per person: GDP per capita rose by only 0.7 percent over the year to June 2026, after eight consecutive quarters of decline on a year-ended basis between mid-2023 and early 2025. Second, it increases the demand for housing, infrastructure and public services without generating the efficiency gains that would make them easier to finance, which links productivity stagnation to the housing shortage discussed in the previous article. Third, it cannot continue indefinitely: participation is already close to record highs, and population growth is expected to slow as net overseas migration declines.
The comparison between aggregate growth and growth per person is therefore essential for assessing Australian economic performance. Headline GDP growth of around 2 percent a year looks respectable by the standards of advanced economies, but once population growth is taken into account, the improvement in average living standards over the past four years has been close to zero.
6. Discussion
6.1 Why has productivity stagnated?
The evidence points to several overlapping causes.
Slow technology diffusion. As Treasury research has shown, Australian firms are on average far from the global frontier and are catching up more slowly than in the past. The problem is not access to technology but its adoption across the bulk of firms.
Weak business dynamism. Rates of firm entry and job reallocation have declined, and evidence suggests that market concentration has increased in several industries. Less competition reduces the pressure to innovate and slows the reallocation of resources to the most productive firms.
Composition effects. The growth of labour intensive services, especially in the non-market sector, lowers average measured productivity even if productivity within each sector is unchanged.
Mining. The fall in mining productivity reflects geological factors and the timing of investment. It is a significant drag on the aggregate but is partly cyclical.
Construction and housing. The decline in construction productivity over thirty years, documented by the Productivity Commission, reflects regulatory complexity, small firm size and slow adoption of industrialised construction methods. It has direct consequences for housing supply, as discussed in the previous article.
Investment. Capital services grew by 1.8 percent in 2024-25, faster than hours worked, so capital deepening has been positive. But for many years before the current boom in business investment, non-mining investment was weak relative to GDP. The recent strength of business investment, particularly in data centres, may raise productivity in the future, but the effect is not yet visible.
6.2 Artificial intelligence: hope and uncertainty
Artificial intelligence is often presented as the technology that could reverse the productivity slowdown. The RBA Governor noted in September 2026 that AI could eventually raise productivity, but that the timing was uncertain. In the meantime, the AI boom is raising demand, notably for data centre construction and electricity, and is raising some input costs.
The concept of the productivity J curve (Brynjolfsson, Rock and Syverson, 2021) suggests that the initial phase of adoption of a general purpose technology may even reduce measured productivity, because firms invest in intangible assets such as training, reorganisation and data that are not counted as output. If this is the case, the current weakness of Australian productivity may partly reflect the early stage of AI adoption. But this remains a hypothesis, and the experience of previous technologies suggests that the gains may take a decade or more to materialise.
Moreover, the gains from AI will depend on the same factors that have limited the diffusion of previous technologies in Australia: skills, competition, management quality and regulation. Without progress in these areas, AI may widen rather than narrow the gap between frontier firms and the rest.
6.3 Implications for monetary policy
The analysis has direct implications for the RBA. With productivity flat, the rate of wage growth consistent with the inflation target is lower than in the past, which means that the labour market must be looser to achieve the same inflation outcome. The neutral level of unemployment may have risen. This helps explain why the RBA has had to raise rates in 2026 despite moderate wage growth and a gradual rise in unemployment.
It also means that the RBA’s task would be much easier if productivity recovered. A return to productivity growth of 1 percent would allow wage growth of about 3.5 percent without exceeding the target, which is roughly the current rate.
6.4 Implications for fiscal policy
For fiscal policy, productivity stagnation means slower growth of the tax base and therefore tighter budgets. It also raises the cost of the expansion of the care economy, since the cost of labour intensive services rises faster than average prices when their productivity does not grow. Reforms that raise productivity in the non-market sector would therefore have significant budgetary benefits.
6.5 The reform agenda
The Productivity Commission’s recommendations provide a broad agenda: improving the skills of the workforce, reducing regulatory barriers to competition and investment, reforming planning and construction regulation, accelerating the adoption of digital technology and data, improving the efficiency of government services, and managing the energy transition at least cost. The challenge is not identifying reforms but implementing them, since many require coordination between the Commonwealth and the states and face resistance from affected interests.
The analysis presented here suggests that the payoff from successful reform would be large. Each additional tenth of a percentage point of productivity growth, sustained over a decade, raises income per person by about 1 percent.
6.6 Lessons from the 1990s
Australia has already experienced a productivity revival. In the 1990s, labour productivity growth accelerated to above 2 percent a year, one of the strongest performances among advanced economies. Most studies, including those of the Productivity Commission, attribute this revival to a wave of reforms in the 1980s and early 1990s: the floating of the dollar, financial deregulation, tariff reductions, the National Competition Policy, and enterprise bargaining in the labour market. These reforms exposed firms to competition and allowed resources to move to their most productive uses.
The lesson for 2026 is that productivity can respond to policy, but with lags of several years and only when reforms are broad and sustained. The reforms of that period were also politically difficult and required cooperation between the Commonwealth and the states, as would many of the reforms needed today in planning, energy, skills and government services.
7. Scenarios to 2035
7.1 Three paths
Figure 6 presents three scenarios for labour productivity from 2026 to 2035.
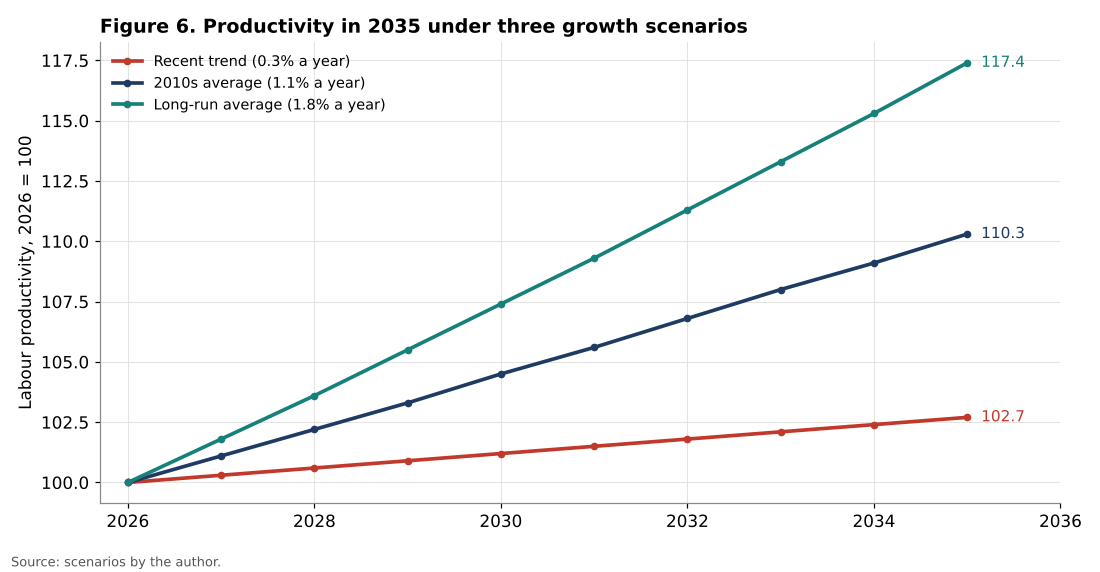
Scenario 1: Recent trend. Productivity continues to grow at about 0.3 percent a year, its average since 2014. By 2035, it is 2.7 percent above its 2026 level. Real wages grow only slowly, and the inflation target requires sustained wage restraint.
Scenario 2: Return to the 2010s average. Productivity grows at 1.1 percent a year, as in the decade to 2020, helped by the gradual diffusion of digital technologies and AI and by some reforms. By 2035, it is 10.3 percent above its 2026 level.
Scenario 3: Return to the long-run average. A combination of successful structural reforms and significant gains from new technologies brings productivity growth back to 1.8 percent a year. By 2035, productivity is 17.4 percent above its 2026 level.
7.2 Interpretation
The difference between the scenarios is large. In 2035, productivity in scenario 3 is about 14 percent higher than in scenario 1. Applied to the Australian economy, this would represent a difference of income per person of a similar magnitude. The difference between scenarios 1 and 2 alone is about 7 percent.
These differences matter not only for income levels but for the trade-offs facing policy. In scenario 1, the RBA would face repeated conflicts between its inflation and employment objectives, and real wages would remain under pressure. In scenario 3, wage growth of 4 percent a year would be consistent with the inflation target, and real wages would rise steadily.
7.3 Which scenario is most likely?
On current evidence, scenario 1 is the most likely in the short term. Productivity was flat in the June quarter of 2026 and lower than a year earlier, multifactor productivity fell in 2024-25, and mining and construction productivity continue to decline. However, three factors could support a move toward scenario 2 in the second half of the decade: the strength of business investment, particularly in digital infrastructure; the gradual adoption of AI; and the implementation of reforms announced in the 2026 Budget. Scenario 3 would require a much more ambitious reform effort and a technological boost comparable to the information technology boom of the 1990s.
7.4 Indicators to monitor
The author suggests monitoring:
1. the Productivity Commission’s quarterly productivity updates, especially market sector productivity; 2. the ABS estimates of multifactor productivity, published each February; 3. business investment in machinery, equipment, software and intangible assets; 4. unit labour cost growth in the national accounts; 5. measures of business dynamism such as firm entry and exit rates.
8. Conclusion
This article has measured the stagnation of Australian productivity and its consequences. Its main findings are:
1. Labour productivity across the whole economy was only 3.6 percent higher in June 2026 than in June 2014, an average of 0.3 percent a year, and non-farm productivity per hour is roughly at its end-2019 level. 2. Productivity is about 10 percent below the path of the 2010s and about 20 percent below the path of its sixty-year average of 1.8 percent a year. 3. Australia produces about 86 percent of US output per hour worked and 89 percent of Germany’s. 4. In 2024-25, market sector multifactor productivity fell by 0.5 percent; all output growth came from more inputs. Mining, accommodation and manufacturing recorded the largest declines. 5. Real wages in December 2025 were about 3.5 percent below their December 2021 level, and with flat productivity, wage growth of only 3.2 percent is enough to push unit labour costs above the rate consistent with the inflation target.
Productivity stagnation is therefore the central constraint on Australian economic policy. It explains why inflation is persistent despite moderate wage growth, why real wages have not recovered, why the Reserve Bank has had to raise rates in 2026, and why the housing industry cannot build enough homes. Monetary policy cannot solve it: it can only manage its consequences by keeping demand in line with weak supply. The solution lies in structural reforms that accelerate the diffusion of technology, strengthen competition, improve skills and raise the efficiency of government services. The scenarios show that the stakes are considerable: the difference between continued stagnation and a return to the long-run average is a difference of about 14 percent in productivity, and in living standards, within a decade.
Need this analysis for your organisation?
We prepare confidential briefings, executive talks and studies on countries, markets and policies, built on the same method as this article.
Request a briefingSupport independent analysis
Our studies are free to read and carry no advertising. If this one was useful, a small contribution helps us publish the next.
Support our workGo further: books by Global Strategy Files

Frequently asked questions
How fast has Australian productivity grown since 2014?
Barely at all. Labour productivity across the whole economy was only 3.6 percent higher in June 2026 than in June 2014, an average of about 0.3 percent a year, and it was 0.2 percent lower than a year earlier. Non-farm productivity per hour is roughly at its end-2019 level.
How much growth has Australia lost through weak productivity?
Australian productivity is about 20 percent below the level it would have reached had it grown at its 60 year average of 1.8 percent a year since 2014, and about 10 percent below the path implied by the already weak average of the 2010s.
How does Australian productivity compare internationally?
Australia produces about 86 percent of US output per hour worked and about 89 percent of Germany’s. In 2024-25, multifactor productivity in the market sector fell by 0.5 percent, with mining, accommodation and manufacturing recording the largest declines.
Why does productivity matter for Australian wages and inflation?
Without productivity growth, real wages cannot rise sustainably and any wage increase adds to costs. Real wages measured by the Wage Price Index were 3.5 percent lower in December 2025 than in December 2021, and weak productivity helps explain persistent inflation.
Methodological note
All counterfactuals, ratios and scenarios in this article were calculated by the author. Productivity levels for the whole economy and the market and non-market sectors come from the Productivity Commission’s productivity update of September 2026. Non-farm productivity per hour, average earnings per hour and unit labour costs come from RBA Table H4. Multifactor productivity and growth accounting come from the ABS Estimates of Industry Multifactor Productivity, 2024-25 (hours worked basis). Wage and price indices come from the ABS via RBA Tables G1 and H4. International comparisons use OECD estimates of GDP per hour worked in 2023 at purchasing power parity. The scenarios assume constant annual growth rates and are illustrative.
References
Andrews, D., Criscuolo, C. and Gal, P. N. (2016). The Best versus the Rest: The Global Productivity Slowdown, Divergence across Firms and the Role of Public Policy. OECD Productivity Working Papers, No. 5. OECD Publishing, Paris.
Andrews, D., Hambur, J., Hansell, D. and Wheeler, A. (2022). Reaching for the Stars: Australian Firms and the Global Productivity Frontier. Treasury Working Paper 2022-01. Australian Government, Canberra.
Australian Bureau of Statistics (2026). Estimates of Industry Multifactor Productivity, 2024-25. Canberra.
Brynjolfsson, E., Rock, D. and Syverson, C. (2021). The Productivity J-Curve: How Intangibles Complement General Purpose Technologies. American Economic Journal: Macroeconomics, 13(1), 333 to 372.
Fernald, J. G. (2015). Productivity and Potential Output before, during, and after the Great Recession. NBER Macroeconomics Annual, 29(1), 1 to 51.
Gordon, R. J. (2016). The Rise and Fall of American Growth: The US Standard of Living since the Civil War. Princeton University Press.
Hambur, J. (2023). Product Market Power and its Implications for the Australian Economy. Treasury Working Paper 2023-03. Australian Government, Canberra.
OECD (2025). OECD Productivity Statistics: Level of GDP per Capita and Productivity. OECD Publishing, Paris.
Productivity Commission (2023). 5-year Productivity Inquiry: Advancing Prosperity. Inquiry Report No. 100. Canberra.
Productivity Commission (2025). Housing Construction Productivity: Can We Fix It? Research Paper. Canberra.
Productivity Commission (2026). Productivity Update, September 2026. Canberra.
Reserve Bank of Australia (2026). Statistical Tables G1 and H4; Statement by the Monetary Policy Board and Media Conference, 29 September 2026. Sydney.
Solow, R. M. (1957). Technical Change and the Aggregate Production Function. Review of Economics and Statistics, 39(3), 312 to 320.
