
Artificial Intelligence and Productivity in India: Opportunity, Exposure and the Structural Gap


Artificial Intelligence and Productivity in India: Opportunity, Exposure and the Structural Gap
Driss EFFINA, PhD Independent Researcher, Global Strategy Files Reading time: about 27 minutes
Key takeaways
- Value added per worker in Indian agriculture is about 2.1 lakh rupees, against 6.2 lakh in manufacturing and 15.6 lakh in modern services.
- Moving 5 percent of workers from agriculture to manufacturing would raise aggregate value added by about 4 percent, more than AI's estimated ten year gain of 3.5 percent.
- About 22 percent of Indian employment, roughly 13.5 crore workers, is highly exposed to artificial intelligence.
- Indian IT sector revenue grew 6.1 percent in 2025-26 while headcount rose only 2.3 percent, an early sign of decoupling.
Abstract
The World Bank devoted the special focus of its India Development Update of October 2026 to artificial intelligence, describing India as well positioned to benefit from AI thanks to its technical workforce, its globally integrated IT sector and its digital public infrastructure. This article examines what AI could mean for productivity in India, starting from the structure of the economy rather than from the technology. Using the national accounts of the Ministry of Statistics and Programme Implementation (MoSPI), the Periodic Labour Force Survey (PLFS) 2025, the World Bank’s estimates of AI exposure, data from the Reserve Bank of India (RBI) on software exports and from Nasscom on the technology industry, the author computes output per worker by sector, the gap between employment and value added shares, the number of workers exposed to AI, the productivity of the IT sector and the potential gains from AI under three diffusion scenarios. The results show that India’s main productivity problem is structural: gross value added per worker in agriculture, which employs 43 percent of workers, is about 2.1 lakh rupees, against 6.2 lakh in manufacturing and 15.6 lakh in modern services, a gap of one to seven. Moving 5 percent of the workforce from agriculture to manufacturing would raise aggregate value added by about 4 percent, more than the author’s central estimate of the gain from AI over ten years (about 3.5 percent). About 22 percent of employment, roughly 13.5 crore workers, is highly exposed to AI, of which 14 percent in roles where AI is more likely to complement than replace workers. In the IT sector, revenue grew by 6.1 percent in 2025-26 while headcount rose by only 2.3 percent, an early sign of the decoupling of output and employment. The article concludes that AI can add a few tenths of a percentage point to annual growth, but that it will not replace structural transformation as the main source of productivity gains, and that its benefits will depend on skills, adoption by small firms and the management of risks to entry-level jobs.
Keywords: India, artificial intelligence, productivity, structural transformation, IT services, global capability centres, labour market, technology adoption
JEL codes: O33, O47, J24, L86, O14, O53
1. Introduction
Artificial intelligence has become the main topic of economic debate since the arrival of large generative models in 2022 and 2023. For advanced economies, the debate focuses on the effects of AI on productivity, employment and inequality. For India, the question has an additional dimension. India is both a potential beneficiary of AI, as the world’s leading exporter of IT services with a large pool of engineers, and a potentially vulnerable economy, since part of its export model rests on routine cognitive tasks that AI could automate.
The World Bank’s India Development Update of October 2026, titled “India and Artificial Intelligence: Seizing the Development Opportunity”, provides new data on AI in India. Private investment in AI rose from US$1.2 billion in 2024 to US$4.1 billion in 2025. Employment in global capability centres, the offshore technology and business service centres of multinational firms, rose from 1.9 million to 2.36 million. About 23 percent of surveyed formal firms with at least five employees use some form of AI. And about 22 percent of employment is highly exposed to AI-related changes in tasks.
This article places these findings in the broader context of Indian productivity. Its central argument is that the impact of AI on India cannot be understood without first understanding the structure of the Indian economy, in which a large share of workers are still in low-productivity agriculture and informal activities, where AI is unlikely to have a large direct effect in the short term.
The article asks four questions. How large are the productivity gaps between sectors in India? How many workers are exposed to AI, and in what way? What is happening to productivity and employment in the IT sector, the front line of AI? And how large could the gains from AI be, compared with other sources of productivity growth?
Section 2 sets out the context. Section 3 reviews the literature. Section 4 describes the data and methods. Section 5 presents the results. Section 6 discusses them. Section 7 presents scenarios. Section 8 concludes.
2. Context
2.1 India’s productivity record
India’s labour productivity has grown relatively fast over the past three decades, driven by a gradual movement of workers out of agriculture, rising investment and the growth of modern services. But productivity levels remain low by international standards, and the structure of employment has changed slowly. As shown in the previous article in this series, agriculture still employed 43 percent of workers in 2025, and 56 percent of workers were self-employed.
2.2 The IT services model
Since the 1990s, India has built a large IT and business services export sector. According to the RBI’s survey, published in September 2026, exports of software services reached US$221.4 billion in 2025-26, up 8.2 percent, and US$239.3 billion including the local activity of foreign affiliates. The United States accounted for 54.1 percent of these exports. According to Nasscom, the technology industry’s total revenue reached US$315 billion in 2025-26, with 5.95 million direct employees.
This model has relied on India’s comparative advantage in skilled labour at relatively low cost. Many of the tasks performed, including software maintenance, testing, data processing, customer support and back-office operations, are precisely the kinds of tasks that generative AI can perform or accelerate.
2.3 Public policy
The Government of India launched the IndiaAI Mission in 2024, with funding for computing infrastructure, datasets, research and skills. India’s digital public infrastructure, including the Aadhaar digital identity system, the Unified Payments Interface and the account aggregator framework, provides a platform for AI applications in finance, health, agriculture and public services. The World Bank report recommends strengthening workforce skills, building a more business-enabling environment and improving physical and digital infrastructure.
2.4 The global context
India’s AI ambitions develop in a global environment dominated by the United States and China, which account for the bulk of global private investment in AI, the largest models and most of the advanced computing capacity. The AI investment boom has also become a macroeconomic force in its own right: in several economies, including Australia as discussed earlier in this series, it has raised demand for data centres, electricity and specialised equipment, and contributed to inflationary pressures. For India, the global boom is both an opportunity, through the demand for services, engineering and data centre capacity, and a challenge, since the frontier of the technology is being developed largely elsewhere.
3. Literature review
The literature relevant to this article can be organised into three strands.
The first concerns structural transformation and productivity in India. McMillan and Rodrik (2011) showed that the movement of workers from low to high productivity sectors is a major source of aggregate productivity growth in developing countries, and that in some regions, structural change has been growth-reducing. For India, studies using the RBI’s KLEMS database have shown that the reallocation of labour from agriculture to services and construction contributed significantly to productivity growth, but that the movement to manufacturing has been limited. Rodrik (2016) described the phenomenon of “premature deindustrialisation”, in which developing countries reach their peak of manufacturing employment at lower income levels than earlier industrialisers, which limits the productivity gains from structural change.
The second strand concerns the microeconomic effects of generative AI. Brynjolfsson, Li and Raymond (2023) found that the introduction of a generative AI assistant in a customer support centre increased productivity by 14 percent on average, with much larger gains for less experienced workers. Noy and Zhang (2023) found, in an experiment, that access to a generative AI tool reduced the time taken to complete professional writing tasks by about 40 percent and increased quality. Peng and co-authors (2023) found that programmers using an AI coding assistant completed a task 55.8 percent faster. These studies suggest that the task-level gains can be large, particularly for less experienced workers.
The third strand concerns the macroeconomic effects of AI. Acemoglu (2024) used a task-based framework to estimate that the gains in total factor productivity from AI in the United States over ten years would be modest, of the order of 0.7 percent in total, because only a fraction of tasks are exposed, only a fraction of exposed tasks can be profitably automated, and the cost savings per task are limited. Other estimates are more optimistic. Eloundou and co-authors (2023) estimated that about 80 percent of the US workforce could have at least 10 percent of their tasks affected by large language models. The IMF (Cazzaniga and co-authors, 2024) estimated that about 40 percent of global employment is exposed to AI, with higher exposure in advanced economies (about 60 percent) than in emerging markets (about 40 percent) and low-income countries (about 26 percent), partly because of the larger share of agriculture and manual work in poorer economies.
The present article combines these strands. It uses the structural approach to measure the productivity gaps within the Indian economy, the World Bank’s exposure estimates to quantify the share of Indian workers affected by AI, and a simple task-based framework, inspired by Acemoglu (2024), to estimate the potential macroeconomic gains.
4. Data and methodology
4.1 Data
The data come from:
- MoSPI’s provisional estimates of gross value added by sector for 2025-26, at current prices;
- the PLFS Annual Report 2025, for total employment (61.6 crore persons) and the distribution of workers by industry;
- the World Bank India Development Update of October 2026, for AI investment, global capability centre employment, firm adoption and exposure of employment to AI;
- the RBI survey of software services exports for 2025-26;
- the Nasscom Strategic Review of February 2026 for the technology industry’s revenue and headcount.
4.2 Output per worker by sector
Gross value added per worker is calculated for six sectors by dividing MoSPI’s 2025-26 GVA at current prices by the number of workers in each sector, obtained by applying the PLFS 2025 employment shares to total employment. The sectors are matched as follows: agriculture; mining and utilities; manufacturing; construction; trade, hotels, transport and communication; and finance, real estate, IT, professional services, public administration and other services. The last group includes the imputed rent of owner-occupied dwellings, which inflates its measured value added per worker.
4.3 Reallocation gains
The gain from reallocating workers is estimated as the difference in value added per worker between the destination and origin sectors, multiplied by the number of workers moved, expressed as a share of total GVA. This static calculation assumes that the marginal productivity of workers who move equals the average productivity in each sector, which overstates the gain if the workers who move are less productive than the average.
4.4 AI exposure and scenarios
The number of workers exposed to AI is obtained by applying the World Bank’s exposure shares (22 percent highly exposed, of which 8 percent in roles with substitution risk and 14 percent in complementary roles) to total PLFS employment.
The potential macroeconomic gain from AI over ten years is calculated as the product of three factors: the share of output produced in exposed jobs, the share of exposed tasks where AI is actually adopted, and the average productivity gain on those tasks. The author assumes that exposed jobs account for about 35 percent of output, because they are concentrated in higher productivity services. Three scenarios combine adoption rates of 20, 40 and 60 percent with task productivity gains of 15, 25 and 35 percent.
4.5 Limitations
The matching of MoSPI and PLFS sectors is approximate, and the periods differ slightly (fiscal year 2025-26 for GVA, calendar year 2025 for employment). The exposure estimates are from a single source and depend on the methodology used to map occupations to tasks. The scenario parameters are assumptions informed by the literature, not estimates. The analysis does not account for general equilibrium effects, such as changes in prices, wages and the demand for Indian exports.
5. Results
5.1 Productivity gaps between sectors
Figure 1 shows gross value added per worker by sector in 2025-26.
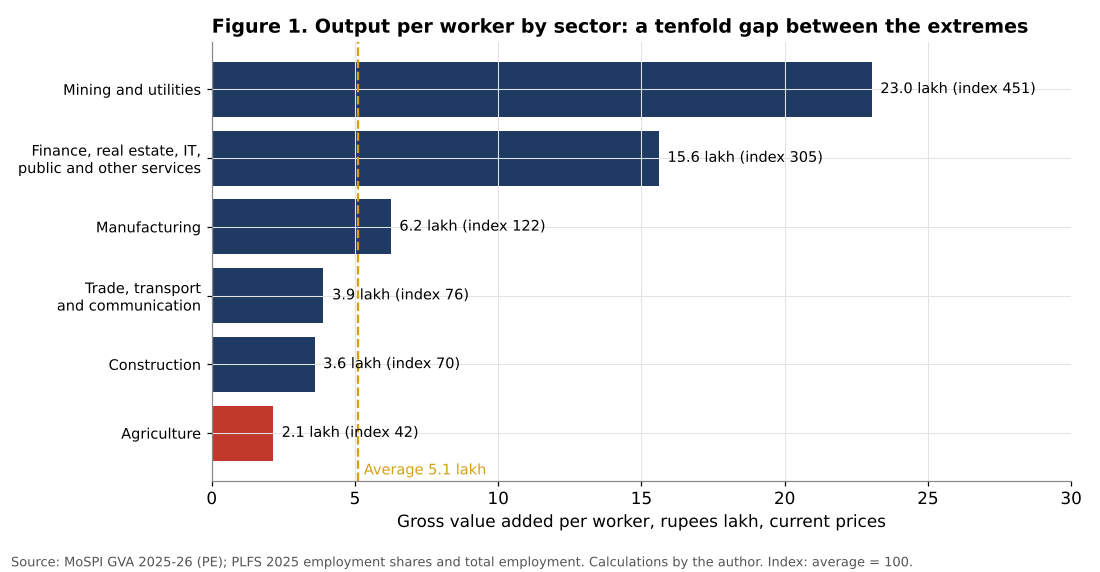
Average GVA per worker in India was about 5.1 lakh rupees in 2025-26 at current prices. Behind this average, the differences between sectors are very large. In agriculture, GVA per worker was about 2.1 lakh rupees, or 42 percent of the average. In construction, it was 3.6 lakh (70 percent of the average), and in trade, transport and communication 3.9 lakh (76 percent). Manufacturing was slightly above average, at 6.2 lakh (122 percent). The group of finance, real estate, IT, public and other services reached 15.6 lakh, three times the average, and mining and utilities, which employ very few workers, 23.0 lakh.
| Sector | GVA, 2025-26 (Rs lakh crore) | Share of GVA (%) | Share of employment (%) | GVA per worker (Rs lakh) | Index (average = 100) |
|---|---|---|---|---|---|
| Agriculture | 56.65 | 18.0 | 43.0 | 2.14 | 42 |
| Mining and utilities | 14.19 | 4.5 | 1.0 | 23.04 | 451 |
| Manufacturing | 46.62 | 14.8 | 12.1 | 6.25 | 122 |
| Construction | 26.55 | 8.4 | 12.0 | 3.59 | 70 |
| Trade, transport and communication | 44.92 | 14.3 | 18.7 | 3.90 | 76 |
| Finance, real estate, IT, public and other services | 125.93 | 40.0 | 13.1 | 15.61 | 305 |
| Total | 314.87 | 100 | 100 | 5.11 | 100 |
Table 1. Value added and employment by sector. Source: MoSPI, PLFS; calculations by the author.
A worker in modern services produces on average about seven times as much value as a worker in agriculture. Even manufacturing, often considered the engine of development, produces three times as much per worker as agriculture. These gaps reflect differences in capital, skills, technology and organisation, and they are much larger than in advanced economies, where productivity levels across sectors are more similar.
5.2 Where people work and where value is created
Figure 2 compares the shares of employment and of value added by sector.
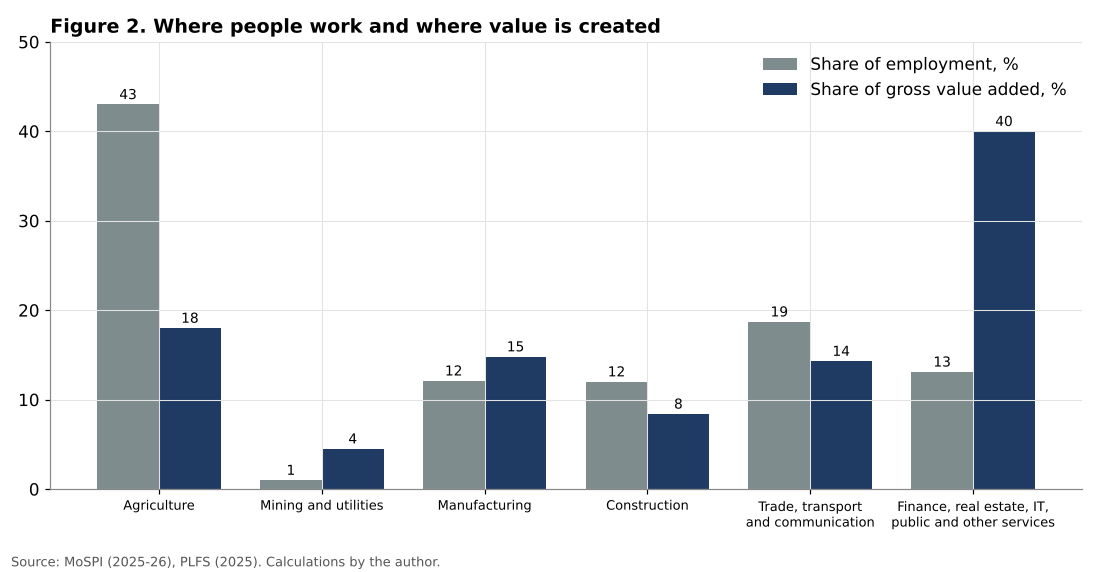
Agriculture accounts for 43 percent of employment but only 18 percent of value added. Construction and trade, transport and communication also have larger shares of employment than of value added. By contrast, the group of modern and public services accounts for 40 percent of value added but only 13 percent of employment.
This mismatch is the essence of India’s productivity challenge. The economy’s high-productivity sectors employ a small share of the workforce, while the low-productivity sectors employ the majority. The aggregate productivity of the economy can therefore increase in two ways: by raising productivity within each sector, or by moving workers from low to high productivity sectors.
The author’s calculation shows the size of the second channel. Moving 5 percent of the workforce, about 3.1 crore workers, from agriculture to manufacturing would raise aggregate GVA by about 4.0 percent, assuming they reach the average productivity of manufacturing. Moving the same number into construction would raise GVA by about 1.4 percent, and into trade and transport by about 1.7 percent. These are static gains: they would materialise over the years required to create the corresponding jobs. But they show that structural transformation remains a major source of potential productivity growth.
5.3 How many workers are exposed to AI?
Figure 3 shows the exposure of Indian employment to AI, based on the World Bank’s estimates.
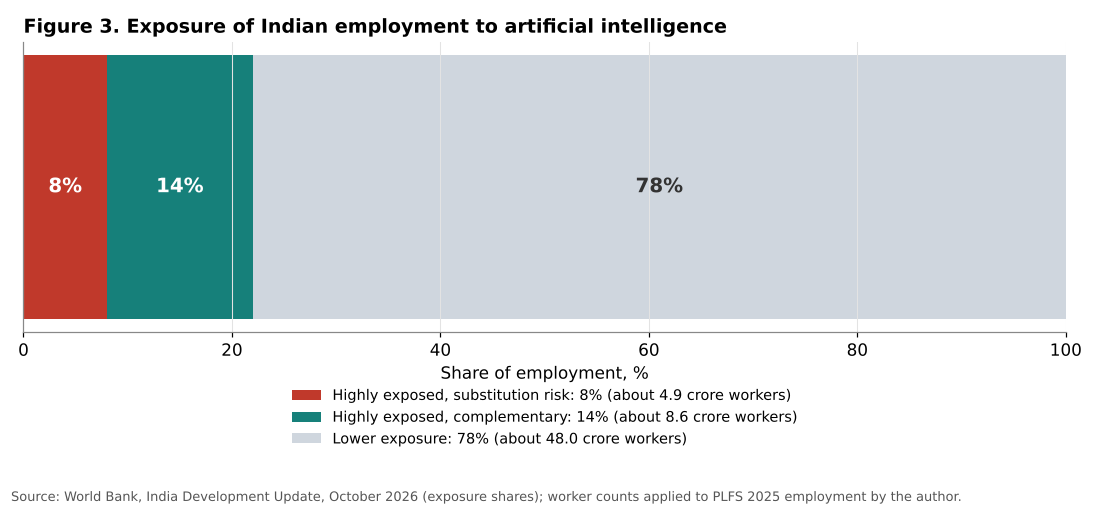
According to the World Bank, about 22 percent of employment in India is highly exposed to AI-related changes in tasks. Applied to the 61.6 crore workers estimated by the PLFS 2025, this corresponds to about 13.5 crore workers. Within this group, about 8 percent of total employment (about 4.9 crore workers) is in roles where AI may substitute for tasks, and about 14 percent (about 8.6 crore) is in roles where AI is more likely to assist workers and raise their productivity. The remaining 78 percent of employment, about 48 crore workers, has lower exposure.
The World Bank stresses that exposure does not mean job loss. It measures the potential for AI to change the tasks performed in a job, either by replacing some tasks or by helping workers perform them better. A World Bank Group Executive Director stated in October 2026 that only just over 4 percent of jobs in India were at risk of disruption, against mid-teens percentages in most developed markets.
The relatively low exposure of India compared with advanced economies is explained by the structure of employment. Agricultural, construction and manual service jobs, which make up the majority of Indian employment, are much less exposed to AI than office jobs. This is consistent with the IMF finding that exposure is lower in emerging and low-income economies. It means that the direct impact of AI on the Indian labour market, positive or negative, will be concentrated in a minority of jobs, mainly in formal services in urban areas.
5.4 Adoption by firms
The World Bank survey shows that about 23 percent of formal firms with at least five employees use some form of AI, which means that about three quarters do not. Adoption is concentrated among larger formal firms. Smaller informal firms, which employ the majority of non-agricultural workers in India, make limited use of AI. Only 39.4 percent of unincorporated non-agricultural establishments used the internet for business in 2025, according to data cited by the World Bank, which gives an idea of the distance that remains to be travelled before AI can be widely adopted by small businesses.
This uneven adoption has two implications. First, the productivity gains from AI are likely to be concentrated in the modern sector, which may widen the productivity gap between large and small firms. Second, policies that facilitate adoption by small firms, such as affordable tools in local languages, digital skills training and access to finance, could have large returns. The World Bank report highlights the potential of “small AI” applications adapted to low-resource settings, for example in agriculture, health and education.
5.5 The IT sector: output grows faster than jobs
Figure 4 shows the growth of revenue, headcount and revenue per employee in the Indian technology industry in 2025-26, and the destination of software services exports.
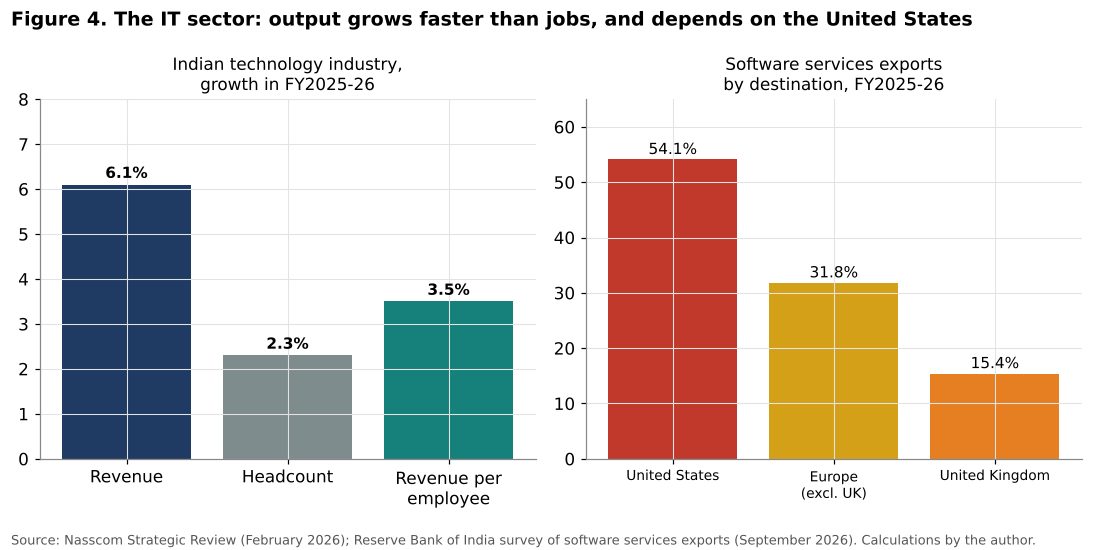
According to Nasscom, the revenue of the Indian technology industry rose by 6.1 percent in 2025-26, to US$315 billion, while the number of direct employees rose by only 2.3 percent, from 5.82 million to 5.95 million. Revenue per employee therefore increased by about 3.5 percent, from about US$51,100 to about US$52,900. Nasscom estimates that AI-related revenue was between US$10 and 12 billion, and that more than 2 million employees had been trained in AI skills, including up to 300,000 in advanced skills.
The decoupling of revenue and employment is a significant change for an industry that, for two decades, grew mainly by adding workers. The World Bank reports that, in a survey of 651 Indian IT firms, 55 percent reported lower entry-level hiring. This is consistent with the international evidence that generative AI can perform many of the tasks traditionally assigned to junior programmers and analysts.
| Indicator | 2024-25 | 2025-26 | Change |
|---|---|---|---|
| Technology industry revenue (US$ billion) | 297 | 315 | +6.1% |
| Direct employees (million) | 5.82 | 5.95 | +2.3% |
| Revenue per employee (US$ thousand) | 51.1 | 52.9 | +3.5% |
| Software services exports (US$ billion) | 204.6 | 221.4 | +8.2% |
Table 2. The Indian technology industry. Source: Nasscom, RBI; calculations by the author.
The concentration of exports on the United States, which accounts for 54.1 percent of software services exports, is a source of vulnerability. Changes in US policy on immigration, outsourcing or AI could have a significant impact on the sector.
5.6 The AI ecosystem
Figure 5 shows two indicators of the development of the AI ecosystem in India.
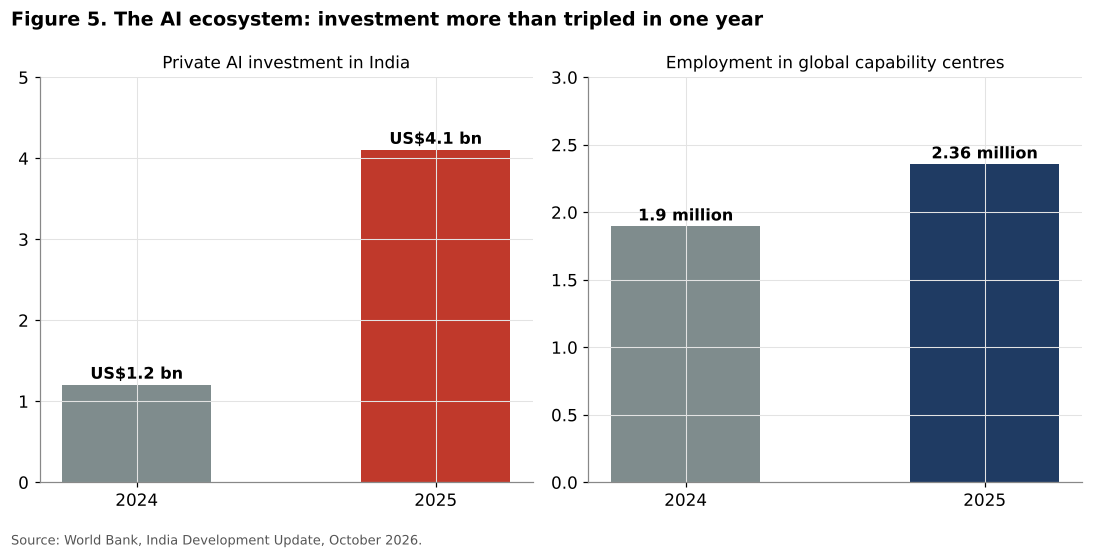
Private investment in AI rose from US$1.2 billion in 2024 to US$4.1 billion in 2025, a multiplication by 3.4. Employment in global capability centres rose by 24 percent in one year, from 1.9 million to 2.36 million. These centres, which perform technology, research, analytics and business functions for multinational companies, have become an important channel through which advanced capabilities, including in AI, are being developed in India.
These figures are impressive in terms of growth, but modest in absolute terms. Private AI investment of US$4.1 billion represents about 0.1 percent of India’s GDP and is small compared with investment in the United States or China. And the technology industry as a whole, with about 6 million direct employees, represents less than 1 percent of India’s 61.6 crore workers. The AI ecosystem is therefore a dynamic island in a much larger and less digitalised economy.
6. Discussion
6.1 AI and structural transformation
The main result of this analysis is that the potential productivity gains from AI in India, while real, are smaller than the gains from structural transformation. The author’s central scenario gives a gain of about 3.5 percent of GDP over ten years from AI, while moving 5 percent of the workforce from agriculture to manufacturing would raise value added by about 4 percent. Over the past two decades, India has moved more than 10 percentage points of its workforce out of agriculture, and it could do so again in the next decade if enough non-agricultural jobs are created.
This does not mean that AI is unimportant. AI and structural transformation are complements rather than substitutes. AI could raise productivity within modern services and manufacturing, making these sectors more competitive and enabling them to expand and absorb more workers. It could also raise productivity in agriculture through better information on weather, prices, soil and crop diseases. But the main lever for raising India’s average productivity remains the creation of jobs outside agriculture.
6.2 The risk to the entry-level model
The most immediate risk from AI in India concerns the entry-level jobs that have provided a path into the formal labour market for millions of educated young people. The IT and business services industries have absorbed large numbers of new graduates each year. If AI reduces the demand for junior staff, as the survey of IT firms suggests, this path will narrow at a time when, as shown in the previous article, unemployment among urban educated youth is already very high.
This risk requires an active response: retraining programmes, a shift of education toward skills that complement AI, such as problem solving, communication and domain knowledge, and the development of new types of jobs in AI-enabled services. The growth of global capability centres, which employ more skilled workers, shows that India can move up the value chain, but the number of jobs created at the top may be smaller than the number lost at the bottom.
6.3 Opportunities in public services
India’s digital public infrastructure offers a distinctive opportunity. AI applications built on this infrastructure could improve the delivery of public services at low cost: personalised education in local languages, assistance to health workers, advice to farmers, and simplification of administrative procedures. These applications could raise productivity in sectors that are difficult to reach through private markets, and they could benefit the large share of the population that works in the informal sector.
6.4 Lessons from earlier technology waves
Economic history offers a useful perspective on the likely timing of AI’s effects. David (1990), in a classic comparison between the electric dynamo and the computer, showed that the productivity gains from general purpose technologies often appear with a long delay, sometimes several decades, because firms must reorganise production, train workers and build complementary infrastructure before they can exploit the new technology fully. Electricity was introduced in American factories in the 1880s, but its main productivity effects appeared only in the 1920s, when factories were redesigned around electric motors. Similarly, the “productivity paradox” of the 1980s, when computers were everywhere except in the productivity statistics, gave way to a productivity boom in the United States in the late 1990s.
India’s own experience with the IT revolution illustrates both the opportunities and the limits of new technologies. The IT and business services sector became a world leader within two decades and created millions of well-paid jobs. But its direct share of employment remained small, below 1 percent of the workforce, and its spillovers to the rest of the economy, although real, did not trigger a broad structural transformation. A large part of the workforce remained in agriculture and informal services. The risk with AI is that history repeats itself: a dynamic, globally competitive AI sector coexisting with a large economy that benefits only marginally.
The lesson is that the gains from AI will depend less on the technology itself than on the complementary investments that firms, workers and the state make in organisation, skills and infrastructure. The scenarios presented in Section 7 should therefore be read as orders of magnitude that depend on these complementary investments, which take time.
6.5 Compute, energy and the physical side of AI
AI is often discussed as an intangible technology, but it has a significant physical dimension. Training and running AI models requires data centres, specialised chips, electricity and water. India has seen a wave of announcements of data centre investment by domestic and foreign firms, and the IndiaAI Mission has subsidised access to computing capacity for researchers and start-ups. The growth of data centres creates construction and engineering jobs and attracts investment, but it also increases electricity demand at a time when India’s energy system is under pressure from rising consumption and high fuel import costs. This link between AI and energy is one of the reasons why the next article in this series, on India’s energy dependence, matters for the country’s technological ambitions.
India also depends heavily on imports for the hardware that AI requires, notably advanced semiconductors. The government’s semiconductor programme aims to develop domestic capacity in chip assembly, testing and, eventually, fabrication, but this will take years. In the meantime, the cost and availability of imported hardware, which can be affected by export controls in producer countries, will shape the pace at which AI capacity can be built in India.
6.6 Policy implications
The analysis suggests the following priorities:
1. Structural transformation should remain the main productivity strategy, with AI as an accelerator rather than a replacement. 2. Adoption by small firms should be encouraged through affordable tools, training and digital connectivity. 3. Education and training should be adapted to prepare young people for jobs that complement AI, and programmes should support workers in exposed occupations. 4. AI applications in public services should be developed on the basis of the existing digital public infrastructure. 5. The regulatory framework should protect data security and privacy while allowing innovation, as recommended by the World Bank.
7. Scenarios
7.1 Three diffusion scenarios
Figure 6 presents three scenarios for the gain in the level of GDP from AI over ten years.
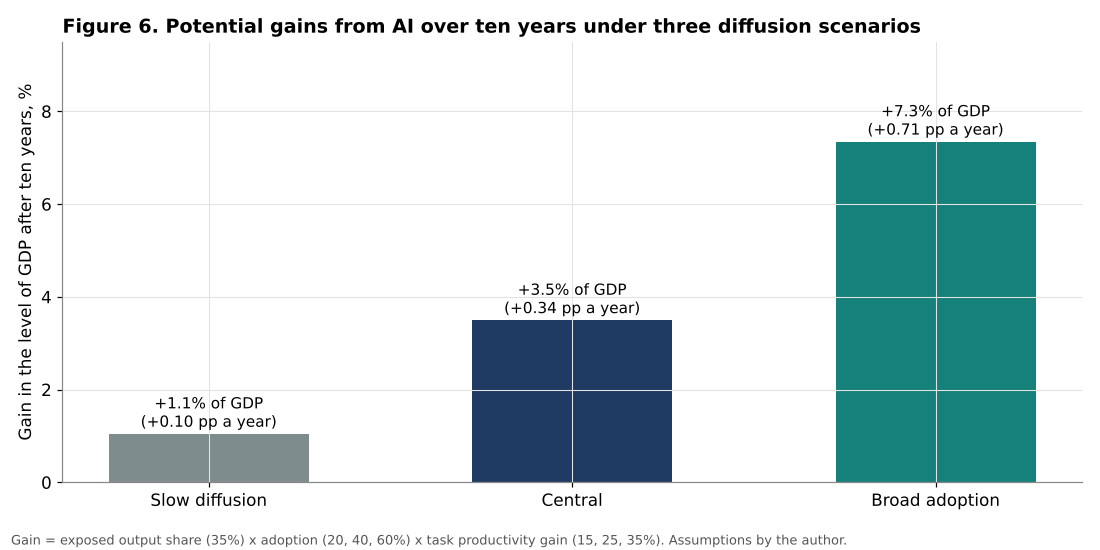
Slow diffusion. AI is adopted in 20 percent of exposed tasks, with an average productivity gain of 15 percent on those tasks. The gain in the level of GDP after ten years is about 1.0 percent, or 0.1 percentage point of growth per year. This scenario corresponds to a situation in which adoption remains concentrated in large firms and the IT sector, and in which complementary investments in skills and organisation lag.
Central. Adoption reaches 40 percent of exposed tasks, with a productivity gain of 25 percent. The GDP gain is about 3.5 percent over ten years, or 0.34 percentage point per year. This is broadly consistent with the more optimistic estimates in the international literature and with the task-level evidence of Brynjolfsson, Li and Raymond (2023).
Broad adoption. Adoption reaches 60 percent of exposed tasks, with a productivity gain of 35 percent. The GDP gain reaches about 7.4 percent after ten years, or about 0.7 percentage point of growth per year. This scenario requires rapid adoption across the economy, including by small firms and the public sector, and large complementary investments.
7.2 Interpretation
Even in the broad adoption scenario, AI adds less than one percentage point to India’s annual growth. In the central scenario, it adds about a third of a point. This is significant, since India’s growth rate is about 7 percent, but it is not transformative on its own. The larger gains would come from the interaction between AI and structural transformation: if AI makes manufacturing and services more competitive, allowing them to absorb more workers from agriculture, the indirect gains could exceed the direct ones.
The scenarios also do not account for the distribution of gains. In all scenarios, the gains are likely to be concentrated in the formal, urban, skilled part of the economy, which could increase inequality unless policies ensure broader access.
7.3 Sensitivity to the exposed output share
The most uncertain parameter in the scenarios is the share of output produced in exposed jobs, set at 35 percent. Exposed jobs represent 22 percent of employment, but they are concentrated in higher productivity services, so their share of output is higher than their share of employment. If this share were only 25 percent, the central scenario would give a GDP gain of about 2.5 percent over ten years instead of 3.5 percent. If it were 45 percent, the gain would be about 4.5 percent. The range across the three scenarios and these two variants therefore extends from less than 1 percent to more than 9 percent of GDP over ten years. The central message is robust to these variations: AI can add between a tenth and a little under a full percentage point to annual growth, but it is not on its own a source of growth comparable to the 7 percent that India already achieves.
7.4 Indicators to monitor
The author suggests monitoring:
1. The share of firms using AI, by size and sector, in future World Bank and government surveys. 2. Revenue per employee and entry-level hiring in the IT sector. 3. Employment in global capability centres. 4. Private AI investment. 5. The share of employment in agriculture, as the main indicator of structural transformation.
8. Conclusion
India has real strengths in the AI era: a large technical workforce, a globally integrated IT sector, digital public infrastructure and a rapidly growing AI ecosystem. But the analysis shows that the impact of AI on Indian productivity must be put in perspective:
1. India’s main productivity problem is structural. Agriculture employs 43 percent of workers with value added per worker of about 2.1 lakh rupees, about one seventh of the level in modern services. 2. Moving 5 percent of the workforce from agriculture to manufacturing would raise value added by about 4 percent, more than the central estimate of the gain from AI over ten years. 3. About 22 percent of employment, roughly 13.5 crore workers, is highly exposed to AI, of which 14 percent in complementary roles. The share at risk of displacement is lower than in advanced economies. 4. In the IT sector, output is growing faster than employment, and entry-level hiring is falling, which threatens a key path into formal jobs for educated young people. 5. AI could add between 0.1 and 0.7 percentage point to annual growth over the next decade, depending on the speed and breadth of adoption.
AI is therefore an opportunity for India, but not a substitute for the creation of productive jobs for the hundreds of millions of workers who remain in low-productivity activities. The best strategy combines the promotion of AI in modern sectors with a determined effort to accelerate structural transformation.
Need this analysis for your organisation?
We prepare confidential briefings, executive talks and studies on countries, markets and policies, built on the same method as this article.
Request a briefingSupport independent analysis
Our studies are free to read and carry no advertising. If this one was useful, a small contribution helps us publish the next.
Support our workGo further: books by Global Strategy Files

Frequently asked questions
How much could artificial intelligence raise productivity in India?
The central estimate in this analysis is a gain of about 3.5 percent of value added over ten years, or a few tenths of a percentage point of growth a year. That is less than the roughly 4 percent gain from moving 5 percent of workers from agriculture to manufacturing.
How many Indian workers are exposed to AI?
About 22 percent of Indian employment, roughly 13.5 crore workers, is highly exposed to artificial intelligence. Of this, 14 percent of employment is in roles where AI is more likely to complement than replace workers.
Is AI affecting jobs in India’s IT sector?
There are early signs. In 2025-26 the revenue of India’s technology industry grew by 6.1 percent while its headcount rose by only 2.3 percent, suggesting output is starting to grow faster than employment, with risks for entry-level jobs.
What is India’s main productivity problem?
India’s main productivity problem is structural. Agriculture employs 43 percent of workers but produces only about 2.1 lakh rupees of value added per worker, against 6.2 lakh in manufacturing and 15.6 lakh in modern services, a gap of one to seven.
Methodological note
All calculations were carried out by the author. GVA data are MoSPI provisional estimates for 2025-26 at current prices. Employment data are from the PLFS Annual Report 2025. Sector matching is approximate. AI exposure shares and ecosystem indicators are from the World Bank India Development Update of October 2026. IT sector data are from Nasscom and the RBI. The AI gain scenarios use a simple task-based framework with assumptions stated in Section 4.4.
References
Acemoglu, D. (2024). The Simple Macroeconomics of AI. NBER Working Paper 32487.
Brynjolfsson, E., Li, D. and Raymond, L. R. (2023). Generative AI at Work. NBER Working Paper 31161.
Cazzaniga, M., Jaumotte, F., Li, L., Melina, G., Panton, A. J., Pizzinelli, C., Rockall, E. and Tavares, M. M. (2024). Gen-AI: Artificial Intelligence and the Future of Work. IMF Staff Discussion Note SDN/2024/001.
David, P. A. (1990). The Dynamo and the Computer: An Historical Perspective on the Modern Productivity Paradox. American Economic Review, 80(2), 355 to 361.
Eloundou, T., Manning, S., Mishkin, P. and Rock, D. (2023). GPTs are GPTs: An Early Look at the Labor Market Impact Potential of Large Language Models. arXiv 2303.10130.
McMillan, M. and Rodrik, D. (2011). Globalization, Structural Change and Productivity Growth. NBER Working Paper 17143.
Ministry of Statistics and Programme Implementation (2026). Press Note on Provisional Estimates of Annual GDP for 2025-26. New Delhi.
Ministry of Statistics and Programme Implementation (2026). Periodic Labour Force Survey Annual Report 2025. New Delhi.
Nasscom (2026). Strategic Review 2026: Technology Sector in India. New Delhi.
Noy, S. and Zhang, W. (2023). Experimental Evidence on the Productivity Effects of Generative Artificial Intelligence. Science, 381(6654), 187 to 192.
Peng, S., Kalliamvakou, E., Cihon, P. and Demirer, M. (2023). The Impact of AI on Developer Productivity: Evidence from GitHub Copilot. arXiv 2302.06590.
Reserve Bank of India (2026). Survey on Computer Software and Information Technology Enabled Services Exports: 2025-26. Mumbai.
Reserve Bank of India (2024). India KLEMS Database. Mumbai.
Rodrik, D. (2016). Premature Deindustrialization. Journal of Economic Growth, 21(1), 1 to 33.
World Bank (2026). India Development Update, October 2026: India and Artificial Intelligence: Seizing the Development Opportunity. Washington, DC.
