
The Bank of England’s Inflation and Growth Dilemma in 2026: How to Contain an Energy Shock Without Choking Investment and Consumption

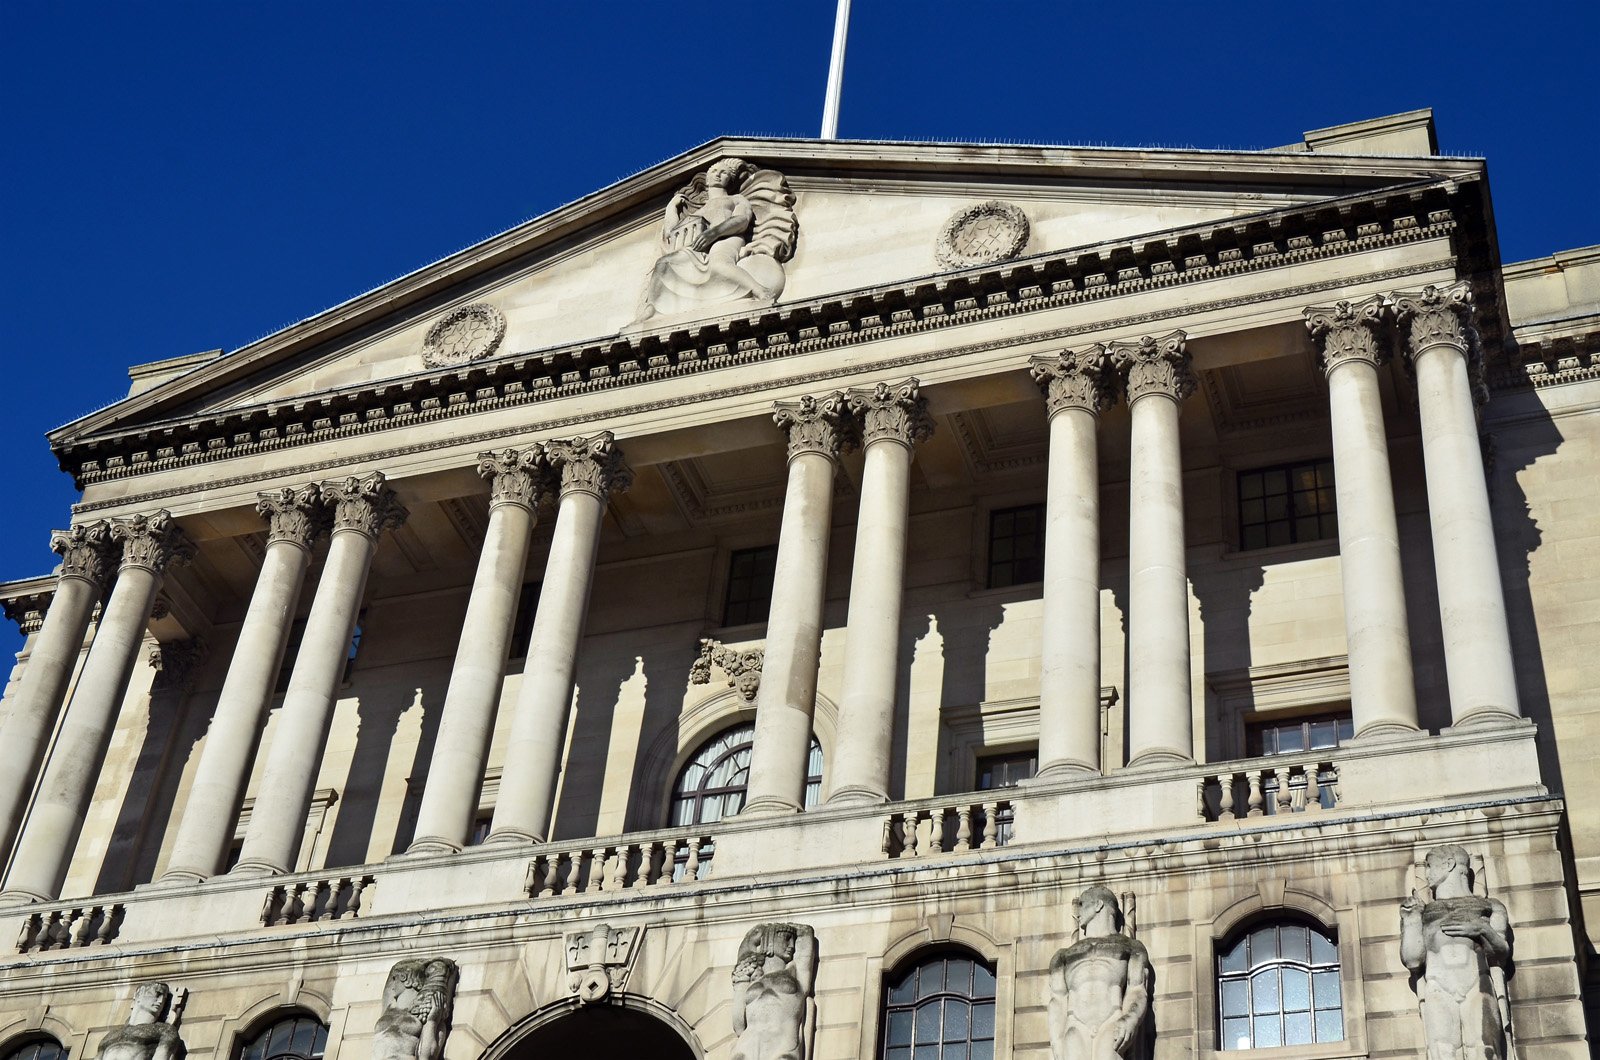
The Bank of England’s Inflation and Growth Dilemma in 2026: How to Contain an Energy Shock Without Choking Investment and Consumption
Driss EFFINA, PhD Independent Researcher, Global Strategy Files Reading time: about 27 minutes
Key takeaways
- The Bank of England held Bank Rate at 3.75 percent on 17 September 2026 by six votes to three, with three members favouring 4 percent.
- Brent crude reached about US$106 a barrel and UK wholesale gas prices rose about 78 percent since July 2026.
- Against core inflation of 2.6 percent, a simple policy rule justifies a Bank Rate between 2.9 and 3.9 percent.
- Against projected inflation of about 4 percent in early 2027, Bank Rate is roughly zero in real terms and the rule points above 5 percent.
Abstract
On 17 September 2026, the Monetary Policy Committee (MPC) of the Bank of England kept Bank Rate at 3.75 percent by a vote of six to three, with three members preferring an increase to 4 percent. Nine months earlier, in December 2025, the Committee had cut the rate by a vote of five to four. In the space of a year, the debate inside the MPC has moved from how fast to ease to whether to tighten. This article analyses the dilemma that explains this shift: an energy price shock linked to the conflict in the Middle East, which has pushed Brent crude to about US$106 a barrel and UK wholesale gas prices up by about 78 percent since July, is raising inflation at a time when the economy has spare capacity, unemployment is close to 5 percent and private sector wage growth has slowed below 3 percent. Using data from the Office for National Statistics (ONS) and the Bank of England, the author builds four original indicators: a decomposition of the inflation overshoot, the real Bank Rate under five different measures of inflation, a Taylor-type policy rule evaluated under those same measures, and an estimate of the direct sensitivity of consumer prices to oil prices. The results show that the stance of policy depends entirely on which inflation the Committee chooses to look at. Measured against core inflation of 2.6 percent, a Bank Rate of 3.75 percent is moderately restrictive, and a simple rule would justify a rate between 2.9 and 3.9 percent. Measured against projected inflation of about 4 percent in early 2027, the same Bank Rate is roughly zero in real terms, and the rule points to a rate above 5 percent. The author argues that the dilemma is less about the level of Bank Rate than about the risk of second-round effects, and that the most informative indicators in the coming months will be services inflation, wage settlements and household inflation expectations rather than the headline rate itself.
Keywords: United Kingdom, Bank of England, monetary policy, inflation, energy prices, oil shock, second-round effects, Taylor rule, real interest rate, quantitative tightening
JEL codes: E31, E43, E52, E58, Q43
1. Introduction
Every central bank faced with an energy price shock confronts the same question. A rise in oil and gas prices increases inflation immediately, but it also reduces the real income of households and the profits of energy-using firms, which slows the economy. If the central bank raises interest rates to counter the rise in inflation, it adds a second negative shock to activity. If it does nothing, it risks allowing the initial rise in prices to turn into a lasting rise in wages and prices, which would be more costly to reverse later.
The textbook answer is that monetary policy should “look through” the first-round effects of an energy shock, because they are temporary and outside its control, but respond firmly to second-round effects, when higher energy costs feed into wages, services prices and expectations. The difficulty, in practice, is to know in real time which of the two is happening. The experience of 2021 to 2023, when most central banks, including the Bank of England, first described the rise in inflation as transitory before having to raise rates rapidly, has made this distinction politically and intellectually sensitive.
The United Kingdom in 2026 is a near perfect case study of this dilemma. After a long easing cycle that brought Bank Rate down from 5.25 percent in mid-2024 to 3.75 percent in December 2025, the MPC was preparing in early 2026 to continue cutting. In February 2026, four of the nine members voted for a further reduction. Then the conflict in the Middle East escalated, oil and gas prices rose sharply, and the debate turned around. By July and September 2026, no member was voting for a cut, and three were voting for an increase.
This article analyses the situation using official data. It asks four questions. How large is the inflation shock, and how much of it comes from energy? How restrictive is monetary policy at a Bank Rate of 3.75 percent? What would a systematic policy rule recommend? And what are the plausible paths for Bank Rate in 2027?
Section 2 describes the context. Section 3 reviews the literature on oil shocks and monetary policy. Section 4 sets out the data and methods. Section 5 presents the results. Section 6 discusses them. Section 7 presents scenarios. Section 8 concludes.
2. Context
2.1 The easing cycle of 2024 and 2025
The Bank of England raised Bank Rate fourteen times between December 2021 and August 2023, from 0.1 percent to 5.25 percent, in response to an inflation rate that peaked at 11.1 percent in October 2022. It held the rate at 5.25 percent for a year, then began to cut in August 2024, when inflation had fallen to around 2 percent.
The easing was gradual. Bank Rate was reduced to 5 percent in August 2024, 4.75 percent in November 2024, 4.5 percent in February 2025, 4.25 percent in May 2025, 4 percent in August 2025, and 3.75 percent in December 2025. Each cut was a quarter point, and several were decided by narrow majorities. The December 2025 cut was approved by five votes to four, with Governor Andrew Bailey changing his position to support it.
During this period, CPI inflation did not return smoothly to target. After falling to 1.7 percent in September 2024, it rose again to 3.8 percent in July, August and September 2025, partly because of increases in regulated prices, utility bills and some taxes introduced in April 2025. It then eased to 3.0 percent in January and February 2026. In February 2026, the MPC held Bank Rate at 3.75 percent by five votes to four, with four members voting for a cut, and the Governor said there should be scope for further reductions during the year.
2.2 The energy shock of 2026
The escalation of the conflict in the Middle East in 2026 changed the outlook. The Bank of England’s Monetary Policy Reports trace the movement of oil prices: Brent crude averaged about US$64 a barrel before the February 2026 Report, about US$100 before the April Report, and about US$78 before the July Report, after a temporary easing. Between the July Report and mid-September, spot Brent rose by about 36 percent, reaching US$106 a barrel on 14 September, while UK wholesale gas prices rose by about 78 percent to 207 pence per therm.
For households, the shock arrives through two channels. Motor fuel prices react within weeks: in August 2026, the average price of petrol reached 161.3 pence per litre, the highest since November 2022, and diesel 181.8 pence. Household gas and electricity bills react with a lag through the Ofgem price cap, which is set quarterly. The cap for a typical dual fuel household rose from £1,477 a year in the second quarter of 2026 to £1,663 in the third quarter and £1,723 for October to December 2026, and the Bank expects a further substantial rise in early 2027.
2.3 The September 2026 decision
In the minutes of its September meeting, the MPC recorded that CPI inflation had risen to 3.1 percent in August, of which about 0.7 percentage points of the 1.1 point overshoot came from direct energy effects, mainly motor fuels. It now expected inflation to reach about 3¾ percent in the fourth quarter of 2026 and slightly above 4 percent in the first quarter of 2027, against 3.2 percent in its July projection.
At the same time, the domestic economy showed signs of spare capacity. Unemployment was 4.9 percent in the three months to July. Private sector regular pay growth had slowed to 2.9 percent, from 3.3 percent at the start of the year. Services inflation had fallen from 4.5 percent in March to 3.4 percent in August. GDP grew by 0.4 percent in the second quarter, but business surveys pointed to weaker growth.
Six members voted to keep Bank Rate unchanged. Among them, the Governor and Deputy Governors Sarah Breeden and Clare Lombardelli indicated that a tightening was likely if the conflict persisted or if second-round effects appeared. Swati Dhingra and Alan Taylor placed more weight on slack and on the already restrictive level of Bank Rate. Three members, Megan Greene, Catherine Mann and Huw Pill, voted for an increase, arguing that waiting for definitive evidence would leave policy behind the curve.
The Committee also decided unanimously to continue reducing its stock of government bonds, with active sales of £20 billion a year in addition to maturing bonds. The stock held in the Asset Purchase Facility had fallen to £488 billion, from a peak of £895 billion in February 2022.
3. Literature review
The economic literature on oil price shocks and monetary policy is extensive. Four contributions are particularly relevant.
Bernanke, Gertler and Watson (1997) argued that a substantial part of the recessions that followed the oil shocks of the 1970s and 1980s in the United States was due not to the oil shocks themselves but to the monetary tightening that followed them. Their work suggested that central banks could reduce the output cost of oil shocks by not responding too aggressively. Later research questioned the size of this effect, but the idea that monetary policy can amplify energy shocks remains influential.
Blanchard and Galí (2007, published 2010) asked why the oil price increases of the 2000s had much smaller effects on inflation and output than those of the 1970s. They identified three explanations: the smaller share of oil in production and consumption, more flexible labour markets with weaker wage indexation, and greater credibility of monetary policy, which anchored inflation expectations. All three factors reduce second-round effects. Their analysis implies that the appropriate response to an oil shock depends on the institutional context, and in particular on the degree to which wages respond to prices.
Kilian (2009) showed that “not all oil price shocks are alike”. Increases in oil prices driven by global demand have different effects from those driven by supply disruptions. Supply shocks, such as a conflict that disrupts production or transport, raise prices while depressing global activity, which corresponds to the situation of 2026.
Bernanke and Blanchard (2023), studying the inflation episode of 2021 to 2023 in the United States, found that the initial increase in inflation came mainly from price shocks in energy, food and specific sectors, while the persistence of inflation depended on labour market tightness. A follow-up study by the same authors covering eleven economies, including the United Kingdom (Bernanke and Blanchard, 2024), confirmed that energy and food price shocks drove the initial surge almost everywhere, while the persistence of inflation varied with labour market conditions.
The question of policy rules is also relevant. Taylor (1993) proposed a simple rule linking the policy rate to inflation and the output gap. Orphanides (2003) showed that rules are sensitive to real time data and to the choice of measures. The Bank of England itself publishes the prescriptions of illustrative policy rules in its Monetary Policy Reports, following the recommendations of the review of its forecasting and communication conducted by Ben Bernanke in 2024.
The present article contributes to this literature by showing, with UK data for 2026, how the prescription of a simple rule depends on the measure of inflation chosen, and by relating this to the divisions within the MPC.
4. Data and methodology
4.1 Data
The data come from:
- the ONS consumer price inflation bulletin for August 2026, which gives the 12-month rates for CPI, CPIH, goods, services, core inflation and the main divisions, as well as average petrol and diesel prices;
- the Bank of England Monetary Policy Summary and minutes of the meeting ending 16 September 2026;
- the Bank of England Monetary Policy Report of July 2026, for conditioning assumptions on energy prices, the output gap and the central projection;
- the Bank of England’s record of Bank Rate decisions and votes;
- Ofgem price cap levels as reported by the Bank of England.
4.2 Decomposition of the inflation overshoot
The overshoot is the difference between CPI inflation (3.1 percent in August 2026) and the 2 percent target. The Bank of England estimates that direct energy effects account for about 0.7 percentage points of this overshoot. The remainder, about 0.4 points, comes from other components.
4.3 Real Bank Rate
The real Bank Rate is computed as Bank Rate (3.75 percent) minus five different measures of inflation: headline CPI in August 2026 (3.1 percent), core CPI excluding energy, food, alcohol and tobacco (2.6 percent), services CPI (3.4 percent), the MPC’s expectation for the fourth quarter of 2026 (about 3.75 percent) and its expectation for the first quarter of 2027 (slightly above 4 percent, taken as 4.05 percent). The first three are backward looking; the last two are forward looking and closer to the concept of an ex ante real interest rate.
4.4 Policy rule
The author uses a Taylor-type rule:
Rule rate = r + π + 0.5 × (π – 2) + 0.5 × output gap*
where r* is the neutral real interest rate, π is the inflation measure and the output gap is taken as -1 percent of potential GDP, in line with the July 2026 Monetary Policy Report, which noted that most model-based estimates place the output gap at around 1 percent. The neutral real rate is uncertain; the author uses three values, 0.5, 1.0 and 1.5 percent, to produce a range. The rule is evaluated for the five inflation measures listed above.
4.5 Oil price sensitivity
The author estimates the implied weight of motor fuels in the CPI by dividing the Bank’s estimate of the direct energy contribution (0.7 points) by the annual rise in motor fuel prices (23.0 percent), which gives about 3 percent. This simple calculation ignores the smaller contribution of household energy, but gives an order of magnitude. The author also estimates the share of crude oil in the retail price of petrol, converting the price of Brent into pence per litre (one barrel contains about 159 litres) with an assumed exchange rate of US$1.30 per pound.
4.6 Limitations
The neutral rate and the output gap are not observable. Projections of inflation are those of the MPC at the time of the September meeting and may be revised in the November 2026 Monetary Policy Report. The decomposition of the overshoot relies on the Bank’s own estimate. The exchange rate assumption is approximate. The scenarios are illustrative.
5. Results
5.1 The path of rates and inflation
Figure 1 shows Bank Rate and CPI inflation from January 2024 to August 2026.
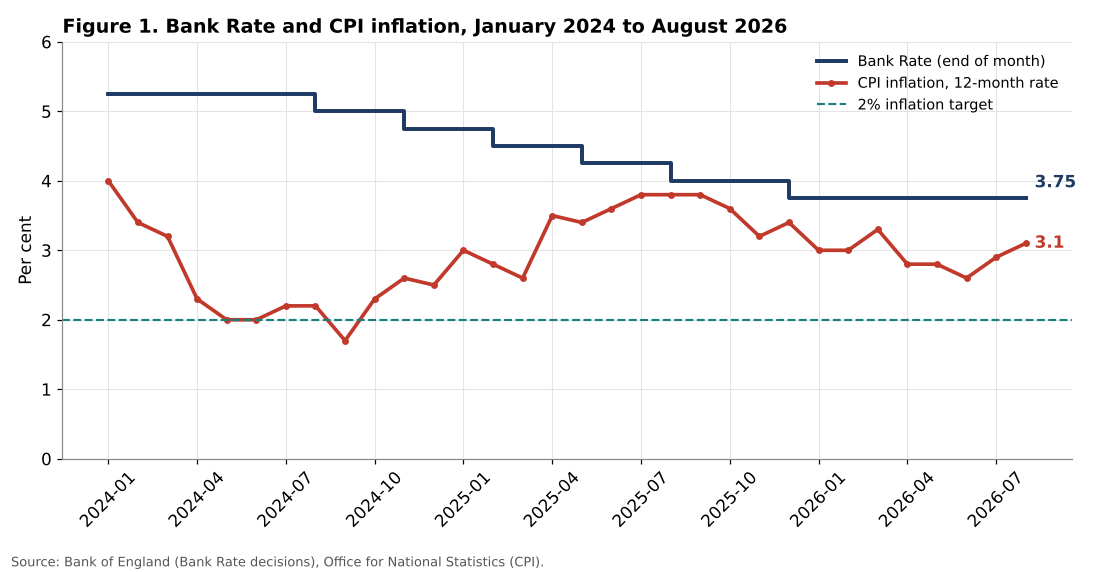
Three features stand out. First, inflation in the United Kingdom has been above the 2 percent target for most of the period: it was close to or below target only between May and September 2024. Second, the easing of Bank Rate continued in 2025 even though inflation rose back to 3.8 percent during the summer. The MPC justified these cuts by the view that the rise in inflation in 2025 reflected temporary factors, notably regulated prices and indirect taxes, and that underlying pressures in wages and services were easing. Third, since December 2025, Bank Rate has been unchanged at 3.75 percent, while inflation has first fallen to 2.6 percent in June 2026 and then risen again to 3.1 percent in August.
| Month | CPI | CPIH |
|---|---|---|
| Aug 2025 | 3.8 | 4.1 |
| Nov 2025 | 3.2 | 3.5 |
| Feb 2026 | 3.0 | 3.2 |
| Apr 2026 | 2.8 | 3.0 |
| Jun 2026 | 2.6 | 2.8 |
| Jul 2026 | 2.9 | 3.1 |
| Aug 2026 | 3.1 | 3.3 |
Table 1. CPI and CPIH, 12-month rates, percent. Source: ONS.
The trough of June 2026 is significant. Without the energy shock, inflation would probably have continued to fall toward target in the second half of 2026, as the MPC expected in February. The reversal since June is almost entirely due to energy.
5.2 Anatomy of the August 2026 inflation rate
Figure 2 shows the 12-month rates of the main components of the CPI in August 2026, and the decomposition of the overshoot.
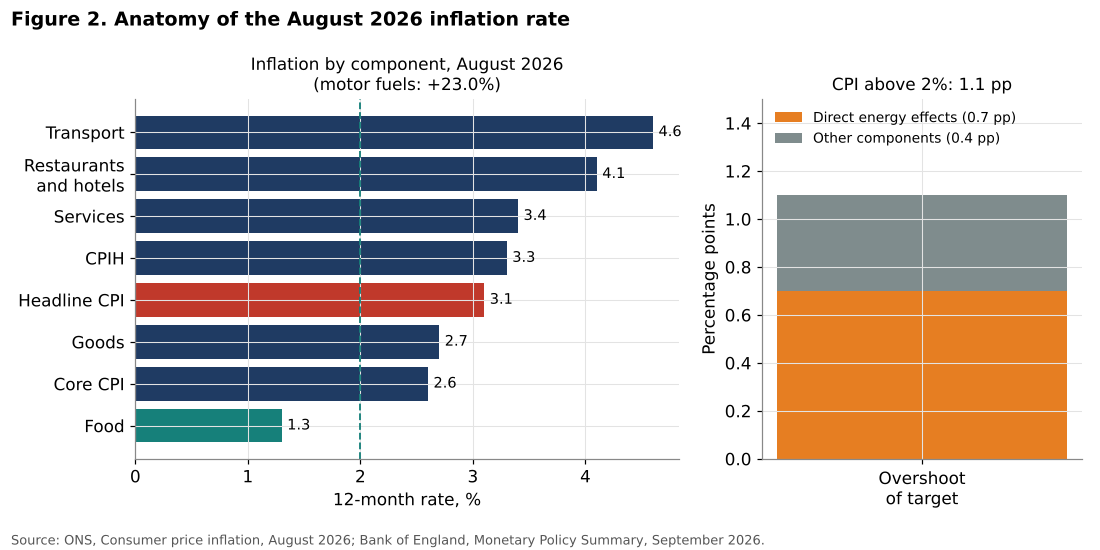
The composition of inflation is unusual. The components most directly affected by the energy shock are rising rapidly: motor fuels increased by 23.0 percent over the year, and transport as a whole by 4.6 percent, making transport the largest single contributor to the annual rate, at 0.69 percentage points. Housing and household services, which include energy bills and rents, rose by 4.9 percent in the CPI.
But many other components are moderate or weak. Core CPI, excluding energy, food, alcohol and tobacco, was 2.6 percent, unchanged from July. Food inflation fell to 1.3 percent, its lowest rate since 2021, with a contribution to the annual rate of only 0.11 points, against 0.46 points a year earlier. Goods inflation excluding the effect of fuel remains low. Services inflation, the measure most closely watched by the MPC as an indicator of domestic pressure, was 3.4 percent, unchanged from July and down from 4.5 percent in March.
The decomposition of the overshoot confirms this picture. Of the 1.1 percentage points by which inflation exceeds the target, about 0.7 points come from direct energy effects and only 0.4 points from all other components combined. In other words, about two thirds of the overshoot is energy, and the non-energy part of inflation is close to target.
This is the first element of the dilemma. If the MPC looks at core or services inflation, the case for raising rates is weak. If it looks at headline inflation and its projected path, the case is stronger.
5.3 The size of the energy shock
Figure 3 shows the evolution of oil prices and the Ofgem price cap in 2026.
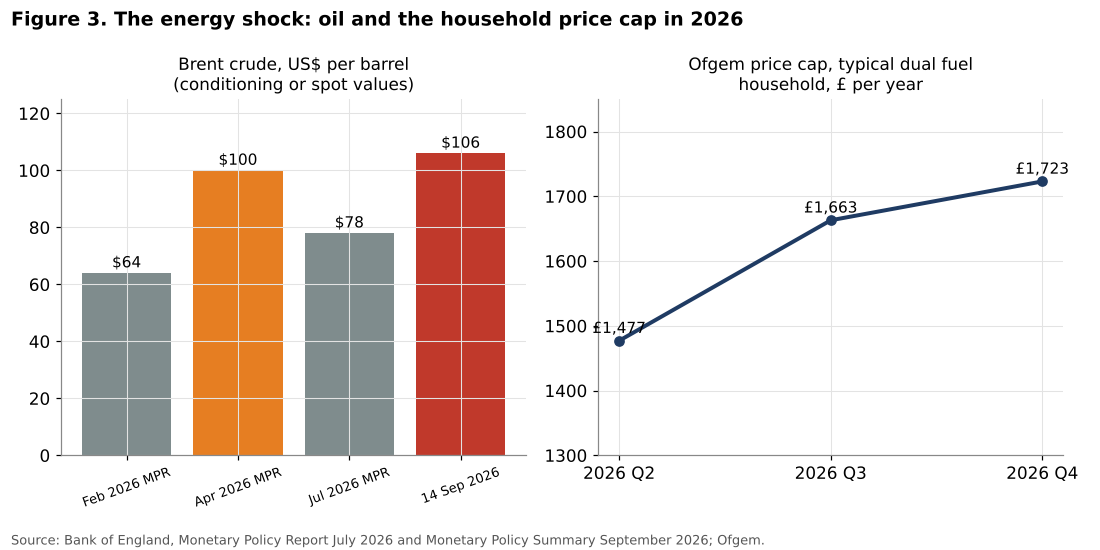
The oil price has been very volatile. It rose from about US$64 a barrel at the start of the year to about US$100 in the spring, fell back to about US$78 in July, and then rose again to about US$106 in mid-September. The rise between the July and September observations is about 36 percent.
The household energy price cap rose by about 16.7 percent between the second and fourth quarters of 2026, from £1,477 to £1,723 a year for a typical household. The Bank expects a further large increase at the start of 2027, as the cap reflects wholesale prices with a lag of several months. Since wholesale gas prices rose by about 78 percent between July and September, the increase in January 2027 could be significant.
The author’s calculation of the share of crude oil in the price of petrol gives a useful order of magnitude. At US$106 a barrel and an exchange rate of about US$1.30 per pound, a litre of crude oil costs about 51 pence, which is about 32 percent of the average retail price of petrol in August 2026. The remainder consists of fuel duty, VAT, refining and distribution margins. This means that a 10 percent increase in the price of crude oil raises the retail price of petrol by about 3 percent, other things being equal. With an implied weight of motor fuels in the CPI of about 3 percent, a 10 percent rise in crude oil prices adds roughly 0.1 percentage point to CPI inflation through fuel prices alone, before any effect on household energy bills or indirect effects on transport and goods prices.
This calculation shows that the direct effect of oil is real but limited. The main risk lies in the indirect effects, through transport costs, food production, and energy-intensive industries, and in the effects on gas and electricity bills, which are larger in the United Kingdom than in many other economies because of the role of gas in electricity generation. The Bank of England’s July Report estimated that indirect effects would add about 0.5 percentage points to CPI by December 2026. In September, the Committee noted that these indirect effects had so far been weaker than expected, especially for food, but judged that they may have been delayed rather than avoided.
5.4 How restrictive is Bank Rate?
Figure 4 shows the real Bank Rate calculated with five measures of inflation.
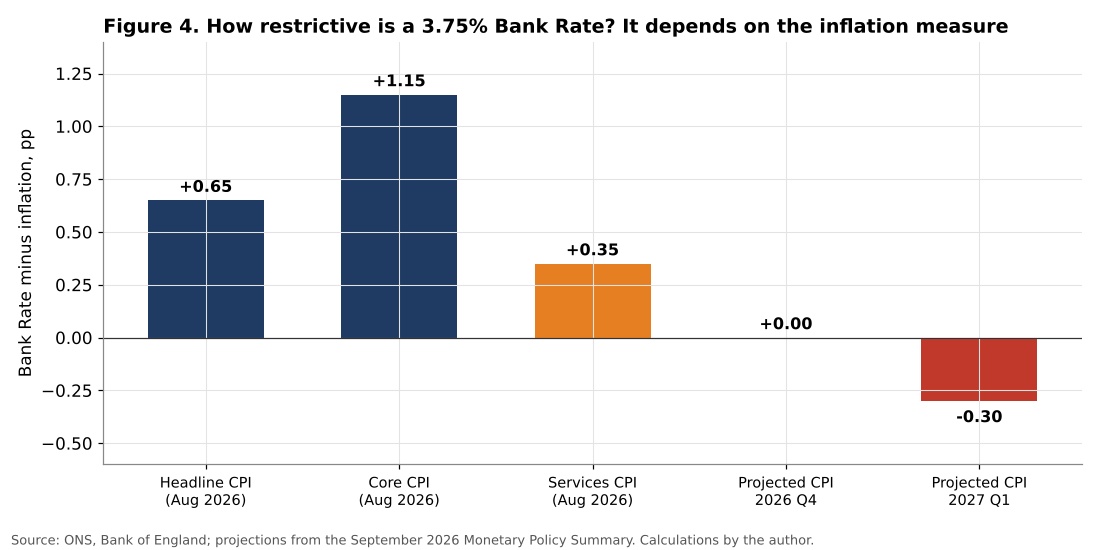
The results vary considerably:
| Inflation measure | Value (%) | Real Bank Rate (pp) |
|---|---|---|
| Core CPI, August 2026 | 2.6 | +1.15 |
| Headline CPI, August 2026 | 3.1 | +0.65 |
| Services CPI, August 2026 | 3.4 | +0.35 |
| Projected CPI, 2026 Q4 | 3.75 | 0.00 |
| Projected CPI, 2027 Q1 | 4.05 | -0.30 |
Table 2. Real Bank Rate under five measures of inflation. Source: ONS, Bank of England; calculations by the author.
Against core inflation, the real Bank Rate is about 1.15 percentage points, which is moderately restrictive if the neutral real rate is around 0.5 to 1 percent. Against headline inflation, it is about 0.65 points, roughly neutral. Against the inflation expected in the coming two quarters, it is close to zero or slightly negative.
This illustrates the second element of the dilemma. The same Bank Rate can be described as restrictive or as accommodative depending on the time horizon chosen. The members who voted for a hold emphasise that monetary policy acts with long lags, so that what matters is inflation in 18 to 24 months, by which time the energy shock may have faded. The members who voted for an increase emphasise that if households and firms come to expect inflation of 4 percent, a nominal rate of 3.75 percent would be expansionary in real terms.
A further consideration is the behaviour of market interest rates. The minutes note that the two-year fixed mortgage rate is about 95 basis points higher than before the conflict, and that the market curve for short-term rates rises to about 4.9 percent by the end of 2027. In other words, financial conditions have tightened without any change in Bank Rate, because markets anticipate future increases. Some members consider that this tightening does part of the work of monetary policy; others, such as Megan Greene, argue that risk premia cannot substitute for policy.
5.5 What would a simple rule recommend?
Figure 5 shows the range of Bank Rate implied by the Taylor-type rule for each measure of inflation.
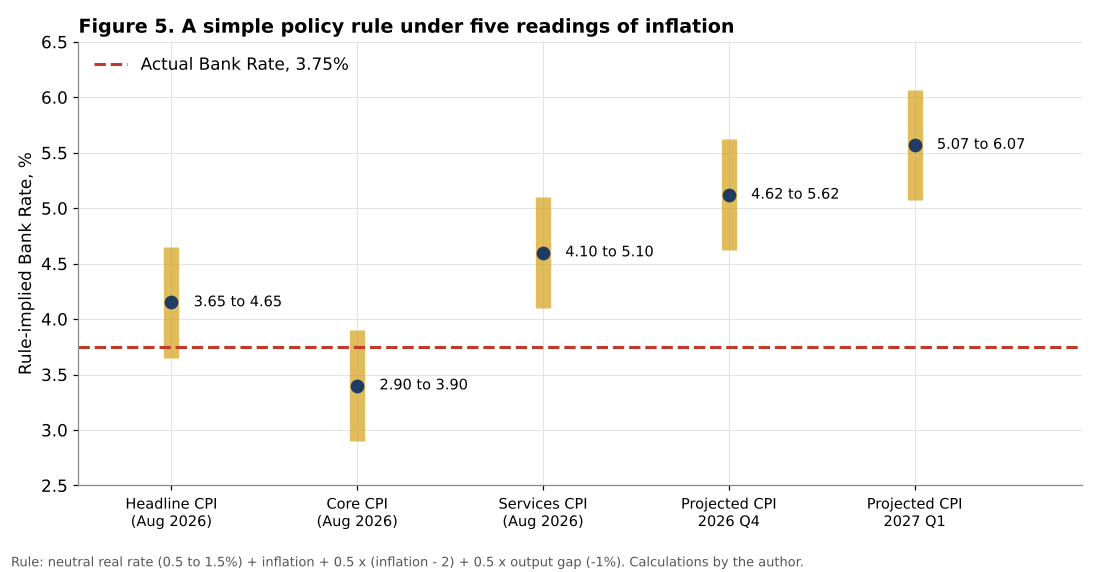
With core inflation, the rule gives a range of 2.90 to 3.90 percent, with a central value of 3.40 percent: the current Bank Rate of 3.75 percent is at the upper end of the range, which would support the view of members who see policy as already restrictive. With headline inflation, the range is 3.65 to 4.65 percent, with a central value of 4.15 percent: the current rate is at the lower end. With services inflation, the range is 4.10 to 5.10 percent. With projected inflation for the end of 2026, the range is 4.62 to 5.62 percent, and for early 2027, 5.07 to 6.07 percent.
These results map closely onto the divisions within the MPC. A member who focuses on core inflation and slack, such as Alan Taylor or Swati Dhingra, will find that the current rate is appropriate or even too high. A member who focuses on projected inflation and the risk of persistence, such as Catherine Mann or Huw Pill, will find that the rate is too low. The median member, represented by the Governor, sits between the two and prefers to wait for evidence on second-round effects before acting.
The rule exercise also shows that the argument is not about small differences. Depending on the measure, the prescribed rate varies by about 2 percentage points. This is much larger than the quarter point increments in which the MPC usually moves, and explains why the debate is about the direction of the next move rather than its size.
5.6 Wages, real incomes and second-round effects
The key to resolving the dilemma lies in the labour market. Second-round effects occur when workers demand higher wages to compensate for higher prices, and firms pass on these higher wages into prices. In the United Kingdom, the indicators in September 2026 point in different directions.
On one side, wage growth has slowed. Private sector regular Average Weekly Earnings grew by 2.9 percent in the three months to July 2026, compared with 3.3 percent at the start of the year. With CPI inflation at 3.1 percent, this means that real private sector wages are falling slightly, by about 0.2 percent over the year. Unemployment has stabilised at 4.9 percent. The MPC’s Decision Maker Panel survey shows firms expecting wage growth of 3.4 percent over the next year, which is high relative to productivity growth but not accelerating.
On the other side, the Bank’s own staff consider that underlying private sector wage growth is closer to 3.5 percent when other indicators are taken into account. Firms’ price expectations remain elevated. And household inflation expectations, as measured by the Citi and YouGov survey, increased between July and August at both one-year and five-year horizons, although the Bank’s own survey showed a decline.
The fall in real wages is itself a source of risk. Workers who see their purchasing power decline for a second time in five years, after the large fall of 2022, may be more likely to demand compensation. Blanchard and Galí’s analysis suggests that the degree of wage indexation is crucial: in an economy where workers have recently experienced high inflation, the tolerance for further real wage losses may be lower than in the past.
5.7 Growth, investment and consumption
The second horn of the dilemma is growth. The UK economy grew by 0.6 percent in the first quarter of 2026 and 0.4 percent in the second quarter, better than expected. But the July Report projected underlying growth close to zero in the third quarter, and business surveys point to weakness. The household saving ratio was 8.9 percent in the first quarter of 2026, above its pre-pandemic average, which suggests that households remain cautious. Business investment rose by 0.9 percent in the first quarter but was expected to soften, and firms reported broadly flat investment intentions.
An energy shock reduces the real disposable income of households and the profitability of firms. A rise in Bank Rate would add to these pressures by raising mortgage rates and the cost of capital. The MPC’s estimate of potential supply growth is very low, about 0.3 to 0.4 percent a year, which means that even modest demand growth can quickly absorb spare capacity. But it also means that the economy has little room to absorb shocks.
The question of investment is particularly important for the United Kingdom, which has had one of the lowest rates of business investment among the G7 for many years. Higher interest rates and uncertainty could further delay investment decisions, with lasting effects on productivity. This is the strongest argument for caution.
5.8 Quantitative tightening
The MPC’s decision in September 2026 to continue active sales of government bonds at £20 billion a year, together with passive run-off of maturing bonds, adds a further dimension. The Bank’s estimates suggest that quantitative tightening has added only 20 to 30 basis points to UK term premia, out of a total rise of about 200 basis points since 2022. On the Bank’s plan, holdings will fall by about £46 billion a year until about September 2034, when £120 billion of the longest-dated bonds will be kept to back banknotes.
The decision to keep reducing the balance sheet while holding Bank Rate is consistent with the Bank’s view that the two instruments serve different purposes: Bank Rate is the active tool of monetary policy, while quantitative tightening is meant to proceed in the background. It also reflects a desire to avoid market disruption. However, in a period of high government borrowing, which is examined in the next article in this series, the interaction between quantitative tightening and fiscal policy is a subject of debate.
6. Discussion
6.1 Looking through, but not too far
The analysis shows that the MPC’s majority has adopted a strategy of conditional patience: it is looking through the first-round effects of the energy shock, but has signalled that it will act if second-round effects emerge or if the shock persists. This is broadly the strategy recommended by the literature for a supply shock in an economy with spare capacity and anchored expectations.
The question is whether the conditions for this strategy are met. Spare capacity exists, but the output gap is small (about 1 percent) and potential growth is weak. Expectations are anchored at long horizons according to some measures but not others. And the United Kingdom has recently experienced a period of very high inflation, which may have made households and firms more sensitive to price increases.
The minority’s argument is that the cost of acting too late is higher than the cost of acting too early. If second-round effects take hold, the MPC would need to raise rates more sharply later, with greater damage to activity. A pre-emptive increase of a quarter point would signal commitment to the target at limited cost. This argument draws on the experience of 2021 and 2022, when central banks were criticised for reacting too slowly.
6.2 The role of the measure of inflation
The author’s calculations show that the disagreement within the MPC can largely be explained by the choice of inflation measure and time horizon. This is not a technical detail. It reflects different views of how the economy works: whether energy shocks are temporary or persistent, whether wages respond to prices, and how quickly monetary policy affects inflation.
A useful way to reconcile the views is to focus on indicators that distinguish between first- and second-round effects. Services inflation, which is driven mainly by domestic labour costs, has fallen from 4.5 percent in March to 3.4 percent in August, which does not suggest second-round effects so far. Core inflation is stable at 2.6 percent. Wage growth has slowed. On this basis, the evidence in September 2026 supported the majority’s decision to wait. But the forward-looking indicators, especially household and firm expectations, suggest that the risk is rising.
6.3 Growth and the cost of insurance
The case for a pre-emptive increase is often framed as an “insurance” policy: a small increase now reduces the risk of a large increase later. But insurance has a cost. With growth close to zero, unemployment close to 5 percent and real wages falling, a further tightening would weigh on an economy that is already fragile. The housing market, mortgage holders refinancing from low fixed rates, and investment would be affected.
The balance between these considerations depends on how long the energy shock lasts. If oil and gas prices fall back in 2027, as futures markets suggest, inflation would decline without a monetary response, and a rate increase would have been unnecessary. If prices remain high, the risk of second-round effects would grow, and the case for tightening would become stronger. The MPC noted in September that the July Report’s adverse scenario, in which the conflict is prolonged and the energy shock persistent, was now a reasonable approximation of current conditions.
6.4 Fiscal and monetary interactions
The government has taken measures to cushion the energy shock for households, including a temporary removal of VAT on domestic energy bills, which the Bank estimated would lower the typical annual bill by about £45 in the fourth quarter. Such measures lower measured inflation in the short term but can add to demand. The next article in this series examines the state of public finances and the room for manoeuvre of the government ahead of the autumn Budget. The combination of fiscal support and monetary restraint will be a key issue in the coming months.
6.5 International comparison
The United Kingdom is not alone. Many central banks face similar trade-offs. However, UK inflation in August 2026 (3.1 percent) was above the flash estimates for France (2.7 percent) and Germany (2.9 percent), and the United Kingdom has a history of more persistent inflation than the euro area, linked to its labour market and services sector. At the same time, its growth has been weak. This combination of relatively high inflation and weak growth makes the UK case especially difficult.
7. Scenarios to the end of 2027
7.1 Three paths
Figure 6 shows the evolution of MPC votes and three scenarios for Bank Rate.
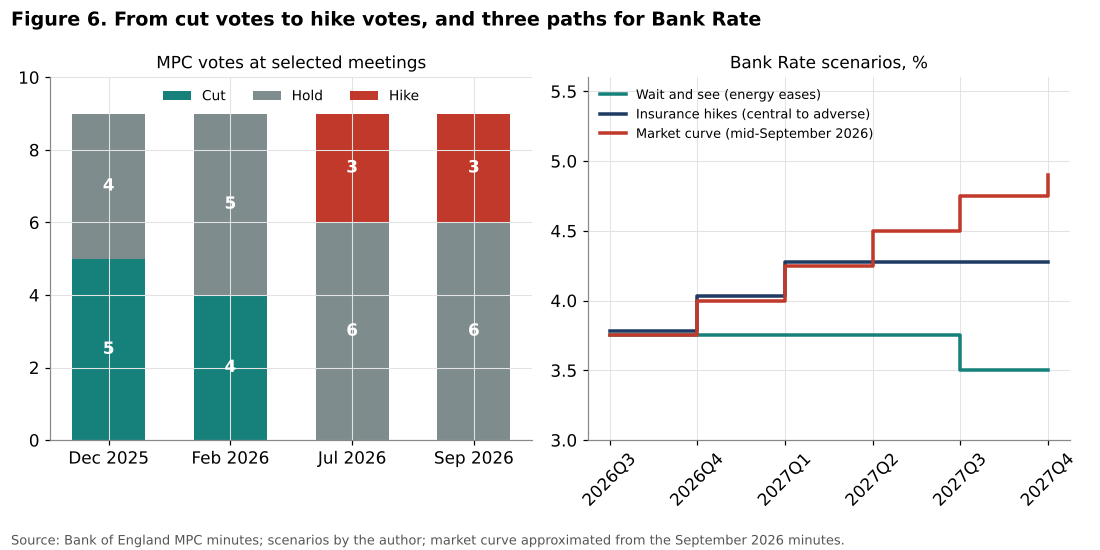
The left panel shows the shift in the balance of votes. In December 2025, five members voted for a cut and four for a hold. In February 2026, four voted for a cut and five for a hold. By July and September 2026, no member voted for a cut, six voted for a hold, and three for an increase. The direction of the debate has reversed completely within nine months.
The right panel presents three illustrative paths for Bank Rate.
Scenario 1: Wait and see. Energy prices ease from the end of 2026, the increase in the price cap in early 2027 is smaller than feared, and services inflation and wage growth continue to slow. The MPC holds Bank Rate at 3.75 percent until mid-2027 and then resumes cutting, to 3.5 percent in the third quarter of 2027. Inflation peaks at about 4 percent in early 2027 and then falls rapidly as energy effects drop out of the annual comparison.
Scenario 2: Insurance increases. The conflict persists, energy prices remain high, and indicators of second-round effects increase moderately. The MPC raises Bank Rate by a quarter point in November 2026 and again in early 2027, to 4.25 percent, and then holds. This scenario corresponds to a path between the July central projection and the adverse scenario, and to the conditional guidance given by the Governor and Deputy Governors in September.
Scenario 3: The market curve. Bank Rate follows the path implied by market interest rates in mid-September 2026, rising gradually to about 4.9 percent at the end of 2027. This path would imply a sustained tightening cycle, justified only if second-round effects become clearly established and inflation expectations rise further. The minutes note that part of the slope of the market curve reflects risk premia rather than expected policy rates, so this scenario probably overstates the expected path.
7.2 Assessment
On the basis of the evidence presented in this article, the author considers scenario 2 to be the most likely. The rule analysis shows that, under forward-looking measures of inflation, a rate of 4 to 4.25 percent is within the plausible range, while the evidence on wages and services inflation does not yet justify a long tightening cycle. The conditional guidance of the MPC’s central members, the Governor and his deputies, points in this direction if the conflict persists.
However, the outcome depends critically on energy prices, which are beyond the control of the Bank. A rapid de-escalation of the conflict would make scenario 1 more likely. A prolonged conflict with a sharp rise in gas prices in early 2027 could push the MPC toward scenario 3.
7.3 Indicators to watch
The author suggests that the following indicators will be decisive:
1. Services CPI inflation, which measures domestic pressures and should be below 3.5 percent for the hold to remain justified. 2. Private sector regular pay growth and pay settlements for 2027, especially in the Decision Maker Panel. 3. Household and business inflation expectations, at one-year and five-year horizons. 4. The Ofgem price cap for January to March 2027, to be announced in late November 2026. 5. The unemployment rate, which would signal increasing slack if it rose above 5 percent.
8. Conclusion
The Bank of England in 2026 faces a classic but acute dilemma. An energy price shock originating outside the United Kingdom has pushed inflation back above 3 percent and is expected to raise it to around 4 percent by early 2027, while the domestic economy shows spare capacity, weak growth and slowing wage growth.
The main findings of this article are:
1. About two thirds of the inflation overshoot in August 2026 (0.7 of 1.1 percentage points) comes from direct energy effects. Core inflation (2.6 percent) and services inflation (3.4 percent) are moderate. 2. The real Bank Rate ranges from +1.15 percentage points against core inflation to -0.30 points against projected inflation for early 2027. The stance of policy depends on the horizon chosen. 3. A simple policy rule gives a prescribed Bank Rate between 2.9 and 3.9 percent based on core inflation, and between 5.1 and 6.1 percent based on projected inflation for early 2027. The divisions within the MPC reflect this range. 4. A 10 percent rise in crude oil prices adds about 0.1 percentage point to CPI through fuel prices directly; the larger risks come from household energy bills and indirect effects. 5. Real private sector wages are falling slightly, which reduces demand but increases the risk of compensating wage claims.
The author’s conclusion is that the Bank of England’s dilemma is not about whether to fight inflation, but about when. The evidence available in September 2026 justified patience, but the window for patience is narrowing. If services inflation, wages and expectations begin to rise in the coming months, the MPC will need to act, even at the cost of slower growth. If they remain stable, the Bank can look through the energy shock and protect investment and consumption. The most important decisions in the coming months will therefore depend less on the headline inflation rate than on the indicators of second-round effects.
Need this analysis for your organisation?
We prepare confidential briefings, executive talks and studies on countries, markets and policies, built on the same method as this article.
Request a briefingSupport independent analysis
Our studies are free to read and carry no advertising. If this one was useful, a small contribution helps us publish the next.
Support our workGo further: books by Global Strategy Files


Frequently asked questions
Why did the Bank of England keep rates at 3.75 percent in September 2026?
The Monetary Policy Committee held Bank Rate at 3.75 percent by six votes to three because an energy shock is raising inflation while the economy has spare capacity, unemployment is close to 5 percent and private sector wage growth has slowed below 3 percent. Three members wanted 4 percent.
Is UK monetary policy restrictive in 2026?
It depends on the inflation measure. Against core inflation of 2.6 percent, a Bank Rate of 3.75 percent is moderately restrictive. Against projected inflation of about 4 percent in early 2027, it is roughly zero in real terms.
Will the Bank of England raise interest rates?
A simple policy rule points to 2.9 to 3.9 percent using core inflation, but above 5 percent using projected headline inflation. The decision will depend on second-round effects, so services inflation, wage settlements and household inflation expectations are the key indicators to watch.
How is the energy shock affecting UK inflation?
The Middle East conflict pushed Brent crude to about US$106 a barrel and UK wholesale gas prices up about 78 percent since July 2026. Inflation is projected at about 4 percent in early 2027, above the 2 percent target, while core inflation remains 2.6 percent.
Methodological note
All calculations in this article were carried out by the author using data from the Office for National Statistics (consumer price inflation bulletin for August 2026) and the Bank of England (Monetary Policy Summary and minutes of September 2026, Monetary Policy Report of July 2026, record of Bank Rate decisions). The real Bank Rate uses Bank Rate of 3.75 percent minus the inflation measure indicated. The policy rule uses a neutral real rate of 0.5, 1.0 and 1.5 percent, an inflation target of 2 percent, coefficients of 0.5 on the inflation gap and on the output gap, and an output gap of -1 percent. The share of crude oil in petrol prices assumes an exchange rate of US$1.30 per pound and 159 litres per barrel. The market curve in the scenarios is approximated from the description in the September 2026 minutes. The scenarios are illustrative and do not constitute forecasts or financial advice.
References
Bank of England (2026). Monetary Policy Report, July 2026. London.
Bank of England (2026). Monetary Policy Summary and minutes of the Monetary Policy Committee meeting ending on 16 September 2026. London.
Bank of England (2026). Monetary Policy Summary and minutes, February 2026. London.
Bernanke, B. S. (2024). Forecasting for monetary policy making and communication at the Bank of England: a review. Bank of England, London.
Bernanke, B. S. and Blanchard, O. (2023). What Caused the US Pandemic-Era Inflation? NBER Working Paper 31417.
Bernanke, B. S. and Blanchard, O. (2024). An Analysis of Pandemic-Era Inflation in 11 Economies. NBER Working Paper 32532.
Bernanke, B. S., Gertler, M. and Watson, M. (1997). Systematic Monetary Policy and the Effects of Oil Price Shocks. Brookings Papers on Economic Activity, 1997(1), 91 to 157.
Blanchard, O. J. and Galí, J. (2010). The Macroeconomic Effects of Oil Price Shocks: Why Are the 2000s So Different from the 1970s? In J. Galí and M. Gertler (eds.), International Dimensions of Monetary Policy. University of Chicago Press, 373 to 421.
Kilian, L. (2009). Not All Oil Price Shocks Are Alike: Disentangling Demand and Supply Shocks in the Crude Oil Market. American Economic Review, 99(3), 1053 to 1069.
Office for National Statistics (2026). Consumer price inflation, UK: August 2026. Statistical bulletin. Newport.
Orphanides, A. (2003). Historical Monetary Policy Analysis and the Taylor Rule. Journal of Monetary Economics, 50(5), 983 to 1022.
Taylor, J. B. (1993). Discretion versus Policy Rules in Practice. Carnegie-Rochester Conference Series on Public Policy, 39, 195 to 214.
