China Housing Repair Liabilities

Driss EFFINA, PhD Independent Researcher, Global Strategy Files Decoded, China series, 23 October 2026.
A repair contract, a post-subsidy funding draw and a new owner assessment are different quantities. This preview combines long-run completion evidence, selected municipal accounts, actual current lift awards and a transparent household payment experiment.
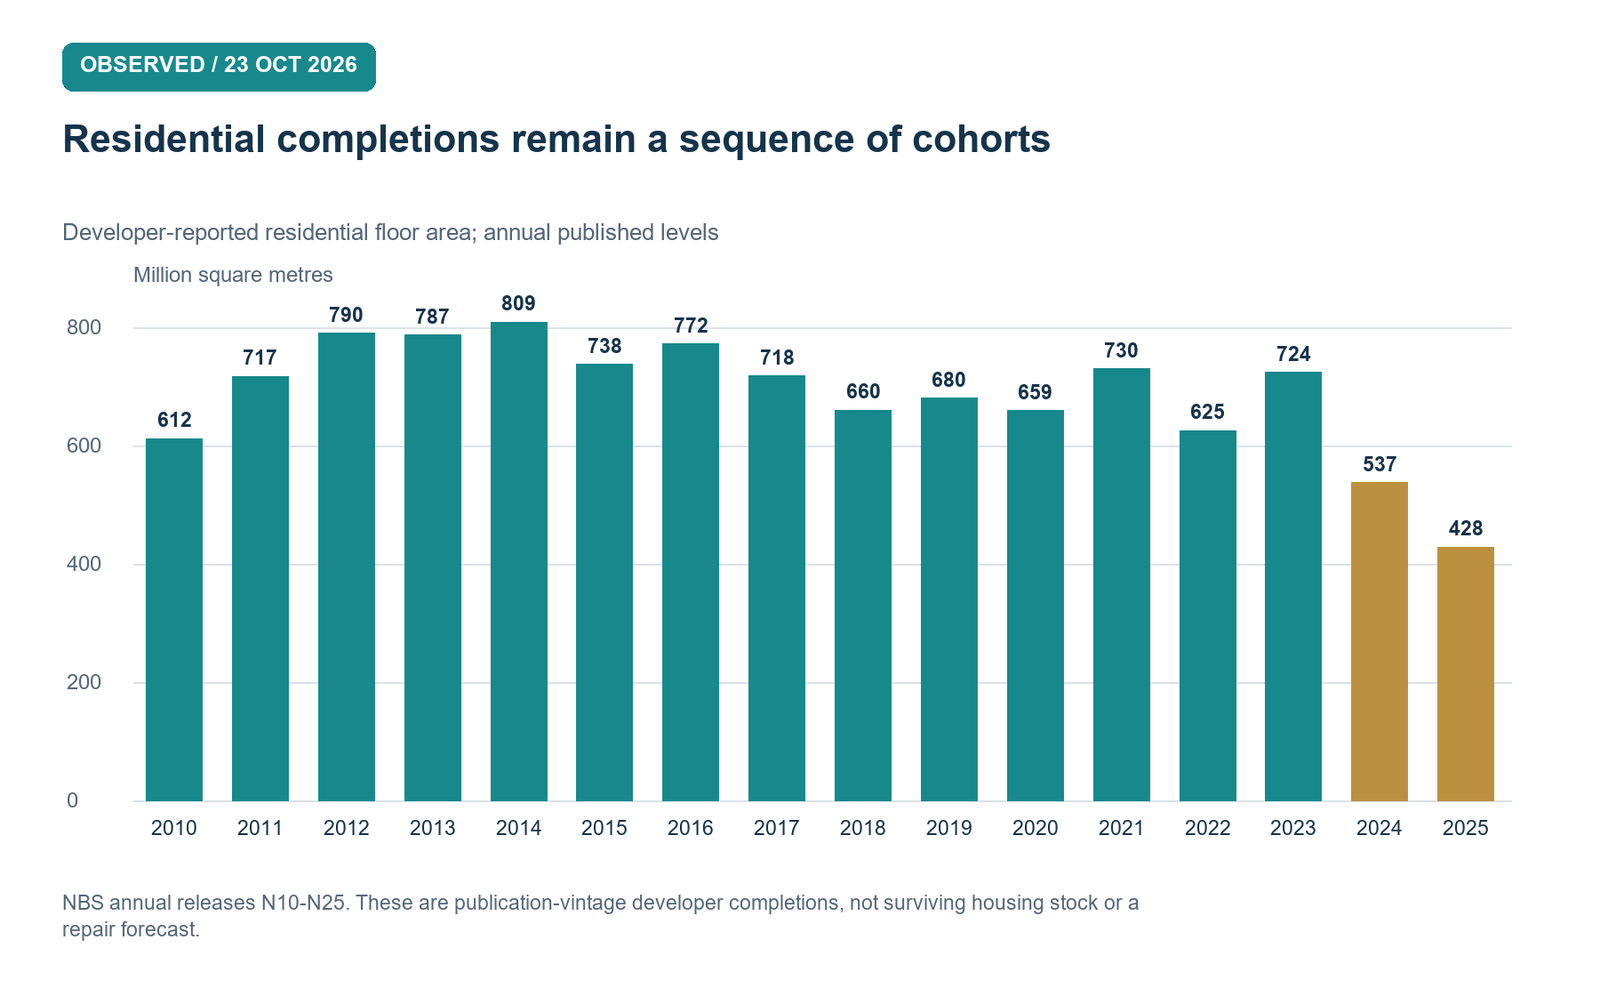
Sixteen completion flows describe staggered cohorts
The national ledger preserves sixteen annual publication-vintage observations of developer-reported residential completed floor area. The series starts at 612.16 million square metres in 2010, reaches 808.68 million in 2014, records 659.10 million in 2020 and ends at 428.30 million in 2025. The retained values are separately published levels, not a harmonized reconstruction from a later yearbook. Every year has an exact official source URL. The figure displays annual flows and does not assign them a common engineering lifetime. (NBS 2010 developer residential completions) (NBS 2014 developer residential completions) (NBS 2020 developer residential completions) (NBS 2025 developer residential completions)
The intervening observations reveal dispersed delivery: 716.92 and 790.43 million square metres in 2011-2012, 787.41 million in 2013, 737.77 million in 2015 and 771.85 million in 2016. The 2017-2019 values are 718.15, 660.16 and 680.11 million; 2021-2024 are 730.16, 625.39, 724.33 and 537.41 million. These numbers demonstrate a sequence of reported completions. They do not establish whether those buildings survive, contain lifts, have already renewed equipment or hold sufficient reserves. (NBS 2011 developer residential completions) (NBS 2012 developer residential completions) (NBS 2013 developer residential completions) (NBS 2015 developer residential completions) (NBS 2016 developer residential completions) (NBS 2017 developer residential completions) (NBS 2018 developer residential completions) (NBS 2019 developer residential completions) (NBS 2021 developer residential completions) (NBS 2022 developer residential completions) (NBS 2023 developer residential completions) (NBS 2024 developer residential completions)
The sum is 10,988.33 million square metres, an exact addition of those published flows. It must not be called standing housing stock, homes needing repair or a national liability denominator. The ledger omits earlier vintages and does not subtract removals. Developer scope also excludes housing outside that reporting population. Even a complete surviving-stock measure would not identify common-component condition, local repair prices or the owner’s accessible funding. The long series supplies historical exposure context while leaving those decisive links open.
A further statistical limit concerns changes over time. Original releases can calculate growth against revised comparable bases, so the ratio of two preserved publication levels need not reproduce an official growth rate. Website migration dates can differ from initial publication dates. The archive preserves observation year, source and any extracted publication date rather than harmonizing selected rows silently. This discipline prevents a long axis from conveying a false precision about the age or condition of the housing that would actually enter a repair study.
Small draw rates do not measure engineering adequacy
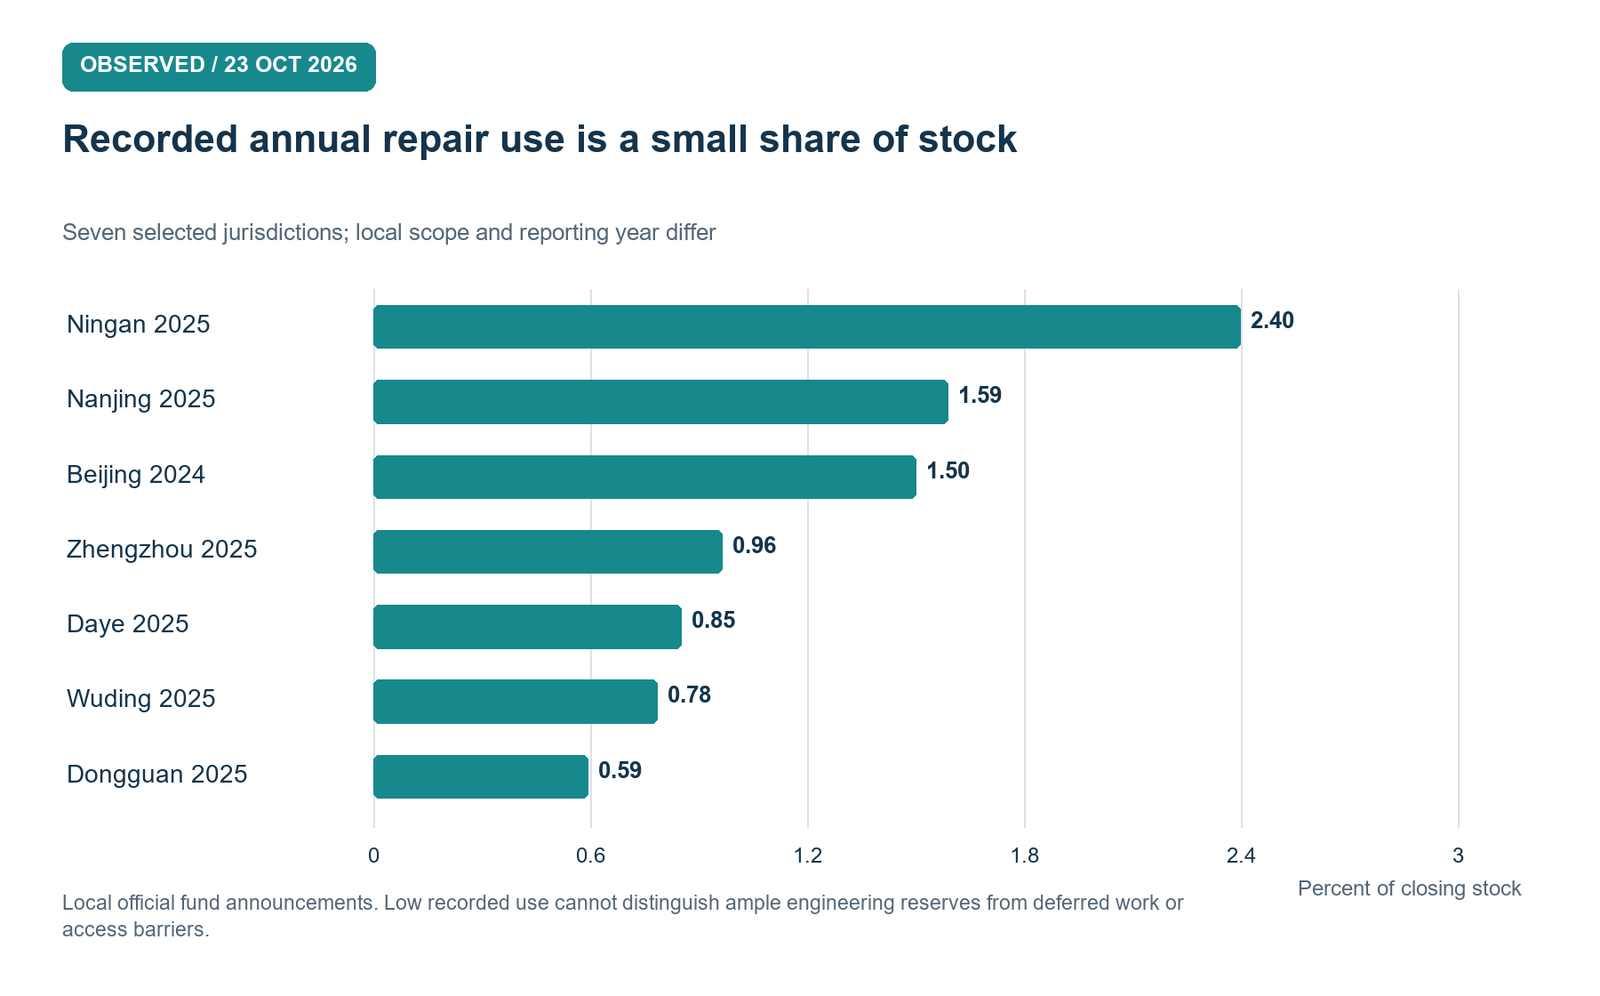
The seven selected latest municipal observations report annual repair disbursement equal to 0.593%-2.396% of closing fund stock. Dongguan is at the low end and Ning’an at the high end; Nanjing’s main urban districts record 1.589%, Beijing 1.500% and Zhengzhou 0.965%. These are exact ratios of recorded use to each source’s reported stock. They are not actuarial funding ratios, a forecast of needs or evidence that the current repair rate can be sustained for a stated number of years. (Dongguan repair fund announcement) (Ningan residential repair fund statement) (Nanjing main urban repair fund annual announcement) (Beijing commercial residential repair fund annual announcement) (Zhengzhou repair fund annual announcement signed21Jan)
The local quantities are substantial in their own boundaries. Beijing’s centrally managed commercial-residential fund has RMB74.261 billion in reported balance for 2024 and RMB1.114 billion in annual disbursement. Nanjing’s six main urban districts report RMB18.962 billion for 2025 and RMB301.3511 million in completed-case spending. Dongguan reports RMB7.587 billion and RMB45 million. These are selected disclosures with different scopes and dates, not a sample drawn to represent Chinese homeowners. Adding them would not produce a national reserve estimate. (Beijing commercial residential repair fund annual announcement) (Nanjing main urban repair fund annual announcement) (Dongguan repair fund announcement)
Several explanations can generate a low current draw. A relatively young building portfolio can have genuinely limited immediate needs; prudent reserves can finance future work. Alternatively, approvals or replenishment requirements can delay intervention, or reported disbursement can lag procurement. The account does not identify which explanation dominates. An inverse ratio of stock to one year’s use is mechanically calculable but would become misleading if labelled years of guaranteed service. Future costs, inflation, component condition and the accessibility of individual balances remain unknown.
The figure therefore uses the neutral label annual draw and retains each reporting year. Its strongest conclusion is a rejection of simple inference: a large stock relative to current spending does not establish either universal sufficiency or universal hoarding. The next useful observation is not a more dramatic citywide ratio but a matched building account and an independent preservation plan. That linkage can reveal both well-funded cases and genuine residuals, and avoids treating selected current spending as a direct estimate of latent engineering demand.
Reconciliation limits are evidence, not accusations
Zhengzhou’s announcements provide a useful reproducible reconciliation test. Reported 2024 total is RMB21.218 billion. Adding 2025 contributions of RMB487 million and interest of RMB699 million, then subtracting repair use of RMB216 million, gives RMB22.188 billion. The 2025 reported total is RMB22.388 billion. The resulting RMB200 million bridge remains unresolved by these passages. The calculation identifies a disclosure or perimeter question; it is not evidence of wrongdoing, missing money or an engineering reserve deficit. (Zhengzhou repair fund annual announcement signed12Jan) (Zhengzhou repair fund annual announcement signed21Jan)
Transfers, opening adjustments or changed reporting scope could explain a difference, but none is inserted without documentation. The proper output is the expected total, reported total and unresolved bridge with source dates. Renaming the source’s reported total an audited net asset would also overstate what is known. The figure keeps outflows distinct from the implied net change and labels the residual explicitly. Its function is to stop an accounting model from silently repairing the source before drawing a stronger inference.
Other accounts provide counterexamples. Dongguan’s rounded cumulative contributions of RMB6.366 billion, yield of RMB1.474 billion and cumulative use of RMB253 million reconstruct its RMB7.587 billion balance. Daye’s 2024 cumulative identity also reconciles, while its 2025 reported components leave a RMB5.1628 million bridge. Wuding separately reports demolition-related refunds and audit/bank charges in addition to repair spending. Such items show why an annual stock equation must inspect all relevant lines rather than assume repair is the sole possible outflow. (Dongguan repair fund announcement) (Daye repair fund announcement) (Daye repair fund announcement signed24Feb) (Wuding residential repair fund statement signed13Apr)
MOF’s repair-fund accounting framework, effective from 2021, includes transition and reclassification adjustments and did not require previous-year comparison in the first year. This is another reason to check reporting breaks before concatenating a long municipal series. Reconciliation improves the reliability of observed balances, but even a perfect financial identity would not establish engineering adequacy. It says that reported cash categories add up; the future preservation plan and eligible beneficiary-level access remain separate pieces of evidence. (MOF repair fund accounting Q&A)
Current awards anchor the gross cost of 27 lifts
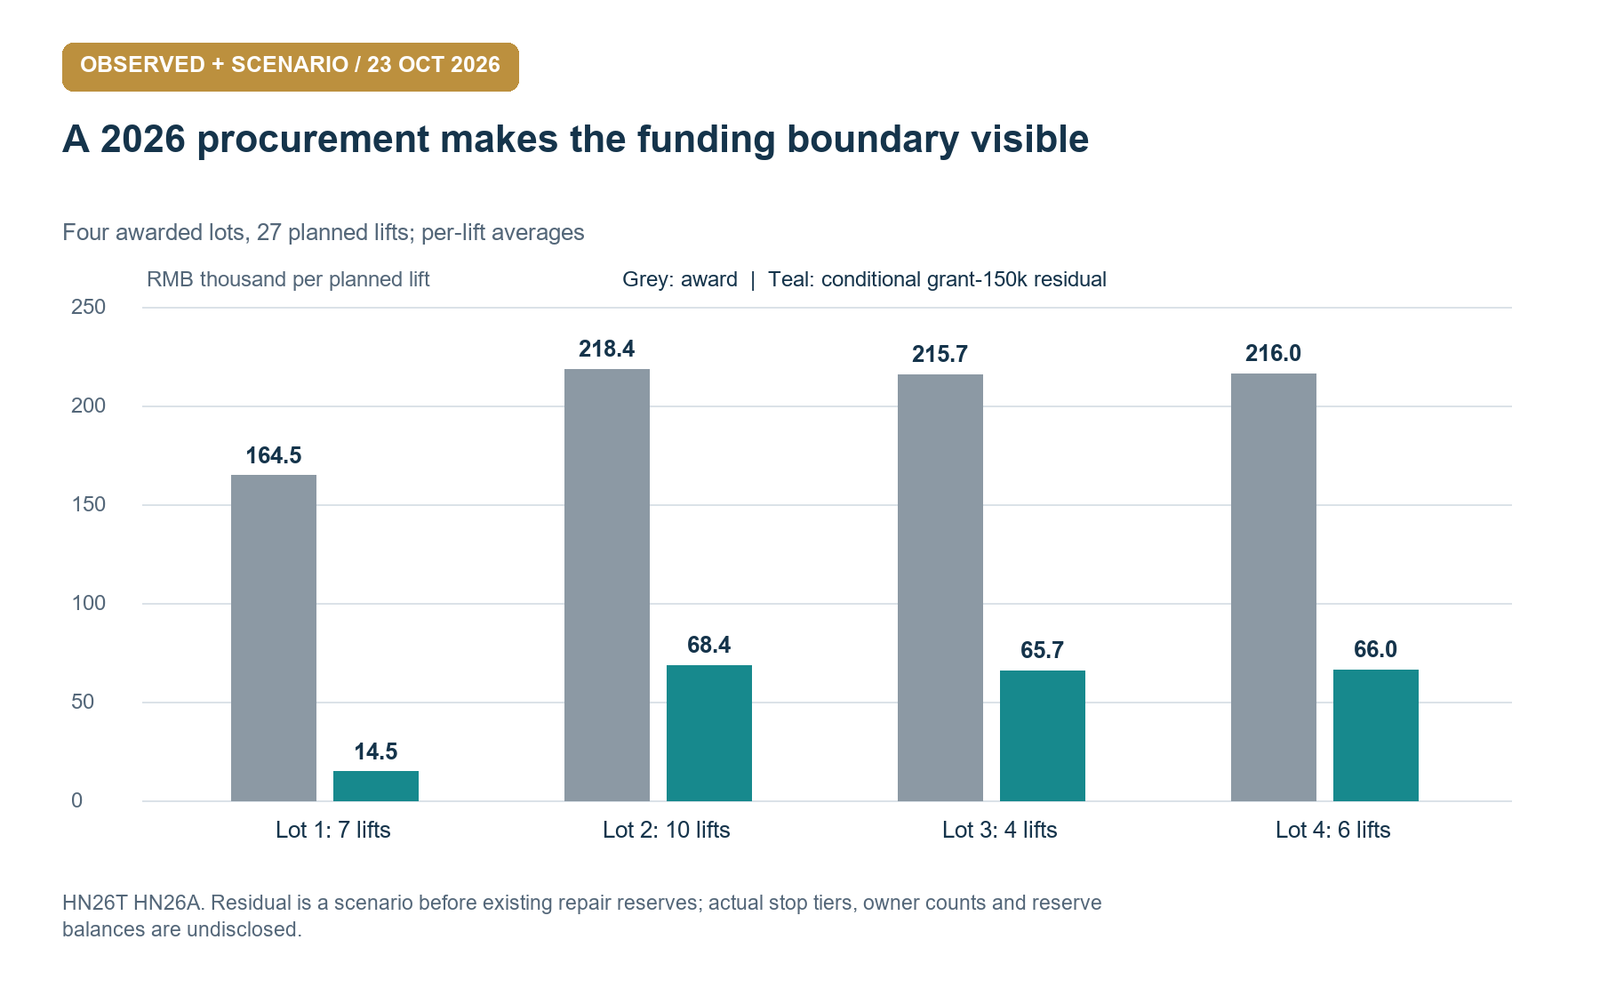
The five-compound lift-replacement project in Zhengzhou, Henan, provides a concrete gross-cost anchor. The August 2026 tender plans 27 lift replacements across five compounds, divided into four lots with 7, 10, 4 and 6 lifts. The official award of 8 October 2026 lists four amounts: RMB1,151,300; RMB2,183,700; RMB862,700; and RMB1,295,935. Their sum is RMB5,493,635, or RMB203,467.96 per planned lift. Those exact calculations use the tender’s planned quantities and the awarded lot prices. (Five-compound residential lift replacement tender) (Five-compound lift replacement award)
The corresponding lot averages are approximately RMB164,471.43, RMB218,370.00, RMB215,675.00 and RMB215,989.17. Differences can reflect specifications, stops, site conditions and contract scope; those causes are not estimated here. The scheduled delivery and installation period is 50 days. An award is a contractual amount, not proof that all planned lifts were completed, that final scope was unchanged or that money had already been paid by the cutoff. A current observation remains valuable without upgrading its evidentiary status.
The tender identifies funding from ultra-long special treasury-bond subsidies plus housing repair funds. Subsidy tiers are RMB100,000 for no more than nine stops, RMB150,000 for ten to eighteen stops, and RMB200,000 for at least nineteen stops. It states that the excess after subsidy is paid from repair funds and permits scope reduction or cancellation if required owner replenishment is not paid. This establishes a real institutional link between a planned repair, public support and repair-fund resources. (Five-compound residential lift replacement tender)
It does not establish the actual owner cash call. The records do not provide the stop mix, final eligibility, subsidy disbursement, usable reserves or legal household shares. The figure consequently distinguishes observed award averages from a conditional grant deduction. The gross cost is known at the award stage, while the household residual remains a set of missing links. That combination is more informative than either ignoring the procurement or treating its full price as a new liability of the identified residents.
Table 5. An award does not reveal an owner assessment
| Step | Calculation / input | Evidence boundary |
|---|---|---|
| Four awards | RMB5,493,635 total | Actual contractual award |
| Flat150k subsidy x27 | RMB4,050,000 | Conditional, stop mix unknown |
| Residual before reserves | RMB1,443,635 | Common-fund draw, not a new assessment |
| Eligible reserve / shares | Not disclosed | Additional owner payment unknown |
Adequate eligible balances can reduce a new assessment to zero. Planned quantities are not verified completed lifts. (Five-compound residential lift replacement tender) (Five-compound lift replacement award)
The same repair plan permits different payment paths
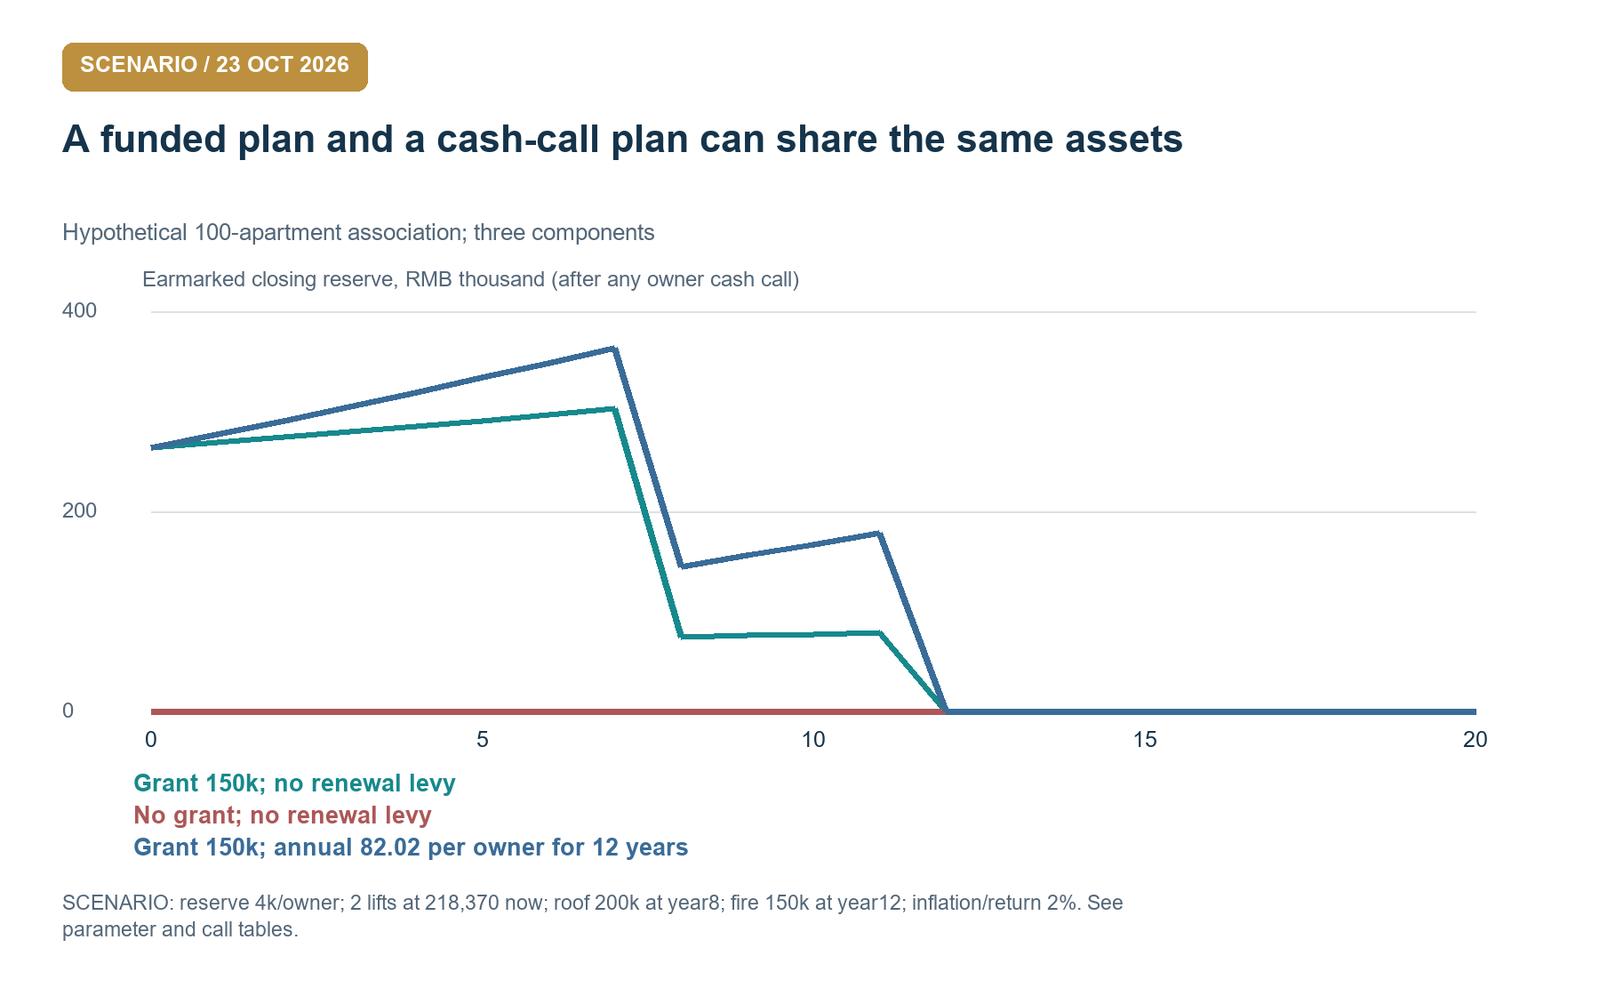
The illustration describes a hypothetical 100-apartment association with an opening earmarked reserve of RMB400,000, or RMB4,000 per apartment. It replaces two lifts immediately at the observed lot-two award average of RMB218,370 each. Roof work of RMB200,000 at year eight and fire work of RMB150,000 at year twelve are assumed in time-zero prices. Cost inflation, fund return and discount rate are each 2%. The grant case assumes a conditional RMB150,000 per lift; the building inputs are assumptions and no borrowing is allowed.
Under the conditional grant and no new scheduled levy, future additional calls have a total present value of RMB86,740, or RMB867.40 per apartment. There is no immediate call because the eligible opening reserve covers the post-grant lift expenditure. The remaining reserve grows until the assumed roof and fire interventions, with positive-part calls filling later shortfalls. The graph shows closing balances after those calls. A nonnegative plotted balance therefore does not imply there were no owner payments; the call ledger must be read alongside it.
A computed scheduled contribution of RMB82.020994 per apartment annually for twelve years eliminates additional calls in the grant case. Yet total remaining owner-payment present value remains RMB867.40 per apartment. The plan changes timing: scheduled saving replaces later unscheduled assessments. Displaying only the zero additional-call column would incorrectly describe the household burden as eliminated. The contribution stream is an owner cost and is included in the complete discounted ledger.
Without the conditional grant, the total remaining owner-payment present value is RMB3,867.40 per apartment. A computed annual saving of RMB330.958588 per owner for twelve years can fund the future interventions but still leaves the immediate RMB367.40 call. The same immediate bill occurs without scheduled saving. This is a clear timing constraint, not an imperfection of the smoothing calculation: with no credit, money paid in later years is unavailable to meet work required now.
The difference between grant and no-grant total present values is exactly RMB3,000 per equal owner, corresponding to the assumed RMB300,000 subsidy across one hundred apartments. Public support transfers part of the cost outside this association; it does not erase the resource cost for the broader public budget. All scenarios end with zero earmarked terminal reserve under these inputs. A different overfunded plan would need its remaining balance recorded explicitly. The model thus compares complete payment paths, with funding incidence and liquidity kept distinct.
Repair liabilities must be counted once in value
Let V be the value of housing services before a repair liability, U its present value and theta the fraction already reflected in market price. Then P = V – theta U. An additional valuation deduction from observed price is (1-theta)U, so a once-adjusted value is V-U. Subtracting all U again from P understates value by theta U. This is an accounting identity under an exposed capitalization fraction, not an estimate of Chinese transaction prices or market efficiency.
The illustration sets unencumbered value to RMB1 million and liability present value to RMB10,000, then varies theta from zero to one. With no capitalization, observed price is RMB1 million and the additional deduction is RMB10,000. With full capitalization, price is RMB990,000 and no further deduction is needed. Naively subtracting another RMB10,000 would give RMB980,000, counting the same liability twice. Intermediate cases distribute the adjustment between the price already observed and the additional uncapitalized amount.
Capitalization does not remove a future cash payment. A buyer can pay less for a property because of expected repairs and still need liquid money when the assessment arrives. Conversely, a resident can have a bill fully covered by a dedicated reserve, in which case gross engineering cost overstates the new call. A wealth analysis and a liquidity analysis therefore need related but different ledgers. Housing price, earmarked reserve, additional assessment and available financial assets should remain separate before a net position is calculated.
Empirically, theta is unknown. Estimating it requires comparable transactions, condition and credible variation in expected repair exposure, with attention to amenities, location and selection. An observed price discount in an old building can reflect many attributes besides unfunded repairs. The article does not impose zero capitalization to maximize an apparent hidden liability. Its practical recommendation is narrower: test what market prices already reflect before making an additional wealth correction, and assess dated liquidity independently even when prices appear to adjust. The two questions can yield different answers without contradiction.
Continue reading
Get the complete 30-page research note
The English PDF contains 14 figures, 14 tables, a 16-year completion ledger, municipal accounts, actual 2026 lift awards, building funding thresholds, discounted payment conservation and capitalization tests with clickable sources.
29 USD, instant PDF download, secure card payment.
Buy the full noteOne-time purchase. Information cutoff: 23 October 2026. No national repair-liability total or causal household spending effect is estimated.
Need this analysis for your organisation?
We prepare confidential briefings, executive talks and studies on countries, markets and policies, built on the same method as this article.
Request a briefingSupport independent analysis
Our studies are free to read and carry no advertising. If this one was useful, a small contribution helps us publish the next.
Support our workGo further: books by Global Strategy Files

Books from Global Strategy Files
Go further on this topic
The Tariff GambleHow America’s trade war is reshaping power, prices and prosperity.24.99 USD, see the book Future-Proofing AmericaEconomic challenges and the road to reform.20 USD, see the book
 Kill KennedyWhat the 2025 declassified files reveal about the machinery of American power.20 USD, see the book