The Office Overhang: Record Delinquencies in a Recovering Market and the Capital Structure Problem

Abstract
American office buildings present a paradox in 2026. The market for space is recovering: according to CBRE, office leasing is on track to exceed the record of 2022, net absorption has been positive for ten consecutive quarters, the national vacancy rate has fallen for five quarters to 18.2 percent, prime vacancy is down to 11.9 percent and asking rents are rising at the fastest pace since 2016. Yet the market for office debt is in its worst condition on record. The delinquency rate on office loans in commercial mortgage-backed securities reached an all-time high of 12.34 percent in January 2026 and was still 12.16 percent in September, above the peak of the post-2008 crisis, while the overall CMBS delinquency rate reached 8.02 percent, its highest since 2020. This study explains the paradox with twenty years of data on delinquencies, vacancies, interest rates and values. We show that office delinquency has decoupled from occupancy: a model based on vacancy alone, estimated over 2008 to 2026, predicts an office delinquency rate of about 9.2 percent in 2026, three points below the actual rate, and the gap is the largest in the sample. The excess reflects a capital structure problem rather than a demand problem. Loans originated between 2016 and 2022 at low interest rates and high valuations are maturing into a market where office values are 30 to 38 percent lower and refinancing rates are two to three points higher. Our vintage analysis finds that a typical loan originated at 60 percent loan-to-value now has a loan-to-value of 84 to 97 percent at maturity, and that borrowers would need to inject equity equal to 23 to 33 percent of the loan to refinance under current underwriting standards. Applied to roughly 260 billion dollars of office debt maturing between 2026 and 2028, the equity gap is about 60 to 90 billion dollars. Scenarios show that office delinquency would fall toward 7 percent by 2030 only if interest rates decline; under higher-for-longer rates it would stay near 12 percent, and in a recession it could approach 18 percent. The office crisis has become a slow-moving balance sheet adjustment, concentrated on owners, special servicers and regional banks, in a market whose tenants are coming back.
Key findings
- Office CMBS delinquency rose from 1.6 percent in mid-2022 to a record 12.34 percent in January 2026, above the post-2008 peak of about 10.7 percent in 2012. It was 12.16 percent in September 2026.
- Over the same period, the national office vacancy rate measured by CBRE peaked above 19 percent and fell to 18.2 percent in the third quarter of 2026; prime vacancy fell to 11.9 percent.
- A vacancy-based model predicts 2026 office delinquency of about 9.2 percent; the actual rate is three points higher. If vacancy had stayed at its 2019 level, the model would predict about 4 percent.
- Office loans originated in 2016 to 2022 at 60 percent loan-to-value carry maturity loan-to-value ratios of 84 to 97 percent after a decline in values of 29 to 38 percent.
- Refinancing these loans would require new equity equal to 23 to 33 percent of the loan balance, or roughly 60 to 90 billion dollars on office debt maturing in 2026 to 2028.
- Office delinquency would fall to about 7 percent by 2030 if rates decline and leasing continues, would stay near 12 percent under higher-for-longer rates, and would approach 18 percent in a recession.
1. Introduction: tenants return, lenders lose
The office building was the most visible casualty of the pandemic. Remote and hybrid work emptied downtowns, vacancy rates climbed to records and the value of office properties collapsed. For several years, the story was one of falling demand. In 2026 the demand story has turned. Employers are asking workers to come back: 89 percent of the employers surveyed by CBRE in 2026 required at least three days a week in the office, up from 78 percent a year earlier. Leasing activity is on track to exceed the record of 2022. Construction of new space has almost stopped, with completions down 76 percent in the third quarter, which means that every square foot leased reduces vacancy. In Midtown Manhattan, the vacancy rate for prime space has fallen to 1.9 percent.
And yet office loans are defaulting at a record rate. The delinquency rate on office loans in commercial mortgage-backed securities, the market for which the most detailed data exist, rose from 1.6 percent in mid-2022 to more than 12 percent in 2026, the highest since Trepp began tracking it in 2000. Large loans on landmark buildings, such as Worldwide Plaza and One New York Plaza in Manhattan, moved into delinquency in January 2026. In Chicago, the debt on a downtown tower changed hands at about 76 percent below the building's previous purchase price. Lenders have largely abandoned the practice of extending troubled loans in the hope of a recovery, and losses are being recognized.
This study asks how both stories can be true at the same time. Our answer is that the office market has two balance sheets. The market for space, which determines rents and occupancy, is recovering. The market for capital, which determines whether existing loans can be refinanced, is still adjusting to a regime of higher interest rates and lower values. Section 2 traces twenty years of office vacancies and CMBS delinquencies. Section 3 shows that the two have decoupled. Section 4 analyzes the refinancing problem by loan vintage. Section 5 estimates the equity gap. Section 6 presents scenarios for delinquency to 2030. Section 7 discusses who bears the losses and what they mean for banks and cities.
2. Twenty years of office distress
2.1 Two crises
Figure 1 shows the delinquency rate on all loans in commercial mortgage-backed securities and on office loans from 2008 to 2026. The series record two distinct crises. The first, after the financial crisis, was a general crisis of commercial real estate: delinquency rose across all property types, the overall rate peaked at 10.34 percent in August 2012, and office delinquency peaked at about 10.7 percent at roughly the same time. The cause was a collapse of property values and incomes during the recession, compounded by the aggressive underwriting of loans originated in 2005 to 2007.

The second crisis is specific to office. In 2020, the overall rate spiked again because of hotels and retail, which were hit by lockdowns, while office delinquency stayed below 2 percent, protected by long leases. From 2023, as leases expired and interest rates rose, office delinquency climbed rapidly: to about 6 percent at the end of 2023, 11 percent in 2024, a record of 11.76 percent in October 2025 and 12.34 percent in January 2026. The overall CMBS rate, pulled up by office and later by multifamily, reached 8.02 percent in September 2026 before easing to 7.87 percent in October.
2.2 Vacancy: a slow climb and a partial retreat
Figure 2 shows the national office vacancy rate. Measured by Moody's Analytics, which tracks a broad universe of buildings, vacancy rose from about 12.6 percent in 2006 and 2007 to about 17.6 percent in 2010, eased only slightly during the 2010s, and climbed after the pandemic to records above 20 percent, about 21 percent in the first quarter of 2026. Other measures differ in level because they cover different buildings, but they tell a similar story until 2025. CBRE's measure rose from about 12 percent before the pandemic to a peak above 19 percent, then fell for five consecutive quarters to 18.2 percent in the third quarter of 2026. Colliers reports 17.7 percent, Cushman and Wakefield 19.8 percent and JLL 21.5 percent.
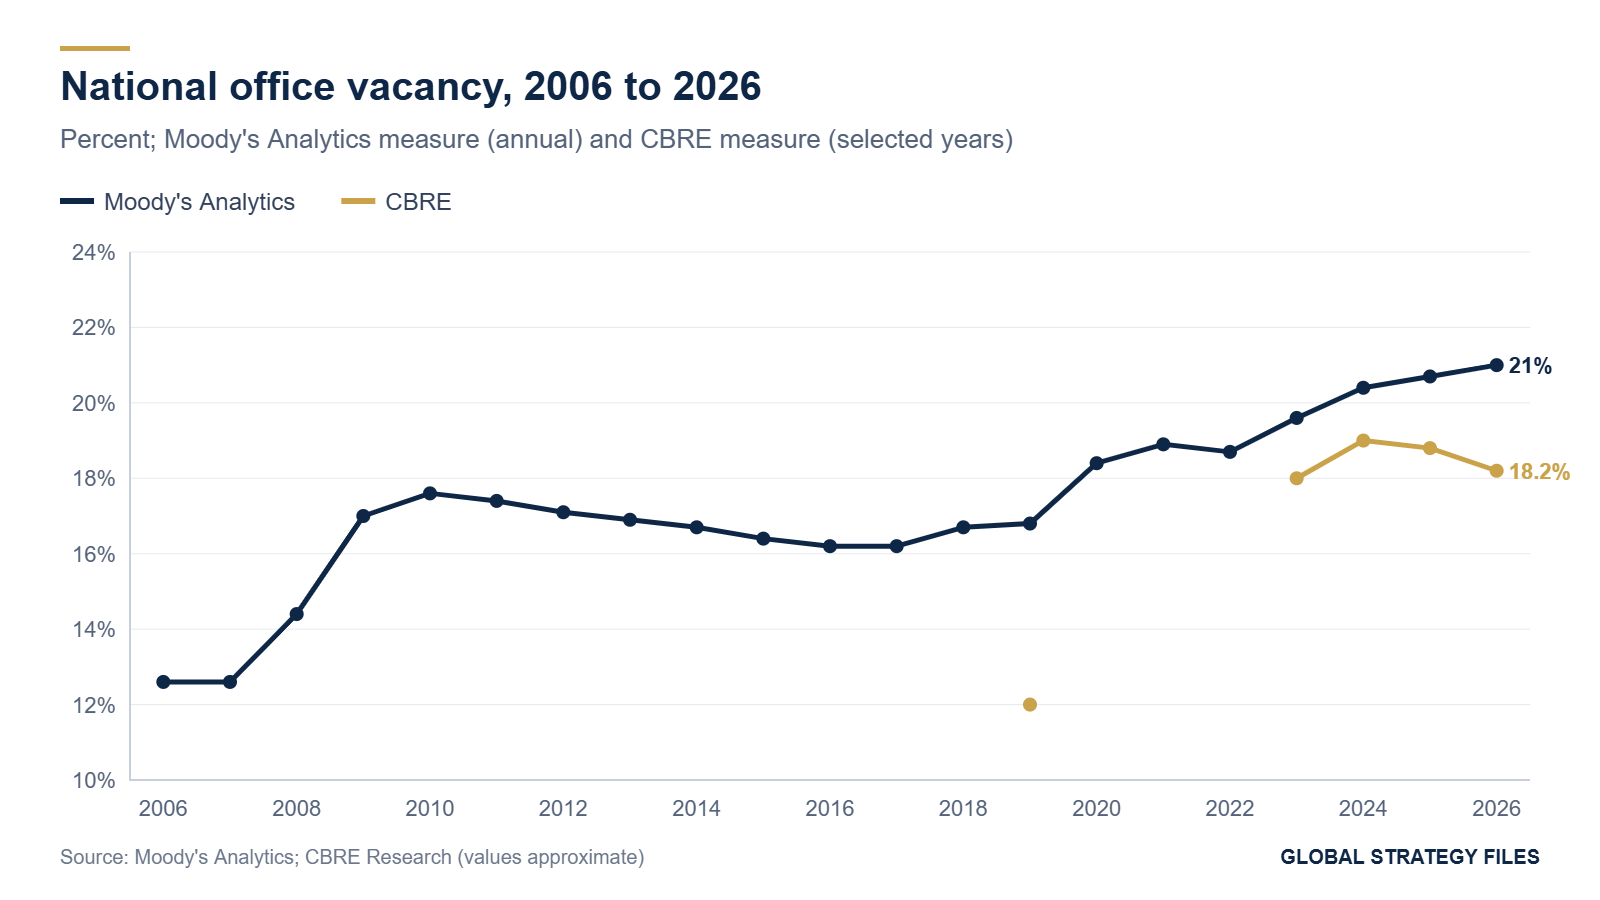
The divergence between measures matters less than the trend in each. By every measure, office vacancy has stopped rising, and by the measures that focus on large, modern buildings, it is falling. The recovery is concentrated in the best buildings: prime vacancy fell by 2.5 points in a year, while older, lower-quality buildings continue to lose tenants. The office market has split into two tiers.
Table 1. The office market in 2019, 2023 and 2026
| Indicator | 2019 | 2023 | 2026 |
|---|---|---|---|
| Office CMBS delinquency rate (%) | 2.1 | 6.0 | 12.2 (September) |
| Overall CMBS delinquency rate (%) | 2.3 | 4.5 | 7.9 (October) |
| National office vacancy, Moody's (%) | 16.8 | 19.6 | about 21 |
| National office vacancy, CBRE (%) | about 12 | about 18 | 18.2 (third quarter) |
| Prime office vacancy, CBRE (%) | n.a. | n.a. | 11.9 |
| Ten-year Treasury yield, annual average (%) | 2.1 | 4.0 | about 4.6 |
| Office values relative to 2022 peak | n.a. | about -20 percent | about -38 percent |
Source: Trepp; Moody's Analytics; CBRE; Treasury; Global Strategy Files estimates for office values.
3. The decoupling of delinquency from occupancy
3.1 A vacancy model
If office loans defaulted mainly because buildings lost tenants, delinquency should track vacancy closely, with a lag. We test this with annual data from 2008 to 2026, regressing the office CMBS delinquency rate on the national vacancy rate measured by Moody's Analytics. The relationship is positive and significant: each point of vacancy is associated with about one point of delinquency (p value 0.02). But vacancy alone explains only about a quarter of the variation (R squared 0.24). Adding a measure of the interest rate shock at refinancing, the difference between the ten-year yield in a given year and its level ten years earlier, when most maturing loans were originated, does not improve the fit in annual data, because the post-2008 crisis was driven by falling values in a period of falling rates.
Figure 3 shows the fitted and actual values. Until 2022, the model tracks the broad pattern, overestimating delinquency in the late 2010s and underestimating the peak of 2011 and 2012. Since 2024, the actual rate has risen far above the fitted value. In 2026, the model predicts about 9.2 percent; the actual rate is about 12.2 percent. The gap of three points is the largest positive residual in the sample.
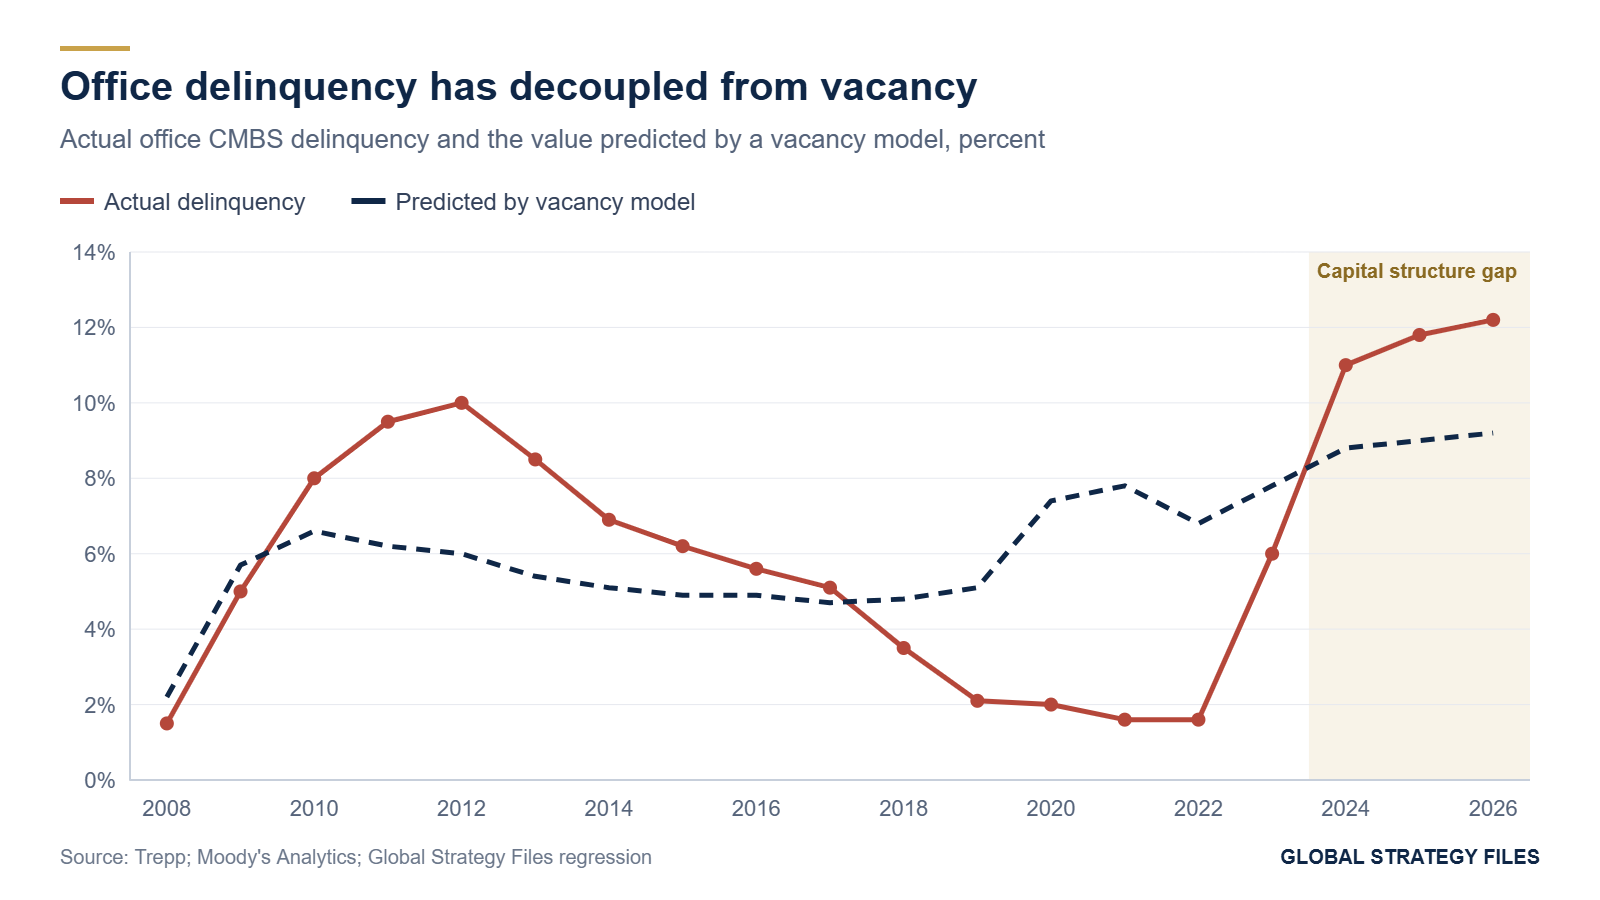
Table 2. What vacancy explains, and what it does not
| Year | Vacancy, Moody's (%) | Office delinquency, actual (%) | Predicted by vacancy model (%) | Gap (points) |
|---|---|---|---|---|
| 2012 | 17.1 | 10.0 | 5.9 | +4.1 |
| 2016 | 16.2 | 5.6 | 4.9 | +0.7 |
| 2019 | 16.8 | 2.1 | 5.1 | -3.0 |
| 2022 | 18.7 | 1.6 | 6.8 | -5.2 |
| 2024 | 20.4 | 11.0 | 8.8 | +2.2 |
| 2026 | 21.0 | 12.2 | 9.2 | +3.0 |
Source: Trepp; Moody's Analytics; Global Strategy Files regression of delinquency on vacancy and the refinancing rate gap, 2008 to 2026.
The pattern of the residuals is itself informative. In 2019 to 2022, delinquency was well below what vacancy would predict, because leases signed before the pandemic protected cash flows and because interest rates were low enough to make refinancing easy. In 2012 and again in 2024 to 2026, delinquency was well above, because loans were maturing into markets where values had collapsed. The residual is the capital structure problem.
3.2 A counterfactual
The model provides a useful counterfactual. If vacancy had stayed at its 2019 level of 16.8 percent, the predicted delinquency rate in 2026 would be about 4 percent. The rise in vacancy since 2019 therefore accounts for about 5 points of the increase in delinquency (from about 4 to 9.2 percent in the model), and the capital structure residual for about 3 points. The office loan crisis is roughly two thirds a demand shock that is now reversing and one third a refinancing shock that is not.
3.3 The direction of travel
The decoupling also has a dynamic dimension. Between the third quarter of 2025 and the third quarter of 2026, CBRE's vacancy rate fell by 0.6 points while office delinquency rose by about one point (from 11.13 percent in September 2025 to 12.16 percent in September 2026). Improving occupancy has not yet translated into fewer defaults, because the loans now maturing were underwritten years ago, and their fate depends on what the building is worth today relative to what it was worth then.
4. The refinancing problem by vintage
4.1 The arithmetic of a maturing office loan
Most office loans in commercial mortgage-backed securities have a term of ten years, with interest-only payments for much or all of the term and a balloon repayment at maturity. At maturity, the borrower must repay the loan, typically by refinancing. A new lender will lend only up to a certain share of the building's current value, typically 60 to 65 percent for office today, and only if the building's net operating income covers the interest on the new loan with a margin.
Consider a loan originated at 60 percent of the building's value. If the value has since fallen by 35 percent, the loan now represents 60 divided by 65, or about 92 percent of the value. To refinance at 65 percent loan-to-value, the borrower must repay the difference between the old loan and the new one, about 30 percent of the old loan, from new equity. Many owners cannot or will not do so, especially for older buildings whose prospects are uncertain. The loan then defaults at maturity, or is extended, modified or transferred to a special servicer.
4.2 Value declines by vintage
We approximate the path of office values with an index that rises from 100 in 2016 to a peak of 115 in 2022, consistent with the appreciation recorded by commercial property price indices before the rate shock, and falls by 38 percent to about 71 in 2026, consistent with reported declines in office values from their peak. Table 3 and Figure 4 show the implications for loans originated in each vintage at 60 percent loan-to-value.
Table 3. The refinancing gap for office loans by vintage
| Origination year | Value change to 2026 | Loan-to-value at 2026 values | New equity needed to refinance at 65 percent (share of loan) |
|---|---|---|---|
| 2016 | -29 percent | 84 percent | 23 percent |
| 2017 | -32 percent | 88 percent | 26 percent |
| 2018 | -34 percent | 91 percent | 28 percent |
| 2019 | -35 percent | 93 percent | 30 percent |
| 2021 | -36 percent | 94 percent | 31 percent |
| 2022 | -38 percent | 97 percent | 33 percent |
Source: Global Strategy Files calculations; stylized value index; 60 percent loan-to-value at origination; refinancing at 65 percent of current value.
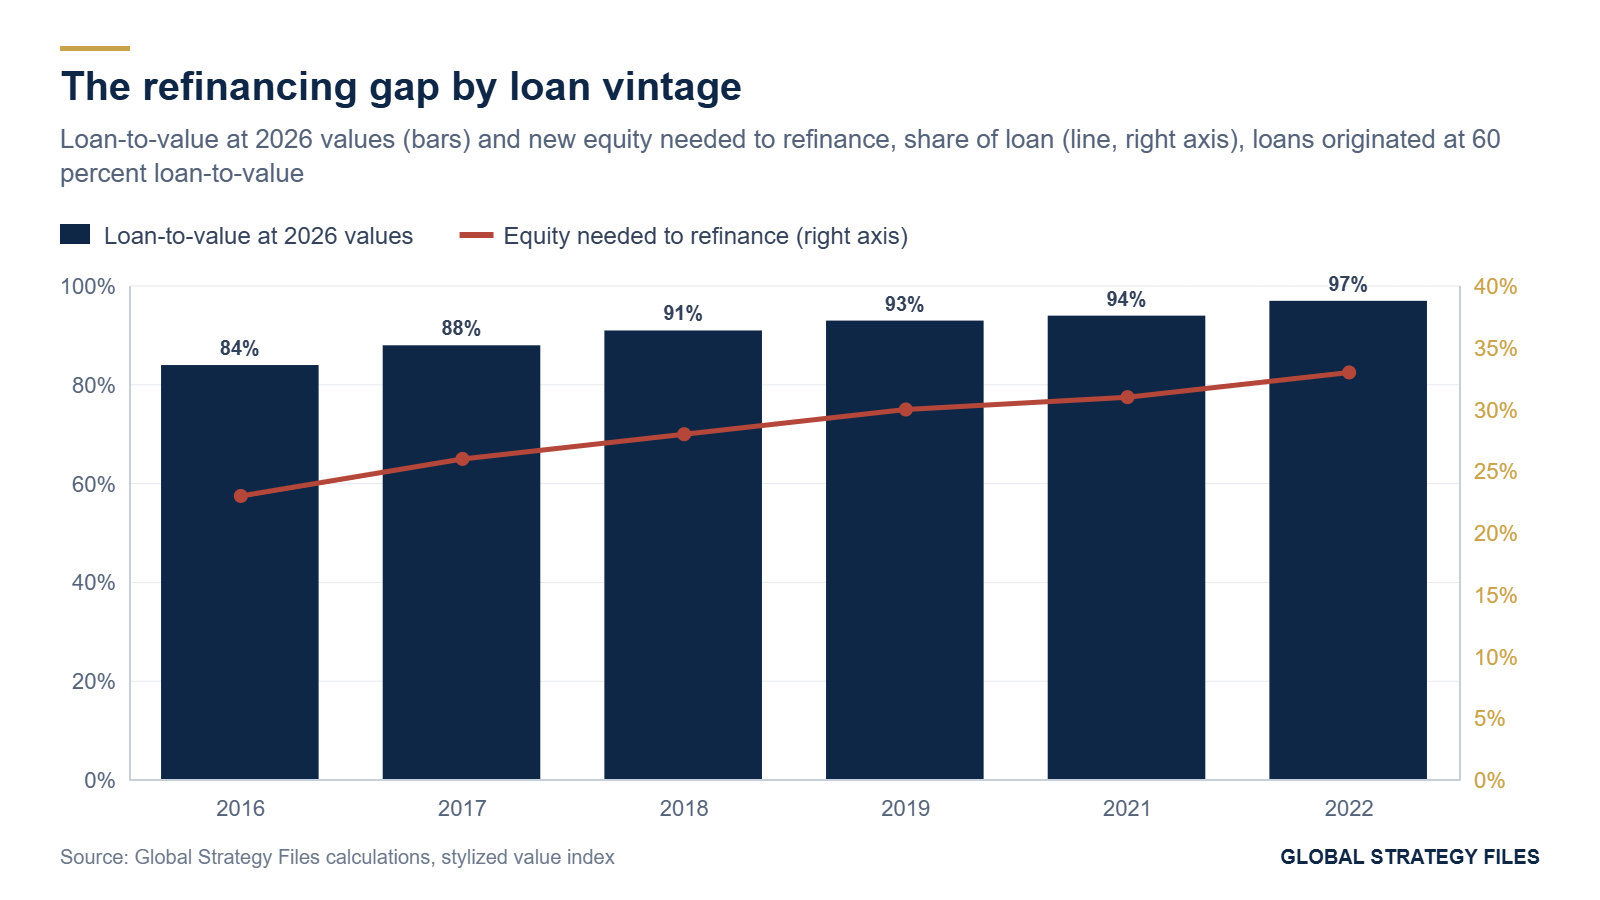
The table shows why the office crisis is not over even as leasing recovers. Every vintage of loans originated in the low-rate decade faces a substantial gap. The 2016 to 2017 vintages, which are maturing in 2026 and 2027, need new equity of about a quarter of the loan; the 2019 to 2022 vintages, which mature later or were made with shorter terms, need about a third. These numbers are for a typical loan; loans on older buildings in weak markets face much larger gaps, while loans on prime buildings in strong markets may face none.
4.3 The rate gap
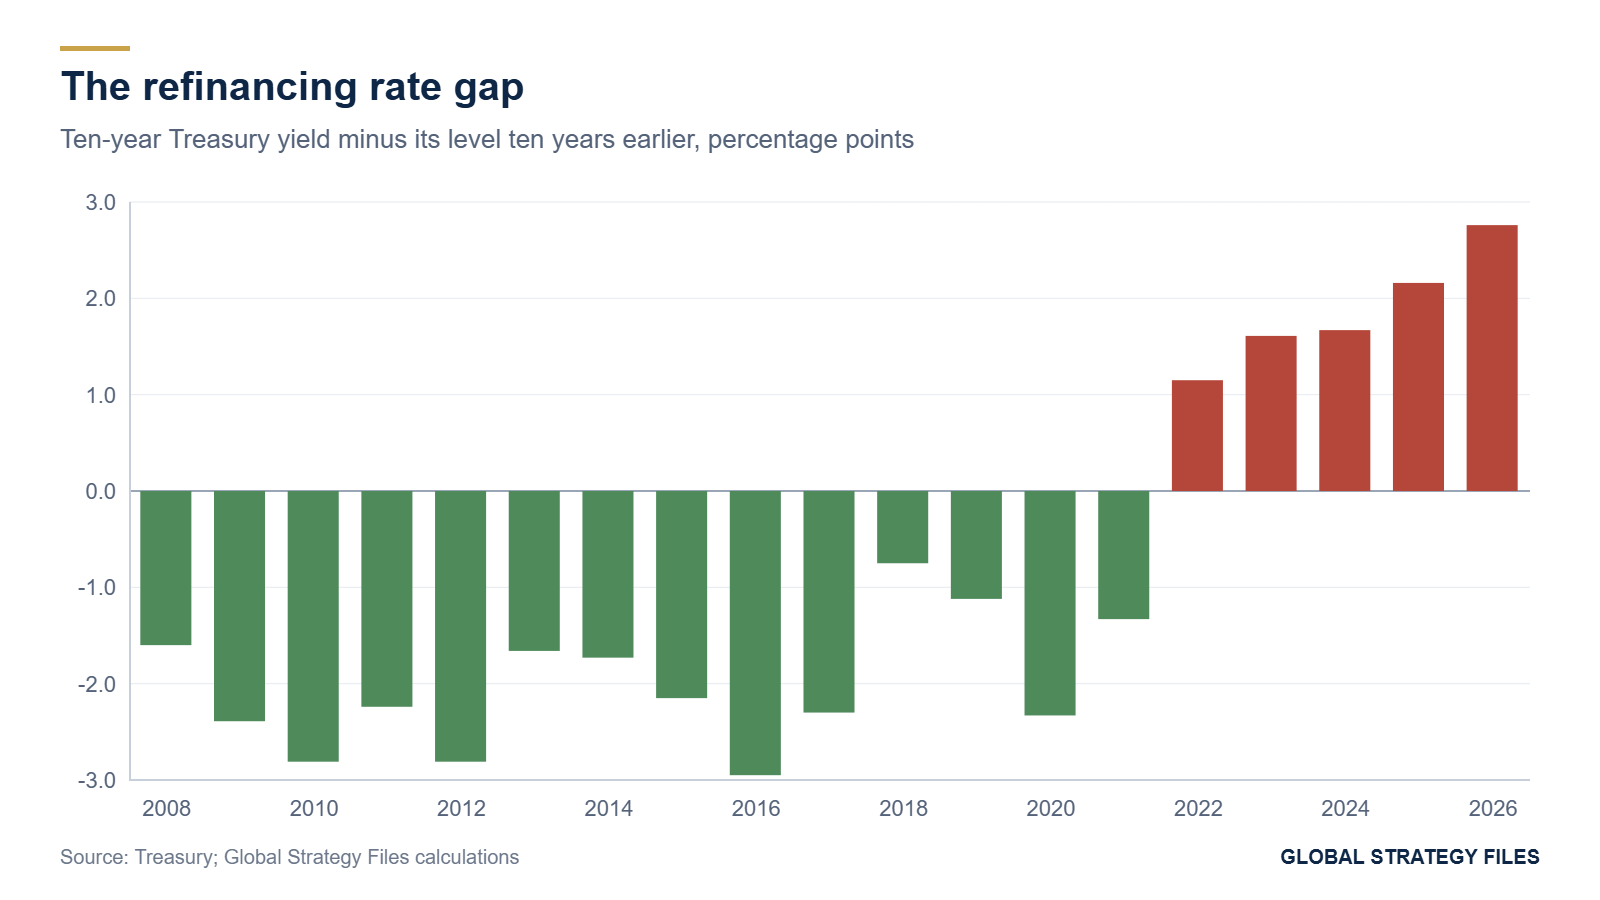
The second dimension of the refinancing problem is the cost of debt. Figure 5 shows the difference between the ten-year Treasury yield in each year and its level ten years earlier. For loans maturing between 2010 and 2021, this rate gap was negative, often by two to three points: borrowers refinanced into lower rates than those at which they had originally borrowed, which helped even owners of weakened buildings. Since 2022 the gap has been positive, and in 2026 it is about 2.8 points: the ten-year yield is about 4.6 percent, against 1.84 percent in 2016. A building whose income covered the interest on a loan at 4 percent may not cover it at 6.5 or 7 percent, even if its occupancy is unchanged.
4.4 The two-tier market
The vintage arithmetic applies with very different force to different buildings. The office market of 2026 is split between a prime tier, consisting of modern, amenity-rich buildings in central locations, and a commodity tier of older buildings with outdated systems and floor plates. The prime tier is where the recovery is concentrated. CBRE reports that prime vacancy fell by 2.5 points in a year to 11.9 percent, against 18.2 percent for the market as a whole, and to only 1.9 percent in Midtown Manhattan. Average asking rents rose 3.1 percent in a year, the fastest pace since 2016, but the gap between asking and achieved rents, at 9.9 percent, remains wider than the 8.6 percent of 2019, a sign that landlords outside the prime tier still have to offer concessions.
For prime buildings, values have stabilized and lenders are again willing to refinance, sometimes at lower bases. For commodity buildings, the decline in values is far larger than the national average, demand is still falling and refinancing is often impossible without a large equity injection that owners are unwilling to make. The national averages in Table 3 therefore understate the gap for the weakest buildings and overstate it for the strongest. The concentration of delinquent balances in a limited number of large loans, which Trepp has noted repeatedly, reflects this split: a few large loans on older trophy buildings that have lost their status account for a disproportionate share of the delinquent balance.
Two forces will narrow the gap over time. The first is the near absence of new supply: construction completions fell 76 percent in the third quarter of 2026 to 1.5 million square feet, and CBRE expects 2026 to record the lowest annual total since it began tracking in 1990. Without new buildings, demand for quality space will spill over into the better commodity buildings. The second is the removal of obsolete stock through conversion and demolition, which is accelerating in cities that have simplified approvals. Both forces work slowly, and neither helps the loans that mature in 2026 and 2027.
5. The equity gap and who bears it
5.1 The size of the hole
The Mortgage Bankers Association estimates that close to one trillion dollars of commercial mortgages were scheduled to mature in each of 2024, 2025 and 2026, a volume swollen by loans extended in previous years. Office loans account for roughly 15 percent of the 4.8 trillion dollars of commercial mortgage debt outstanding, or about 750 billion dollars. We assume that about 35 percent of office debt, some 260 billion dollars, matures between 2026 and 2028, including loans previously extended. Applying the equity gaps of Table 3, from 23 to 33 percent, gives a total refinancing hole of about 60 to 90 billion dollars on office debt maturing in the next three years.
Table 4. The office refinancing hole, 2026 to 2028
| Assumption | Low | Central | High |
|---|---|---|---|
| Office debt maturing 2026 to 2028 (billion dollars) | 262 | 262 | 262 |
| Equity gap (share of loan) | 23 percent | 28 percent | 33 percent |
| Refinancing hole (billion dollars) | 60 | 74 | 87 |
Source: Global Strategy Files estimates based on Mortgage Bankers Association data and Table 3.
5.2 How the hole is filled
A refinancing hole is not a loss in itself. It can be filled in four ways: by owners injecting new equity, by lenders accepting a loan modification or extension, by a sale of the building or the loan at a discount, or by foreclosure. In each case, someone recognizes a loss relative to the value of the original investment. The equity holders lose first, and in most office loans originated at 60 percent loan-to-value, the equity cushion of 40 percent has been largely or entirely wiped out by value declines of 30 to 40 percent. The remaining losses fall on lenders: the bondholders of commercial mortgage-backed securities, starting with the most junior tranches, and the banks, insurers and debt funds that hold whole loans.
In 2024 and 2025, many lenders chose to extend loans rather than recognize losses, a practice known as extend and pretend. In 2026, with more than 25 billion dollars of office loans in securities past their maturity date, lenders have increasingly moved to resolve them through sales and foreclosures, which is why losses are now being realized and why prices have become visible. The sale of the debt on 500 West Monroe in Chicago at about 76 percent below the previous purchase price is an extreme example, but it illustrates the scale of the repricing for older buildings in weak submarkets, where downtown vacancy reaches 27 percent.
5.3 The banks
Banks hold about half of commercial real estate debt, and smaller and regional banks hold a disproportionate share relative to their capital. The aggregate numbers are reassuring: a loss of 30 to 40 billion dollars on office loans held by banks, about half of our central estimate of the refinancing hole, would represent a small fraction of the capital of the American banking system, which exceeds 2 trillion dollars. But the losses are concentrated. Banks with commercial real estate loans above 300 percent of their capital, a threshold used by supervisors to identify concentration, are mostly community and regional banks, and some of them have large exposures to office buildings in specific metropolitan areas. For them, the office overhang is a constraint on lending and a source of earnings pressure that will last several years.
5.4 Beyond office: the next fronts
The office crisis is no longer the only source of stress in commercial real estate debt. In October 2026, Trepp reported that the delinquency rates of retail, office and multifamily loans all rose even as the headline rate fell, and the retail rate jumped by 63 basis points in a single month. Multifamily delinquency, which was negligible before 2023, reached 7.28 percent in the first quarter of 2026 according to the Mortgage Bankers Association, as apartment loans originated at very low cap rates in 2021 and 2022 face the same refinancing arithmetic as office loans, compounded by a record vacancy rate and falling rents in some Sun Belt markets. Mall loans carry a delinquency rate of about 11 percent. Figure 7 compares the main rates.
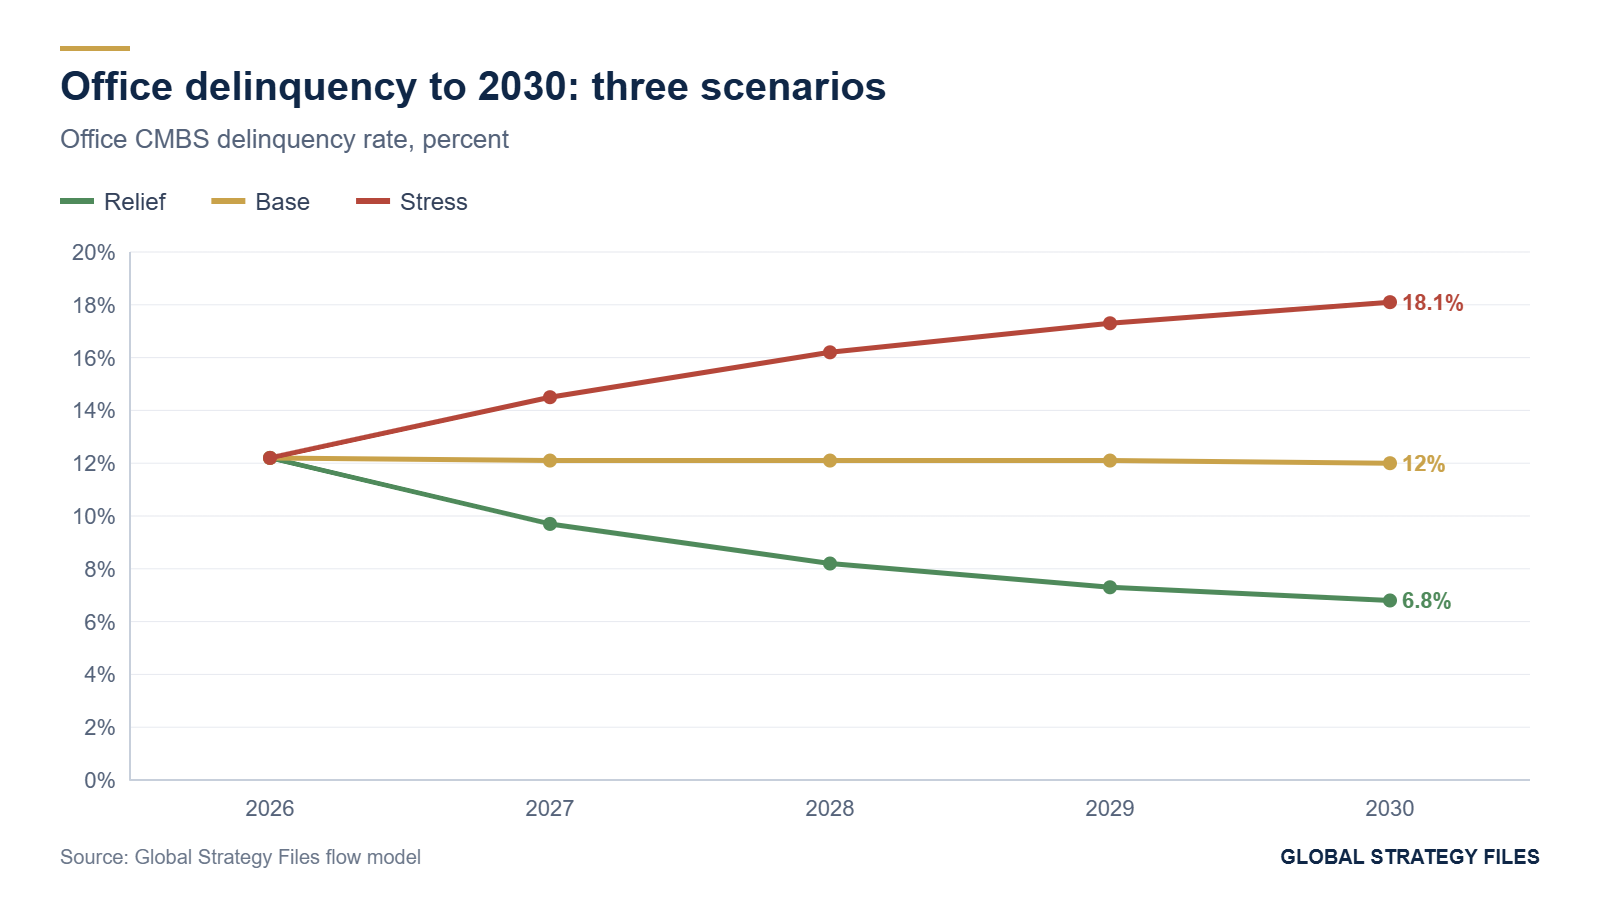
The common factor is not a collapse of demand, which differs across property types, but the maturity of loans written in the era of near-zero rates. Office was the first and most severe case because its demand shock coincided with the rate shock. Multifamily, where demand remains solid but supply surged and values were bid up most aggressively in 2021 and 2022, is the sector most likely to follow the office pattern in 2027 and 2028.
6. Scenarios for office delinquency to 2030
6.1 A simple flow model
To project the office delinquency rate, we use a simple flow model. Each year, a share of the office loan stock, about 12 percent, reaches maturity. A share of maturing loans fails to refinance and becomes delinquent: the maturity default rate. At the same time, a share of delinquent loans is resolved each year through modification, sale, foreclosure or cure: the resolution rate. The delinquency rate evolves as the previous rate times one minus the resolution rate, plus the share maturing times the maturity default rate. Calibrated to the 2026 delinquency rate of about 12.2 percent, the model implies a maturity default rate of about 35 percent and a resolution rate of about 35 percent a year.
6.2 Three scenarios
In the relief scenario, long-term interest rates decline and leasing continues to recover, which lowers the maturity default rate to 20 percent and raises the resolution rate to 40 percent as buyers return. In the base scenario, rates remain near current levels and the maturity default rate stays at 35 percent. In the stress scenario, ten-year yields rise above 5 percent and a recession weakens leasing, raising the maturity default rate to 50 percent and lowering the resolution rate to 30 percent.
Table 5. Office CMBS delinquency rate under three scenarios, percent
| Year | Relief | Base | Stress |
|---|---|---|---|
| 2026 | 12.2 | 12.2 | 12.2 |
| 2027 | 9.7 | 12.1 | 14.5 |
| 2028 | 8.2 | 12.1 | 16.2 |
| 2029 | 7.3 | 12.1 | 17.3 |
| 2030 | 6.8 | 12.0 | 18.1 |
| Long-run level implied | 6.0 | 12.0 | 20.0 |
Source: Global Strategy Files flow model.
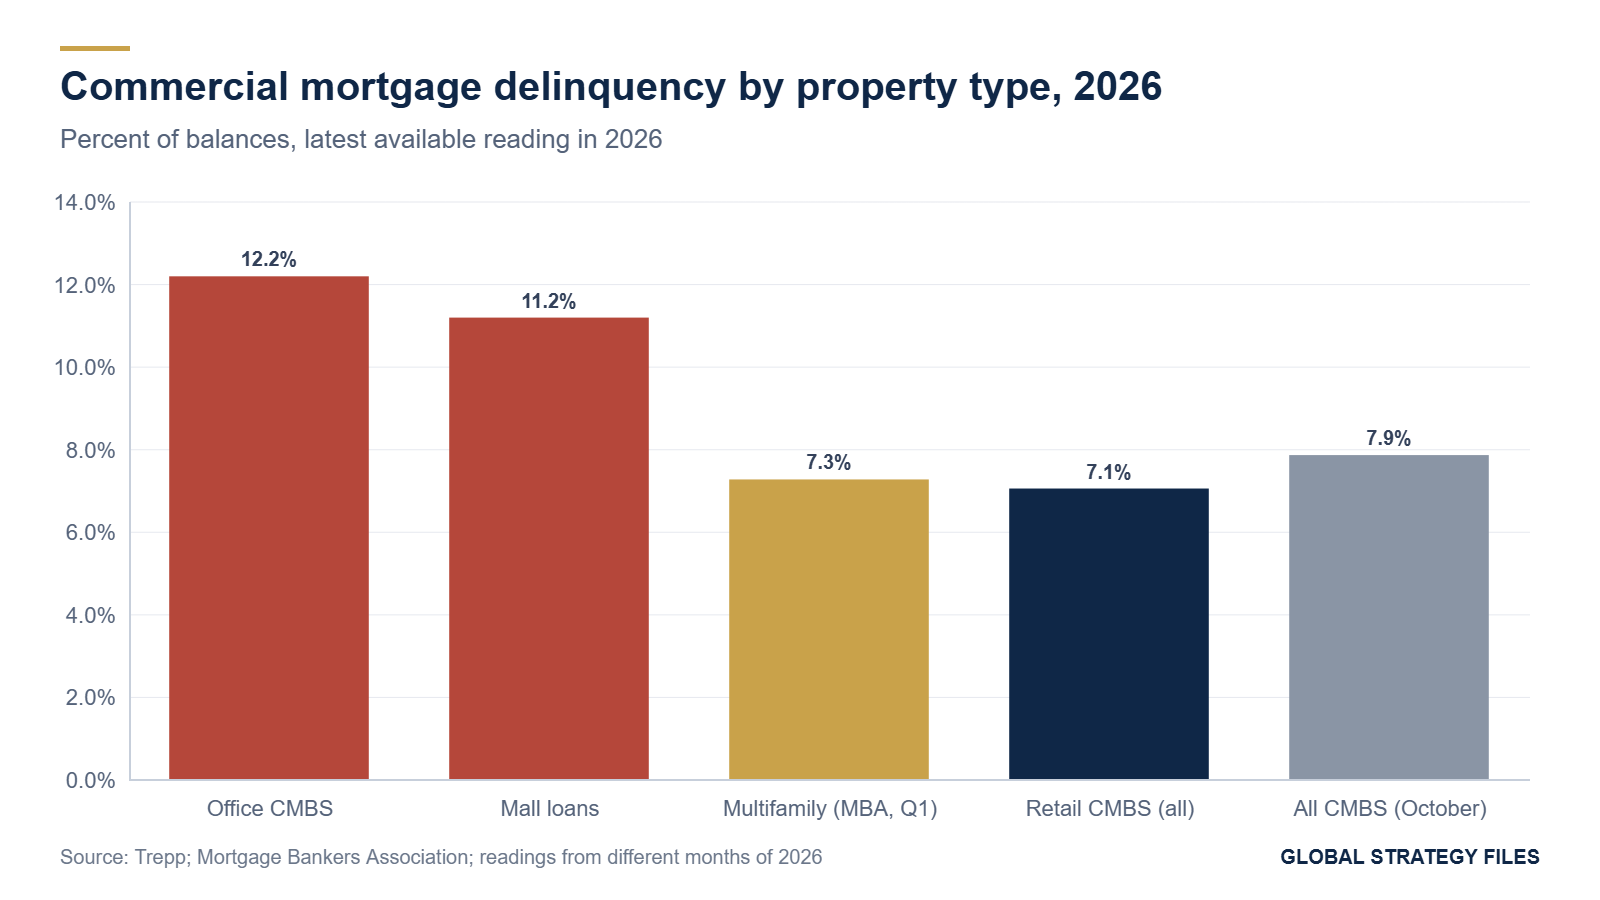
The scenarios show how much the outcome depends on interest rates rather than on occupancy. Even in the relief scenario, delinquency remains above 6 percent by 2030, three times the level of 2019, because the losses embedded in the loans of the low-rate decade must still be recognized. In the base scenario, delinquency stays near its record. The return of tenants is a necessary condition for the end of the office loan crisis, but it is not sufficient: the capital structure must also be repaired, and that requires either lower rates or the recognition of losses.
7. Implications
For banks and supervisors. The office overhang is a slow-moving problem concentrated in a minority of banks. Supervisors should focus on concentration, on the accuracy of collateral values and on the use of extensions to delay loss recognition. A sudden wave of failures is unlikely; a prolonged period of reduced lending capacity in some regions is likely.
For investors. The two-tier market creates opportunities. Prime buildings in strong markets are seeing rising rents and falling vacancy, while distressed loans on older buildings are trading at deep discounts. The repricing of debt at lower bases, visible in Chicago and Manhattan, is what allows a market to clear. Investors who buy at today's values can earn returns even if occupancy stays below pre-pandemic levels.
For cities. Falling office values reduce property tax revenue in downtowns that depend on commercial property, and the losses will be recognized over several years as assessments catch up with transaction prices. Cities that facilitate the conversion of obsolete office buildings to housing or other uses, and that reduce the time needed to obtain approvals, will shorten the adjustment.
For monetary policy. The office overhang adds a channel through which higher long-term rates affect the economy. With the Federal Reserve tightening and the term premium elevated, the refinancing gap remains open. A decline in long-term rates would do more to resolve the office loan crisis than any further improvement in leasing.
For the interpretation of data. Rising office delinquency in 2026 is not evidence of a renewed collapse in office demand. Analysts should read delinquency together with leasing and vacancy, and distinguish between the market for space, which is recovering, and the market for capital, which is still adjusting.
8. What is new in this study
To our knowledge, this study is the first to quantify the decoupling of office delinquency from office occupancy with twenty years of data, showing that a vacancy-based model underpredicts the 2026 delinquency rate by about three points, the largest residual in the sample, and that rising vacancy explains about two thirds of the increase since 2019. It provides a vintage-by-vintage calculation of the refinancing gap for office loans originated in 2016 to 2022 (23 to 33 percent of the loan), an estimate of the refinancing hole on office debt maturing in 2026 to 2028 (60 to 90 billion dollars), and a flow model of office delinquency to 2030 under three scenarios. The findings that office delinquency is at a record and that prime buildings are recovering faster than older ones confirm the reports of Trepp, CBRE and other market sources.
Methodological annex
Data. CMBS delinquency rates are from Trepp (annual end-of-period values, approximate for earlier years, and the monthly values reported for 2025 and 2026). Office vacancy is from Moody's Analytics (annual values, approximate) and CBRE (2026). Ten-year Treasury yields are annual averages.
Vacancy model. Ordinary least squares on 2008 to 2026: office delinquency = a + b times vacancy + c times rate gap, where the rate gap is the ten-year yield minus its value ten years earlier. Estimates: b = 1.26 (p value 0.09 with Newey-West errors), c = minus 0.30 (not significant); R squared 0.25. A model with vacancy alone gives b = 1.00 (p value 0.02), R squared 0.24.
Vintage calculation. Stylized office value index: 2016 = 100, 2017 = 105, 2018 = 108, 2019 = 110, 2021 = 112, 2022 = 115, 2026 = 71 (38 percent below the 2022 peak). Loan-to-value at origination 60 percent; refinancing at 65 percent of 2026 value. Equity gap = 1 minus (0.65 times current value) divided by (0.60 times original value).
Flow model. D(t+1) = D(t) times (1 minus r) + m times p, with m = 12 percent of loans maturing each year, p the maturity default rate and r the resolution rate. Base: p = 35 percent, r = 35 percent; relief: p = 20 percent, r = 40 percent; stress: p = 50 percent, r = 30 percent.
Limitations. CMBS data cover only part of office debt; bank loans may perform differently. The value index is stylized and national; local markets vary widely. The flow model ignores the distribution of maturities and the heterogeneity of buildings.
References
CBRE Research (2026). Q3 2026 U.S. Office Market Report. 23 October 2026.
Trepp (2026). CMBS delinquency reports, January to October 2026.
Trepp (2026). Sector hot spots emerge for CMBS default risk in 2026.
Moody's Analytics (2026). U.S. office market reports, first quarter 2026.
Mortgage Bankers Association (2026). Commercial real estate loan maturity volumes.
Bloomberg (2026). Office distress shifts from vacancies to investor losses. August 2026.
The Real Deal (2026). CMBS delinquencies hit record with 25 billion dollars past maturity. 17 February 2026.
Connect CRE (2026). Office vacancy eases in Q3 as new supply nears record lows. October 2026.
Scotsman Guide (2026). CMBS delinquencies reach highest level since 2020. October 2026.
Moody's Ratings (2026). Outlook for CMBS and CRE CLOs, 2026.
Driss EFFINA, PhD
Independent Researcher, Global Strategy Files
The opening pages of our four country reports: United States, United Kingdom, Japan and China. A free PDF, sent to your inbox.
You will also receive occasional analysis from Global Strategy Files. Unsubscribe in one click, at any time.