The Retreat of the Official Holder: Who Buys American Debt Now, and at What Price?

Abstract
For most of the past two decades, the financing of American deficits rested on two buyers who did not care much about price: foreign central banks, which accumulated dollar reserves, and, after 2008, the Federal Reserve, which bought Treasuries to ease monetary policy. In 2026 both have stepped back at the same time. Foreign holdings of Treasury securities reached a record of about 9.3 trillion dollars, but their share of federal debt held by the public fell from about 48 percent in 2014 to about 29 percent, and the official sector's share of those foreign holdings fell from about two thirds to about 42 percent. The Federal Reserve's share, which peaked above 25 percent in 2021, is back near 13 percent after three years of quantitative tightening. This study rebuilds the ownership of American public debt from 2006 to 2026 and documents a structural shift: price-sensitive investors, domestic and foreign private holders who demand compensation for risk, now hold about three quarters of the debt, the highest share in the twenty-year record, against 48 percent in 2014. Over the same period, the ten-year term premium rose from about minus 0.9 percentage points in 2020 to about 0.85 points in 2026, and net interest rose from 7.6 percent of federal revenue in 2014 to about 19.4 percent. We show that the twenty-year variation of the term premium is explained much better by the Federal Reserve's share of the debt (each percentage point is associated with about 11 basis points less term premium) than by the foreign official share, whose decline has been gradual and offset by foreign private buyers. The rise in the term premium since 2021 is therefore best described as the end of the Federal Reserve's support combined with the loss of the official cushion, which leaves private investors to absorb 6 to 10 percent of GDP of new debt every year. We decompose the 821 billion dollar rise in annual net interest between 2014 and 2026 into a debt effect (about 350 billion) and a rate effect (about 471 billion), estimate that each 10 basis points of term premium costs about 32 billion dollars a year once the debt has repriced, and project that, with foreign holdings flat, private domestic investors will have to absorb about 6 percent of GDP a year through 2030.
Key findings
- Foreign holdings of Treasuries rose from 2.1 trillion dollars in 2006 to about 9.3 trillion in 2026, but their share of debt held by the public fell from a peak of 53 percent in 2008 to about 29 percent.
- The official sector (central banks and governments) now holds about 42 percent of foreign holdings, against about 66 percent in 2006 and 72 percent in 2011 to 2012. Official holdings represent about 12 percent of public debt, against 32 to 36 percent in 2008 to 2014.
- Price-sensitive investors hold about 75 percent of the debt in 2026, the highest share in twenty years, against 48 percent in 2014 and 55 percent in 2021.
- Over 2006 to 2026, the term premium is significantly related to the Federal Reserve's share of the debt (about minus 11 basis points per percentage point) but not to the foreign official share.
- Of the 821 billion dollar increase in annual net interest between 2014 and 2026, about 350 billion reflects the larger debt and about 471 billion the higher average interest rate.
- Each 10 basis points of term premium costs about 32 billion dollars a year once the debt has fully repriced, about 5 billion in the first year.
- With foreign holdings flat, domestic private investors would have to absorb about 6 percent of GDP of new debt each year from 2027 to 2030, against an average of about 3.5 percent in 2011 to 2019.
1. Introduction: the buyer of last resort is leaving
In March 2026, in the weeks after the outbreak of war with Iran and the closure of the Strait of Hormuz, foreign central banks sold Treasuries for five consecutive weeks. The Treasury securities that the Federal Reserve holds in custody for foreign official institutions fell by more than 90 billion dollars, to their lowest level since 2012, and the ten-year yield rose by 35 basis points in a single month. The episode was a reminder of an old fear: that the foreign official holders who financed American deficits for decades might one day become sellers.
The broader data tell a more nuanced story. Foreign holdings of Treasuries were close to a record in mid-2026, about 9.3 trillion dollars in June, because foreign private investors, pension funds, insurers, banks and asset managers in Japan, the United Kingdom, Europe and offshore centers, bought more than official holders sold. Foreign private investors bought a net 329 billion dollars of medium and long-term Treasuries in the twelve months to June 2026, less than in the previous year but still a large amount. China, once the largest creditor of the United States, has fallen to third place behind Japan and the United Kingdom. Foreign central banks have been rotating part of their reserves into gold, whose value in their portfolios exceeded their holdings of Treasuries for the first time in September 2025.
The question this study asks is not whether foreigners are selling, but who now buys American debt, and at what price. We rebuild the ownership of federal debt held by the public from 2006 to 2026 by four groups of holders: the Federal Reserve, foreign official institutions, foreign private investors and domestic private investors. We measure the share of the debt held by price-sensitive investors, the absorption burden that new borrowing places on them, and the relationship between ownership and the term premium, the extra yield investors demand to hold long-term rather than short-term debt. We then estimate the fiscal cost of the shift and project it to 2030.
The central argument is that the United States has moved from a financing regime in which a majority of its debt was held by investors who bought for policy reasons, to one in which three quarters is held by investors who buy for return. The transition is not a crisis, and the dollar's role makes a disorderly loss of demand unlikely. But it changes the price of debt, and with deficits of about 6 percent of GDP and debt above 100 percent of GDP, the price has become the largest single driver of the budget outlook.
2. Twenty years of debt ownership
2.1 The rise and relative decline of foreign holdings
Figure 1 shows foreign holdings of Treasury securities and their share of federal debt held by the public. In 2006, foreigners held about 2.1 trillion dollars, 44 percent of the debt. Their holdings tripled in six years, to about 5.6 trillion dollars in 2012, as China, Japan and oil exporters accumulated reserves and as the financial crisis drove a flight to safety. Their share peaked at about 53 percent in 2008 and stayed near 48 to 49 percent until 2014.

Since 2014, foreign holdings have continued to grow in dollars, to about 7.1 trillion in 2020, 8.6 trillion in 2024 and about 9.3 trillion in 2026, but much more slowly than the debt. Debt held by the public rose from 12.8 trillion dollars in 2014 to 21 trillion in 2020 and about 32.3 trillion in 2026. As a result, the foreign share fell to about 34 percent in 2020, 31 percent in 2024 and 29 percent in 2026. The United States has not lost foreign demand; it has outgrown it.
2.2 The changing nature of foreign demand
The composition of foreign holdings has changed even more than their size. In 2006, official institutions, mainly central banks managing foreign exchange reserves, held about two thirds of foreign holdings. Their share rose to about 72 percent in 2011 and 2012, then declined steadily: to about 59 percent in 2020 and about 42 percent in 2026, according to the Treasury's survey of foreign portfolio holdings, which shows the official share falling from 59 percent in 2020 to 43 percent most recently. Private foreign investors now hold the majority.
The distinction matters because official and private holders behave differently. Central banks hold Treasuries as reserves, for liquidity and safety, and their purchases are driven by exchange rate policy and trade surpluses rather than by yields. Private investors compare Treasuries with other assets, hedge their currency exposure at a cost that depends on interest rate differentials, and sell when expected returns fall. A dollar of debt held by a foreign pension fund is more sensitive to price than a dollar held by a foreign central bank.
2.3 The Federal Reserve: buyer and seller
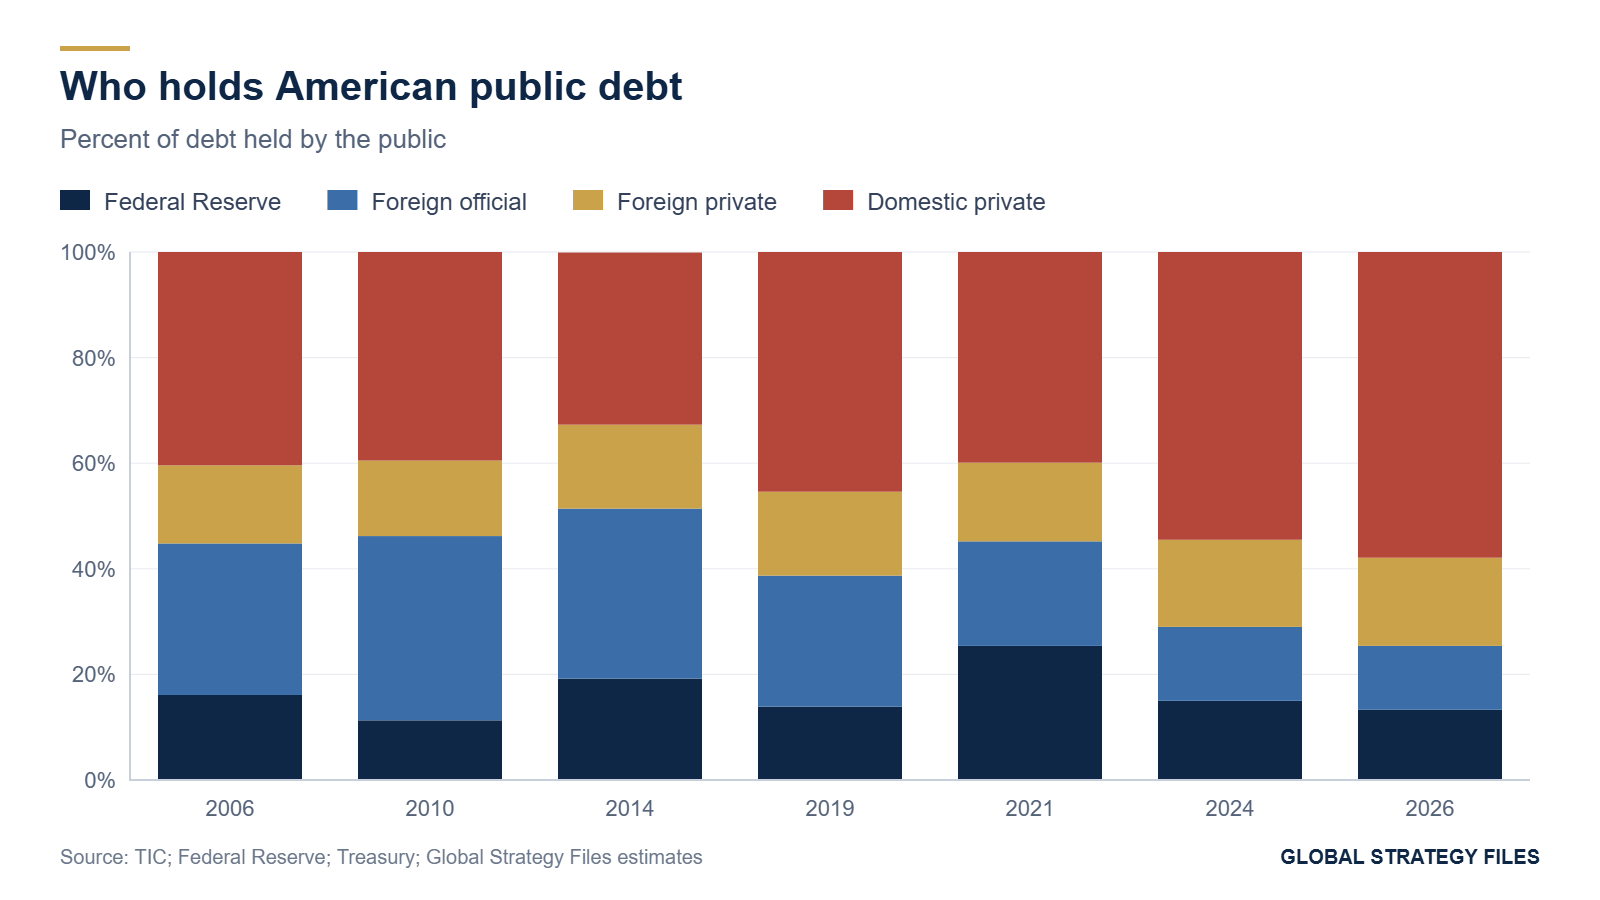
The third actor is the Federal Reserve. Its holdings of Treasuries rose from about 0.5 trillion dollars at the end of 2008 to about 2.5 trillion in 2014 through three rounds of quantitative easing, declined slightly during the first quantitative tightening of 2018 and 2019, jumped to 5.65 trillion dollars at the end of 2021 after the pandemic purchases, and have fallen since 2022 to about 4.2 to 4.3 trillion in 2025 and 2026. As a share of the debt, the Federal Reserve held 16 percent in 2006, 19 percent in 2014, a peak of 25 percent in 2021 and about 13 percent in 2026.
Table 1. Who holds American public debt, selected years, percent of debt held by the public
| Year | Debt held by the public (trillion dollars) | Federal Reserve | Foreign official | Foreign private | Domestic private | Price-sensitive total |
|---|---|---|---|---|---|---|
| 2006 | 4.8 | 16.1 | 28.7 | 14.8 | 40.4 | 55.2 |
| 2010 | 9.0 | 11.3 | 34.9 | 14.3 | 39.5 | 53.7 |
| 2014 | 12.8 | 19.2 | 32.2 | 15.9 | 32.6 | 48.5 |
| 2019 | 16.8 | 13.9 | 24.8 | 15.9 | 45.4 | 61.3 |
| 2021 | 22.3 | 25.4 | 19.8 | 14.9 | 39.9 | 54.8 |
| 2024 | 28.3 | 15.0 | 14.0 | 16.5 | 54.5 | 71.0 |
| 2026 | 32.3 | 13.3 | 12.1 | 16.7 | 57.9 | 74.6 |
Source: Treasury International Capital system; Federal Reserve H.4.1 and Financial Accounts; Treasury Monthly Statement of the Public Debt; Global Strategy Files estimates of the official share for years between Treasury surveys.
3. The rise of the price-sensitive holder
3.1 Three quarters of the debt
Adding foreign private and domestic private holders gives the share of the debt held by investors who buy for return rather than for policy. Figure 3 shows this price-sensitive share from 2006 to 2026. It was about 55 percent before the financial crisis, fell to about 48 percent in 2011 to 2014, when the Federal Reserve and foreign central banks together held more than half the debt, rose to about 61 percent in 2018 and 2019, fell back to 55 percent in 2021 at the peak of pandemic purchases, and has risen every year since, to about 71 percent in 2024 and 75 percent in 2026. This is the highest level in the twenty-year record.
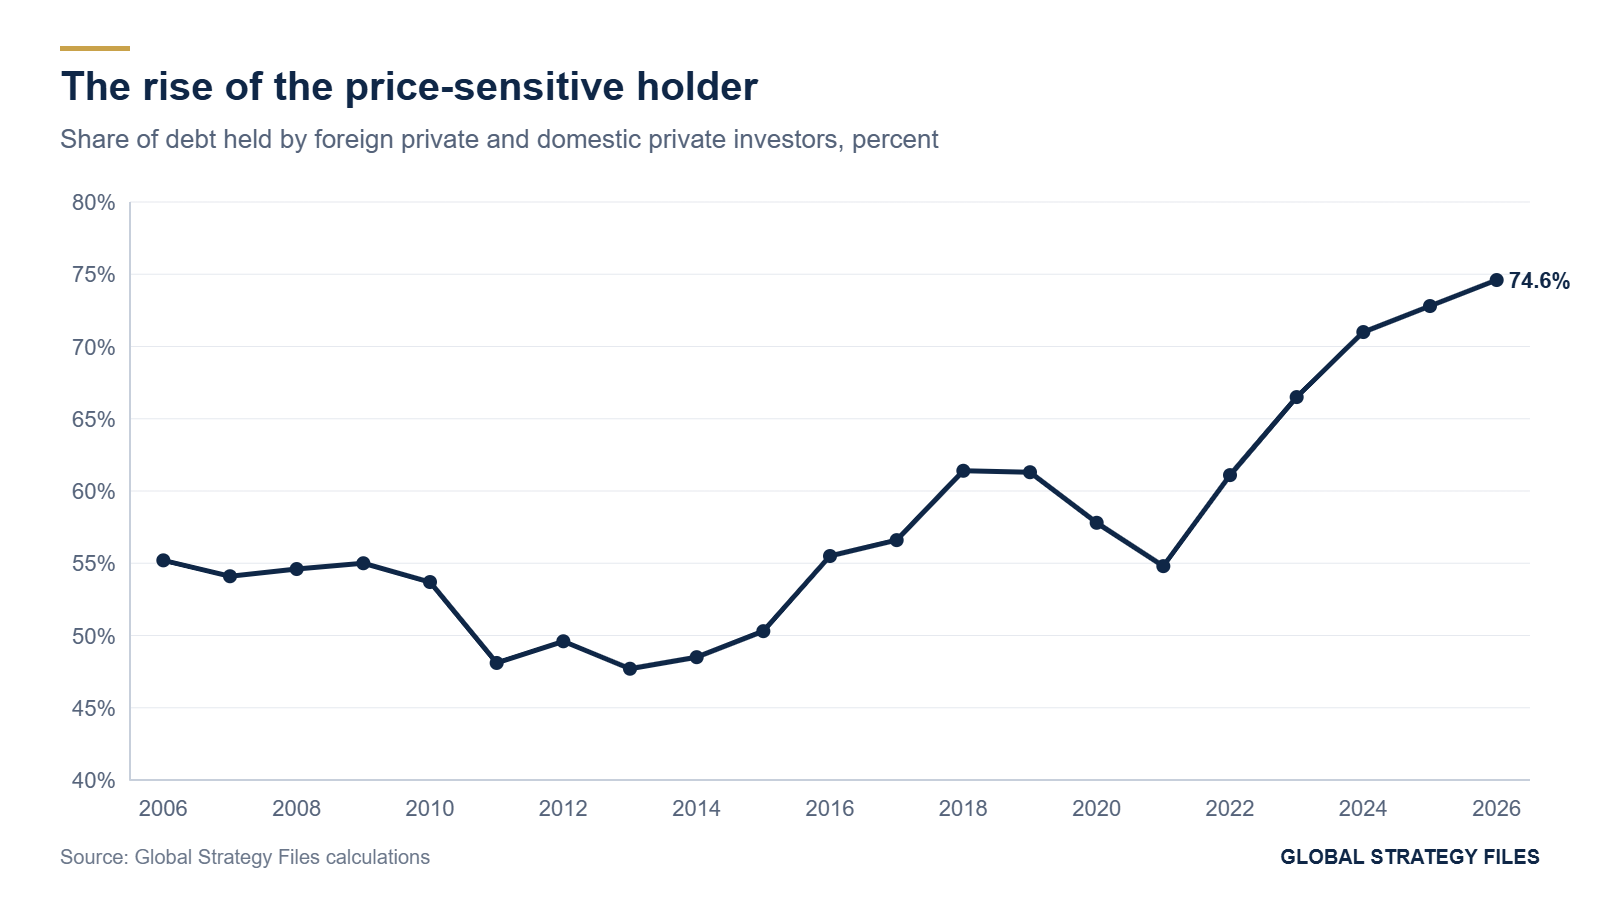
The domestic private component explains most of the increase. Households, mutual funds, money market funds, banks, insurers, pension funds and hedge funds held about 33 percent of the debt in 2014 and hold about 58 percent in 2026. Some of these investors, notably banks and money market funds, buy mainly short-term instruments; others, notably hedge funds engaged in basis trades, hold large positions financed with leverage and can be forced to sell in periods of stress.
3.2 The absorption burden
The share of the stock is a static measure. What matters for prices each year is how much new debt price-sensitive investors must absorb. We define the absorption burden as the increase in debt held by the public minus the increase in holdings of the Federal Reserve and of foreign official institutions, expressed as a percentage of GDP. Figure 4 shows it.
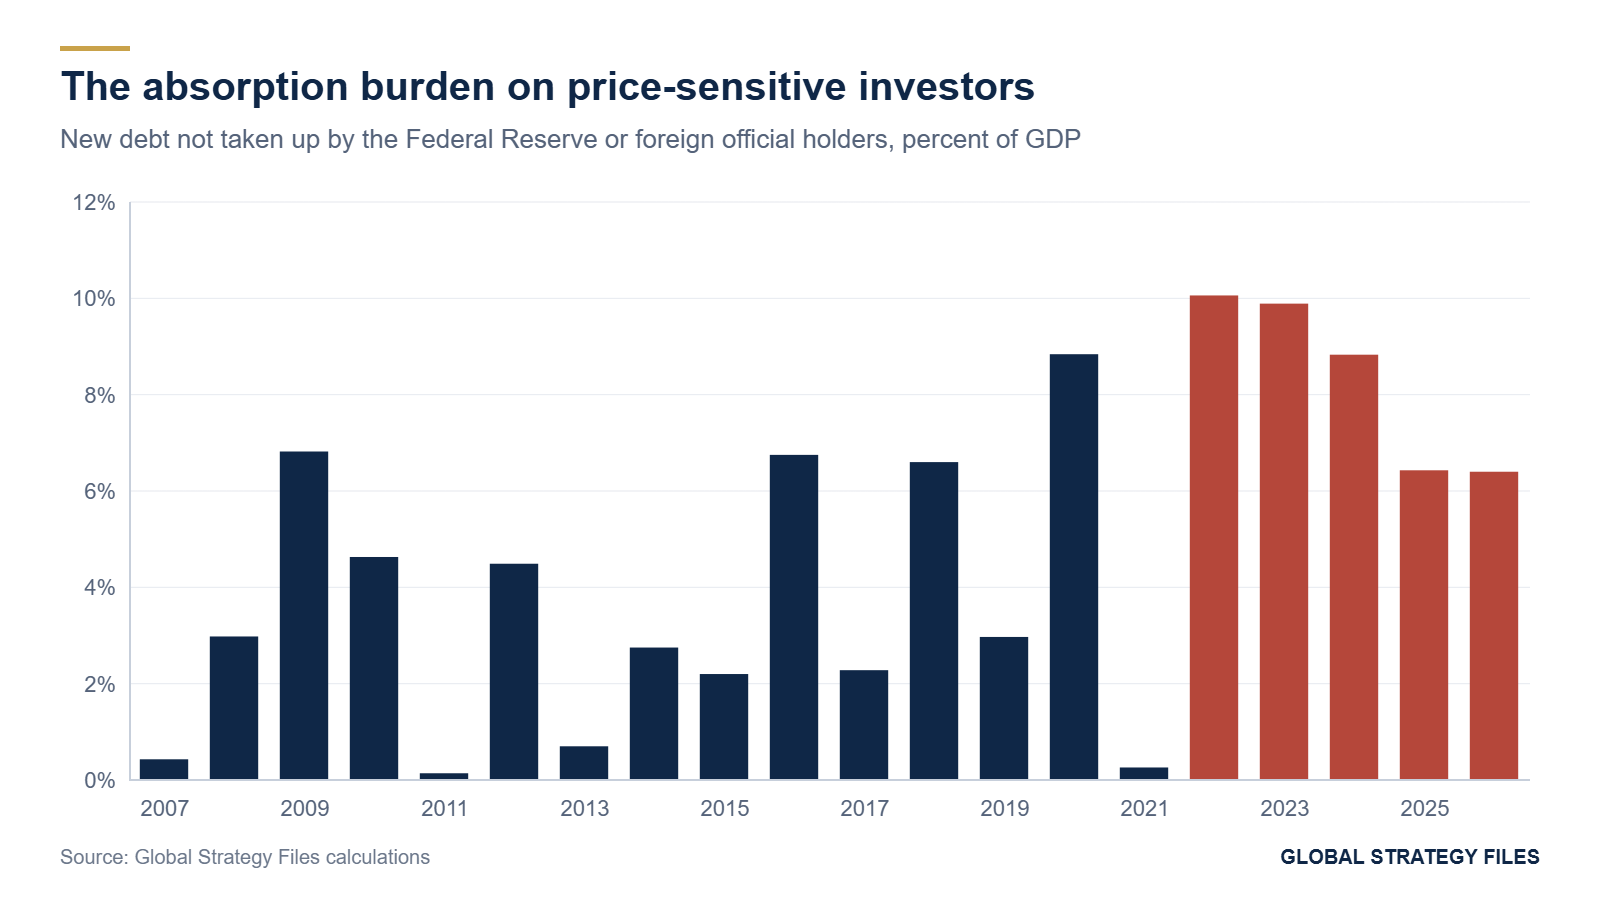
Between 2011 and 2019, the absorption burden averaged about 3.5 percent of GDP, with peaks in years when the Federal Reserve was shrinking its portfolio (2016 to 2018). In 2020 it reached 8.8 percent despite record purchases by the Federal Reserve, because the deficit was so large, and it fell to almost zero in 2021, when the Federal Reserve bought more than the Treasury issued to the private market. Since 2022, it has stayed above 6 percent of GDP for five consecutive years: 10.1 percent in 2022, 9.9 percent in 2023, 8.8 percent in 2024, 6.4 percent in 2025 and 6.4 percent in 2026. No five-year period in the twenty-year record comes close.
3.3 Why the official holder retreated
The decline of foreign official demand has several causes. Global reserve accumulation slowed after 2014, as China stopped intervening to hold down its currency and oil exporters ran smaller surpluses. Some central banks diversified into other currencies and, increasingly, into gold; central bank gold holdings rose to about 5.1 trillion dollars by January 2026, exceeding their Treasury holdings. The freezing of Russian reserves in 2022 raised the perceived political risk of holding reserves in Western assets. And in episodes of stress, such as March 2026, central banks sell Treasuries to defend their currencies or to meet dollar needs, which makes official demand pro-cyclical in exactly the moments when the market needs stable buyers.
3.4 Three stress episodes compared
The behavior of official holders in moments of stress is more revealing than their trend. Table 2 compares three episodes in which the Treasury market came under pressure. In March 2020, at the onset of the pandemic, foreign official institutions sold Treasuries on a large scale to raise dollars, and the market functioned only after the Federal Reserve bought more than one trillion dollars of securities in a few weeks and opened a repurchase facility for foreign central banks. In April 2025, after the announcement of broad tariffs, long-term yields rose sharply while the dollar fell, an unusual combination that many analysts attributed to selling by foreign and leveraged investors. In March 2026, after the closure of the Strait of Hormuz, foreign central banks sold for five consecutive weeks, cutting custody holdings at the New York Fed by more than 90 billion dollars, and auctions of two, five and seven-year notes drew weak demand.
Table 2. Official holders in three episodes of Treasury market stress
| Episode | Trigger | Behavior of foreign official holders | Response of the Federal Reserve | Outcome for yields |
|---|---|---|---|---|
| March 2020 | Pandemic, dash for cash | Large sales to raise dollars | Purchases above 1 trillion dollars; repo facility for central banks | Yields fell after intervention |
| April 2025 | Broad tariff announcement | Selling by foreign and leveraged investors | No intervention | Long yields up sharply, dollar down |
| March 2026 | War with Iran, Hormuz closure | Five weeks of sales, custody holdings lowest since 2012 | No asset purchases; standing facilities available | Ten-year yield up 35 basis points in the month |
Source: Federal Reserve; press reports; Global Strategy Files summary.
The three episodes share a pattern. Foreign official holders behaved as sellers, not as stabilizers, because their own needs for dollar liquidity rose at the same time as the market's. The difference between the episodes lies in the response of the Federal Reserve. In 2020 it acted as buyer of last resort and the stress dissipated. In 2025 and 2026, with inflation above target, it did not, and the adjustment took place through higher yields. The lesson is that the official holder is a fair-weather cushion: it supports the market in normal times and withdraws in crises. The true backstop of the Treasury market is now the Federal Reserve, and its willingness to act depends on the inflation outlook.
4. Ownership and the price of debt
4.1 The term premium in twenty years
The ten-year Treasury yield can be decomposed into the expected average of future short-term rates and a term premium, the extra compensation investors require for holding a long bond rather than rolling over short bills. Estimates of the term premium from the models of Adrian, Crump and Moench, used by the New York Fed, show a premium of about zero before the financial crisis, a peak of about 1.6 points in 2009, a long decline to negative values from 2016 to 2022 (as low as about minus 0.9 points in 2020), and a rise since 2023 to about 0.6 points in 2025 and about 0.85 points in 2026. Most current estimates put the ten-year premium in a range of 80 to 100 basis points. The ten-year yield reached 5.01 percent in mid-September 2026, around its highest level since 2007, and the thirty-year yield was near 5.3 percent.
4.2 What the data say
We test the relationship between ownership and the term premium with annual data from 2006 to 2026. Table 3 reports the main specifications. The most robust result concerns the Federal Reserve. Across specifications, each percentage point of debt held by the Federal Reserve is associated with a term premium about 11 basis points lower, with high statistical significance. This is consistent with the large literature on quantitative easing, which finds that central bank purchases of long-term bonds lower term premiums by removing duration risk from private portfolios.
The foreign official share, by contrast, has no significant relationship with the term premium in annual data. Its coefficient is small and of the wrong sign. Neither does the share of price-sensitive holders, nor the absorption burden, whether measured annually or as a rolling average. A crisis dummy for 2008 to 2010 captures the high premium of the financial crisis.
Table 3. Ownership and the ten-year term premium, annual data 2006 to 2026
| Specification | Coefficient | p value | R squared |
|---|---|---|---|
| Federal Reserve share (with foreign official share and deficit) | -0.107 | below 0.001 | 0.52 |
| Foreign official share (same regression) | 0.019 | 0.20 | |
| Deficit as percent of GDP (same regression) | 0.045 | 0.19 | |
| Federal Reserve share (with three-year average absorption) | -0.117 | below 0.001 | 0.42 |
| Price-sensitive share, 2013 to 2026 only | 0.015 | 0.55 | 0.05 |
| Absorption burden, annual change in premium | 0.022 | 0.30 | 0.03 |
Source: Global Strategy Files estimates; Newey-West standard errors. The term premium is an annual average of model-based estimates and is approximate.

4.3 Interpreting a non-result
Why does the retreat of foreign official holders, which was large, leave no clear trace in the term premium, while the Federal Reserve's purchases do? Three reasons stand out. First, the official retreat was gradual, spread over twelve years, and it was offset in most years by foreign private buyers, whose share of the debt has stayed around 15 to 17 percent throughout the period. Second, foreign official institutions hold mostly short and intermediate maturities, so their retreat removed less duration from the market than the Federal Reserve's purchases of long bonds added. Third, in the years when the official retreat was fastest, from 2015 to 2019, the Federal Reserve and global investors were operating in a world of negative term premiums driven by low inflation and abundant global savings.
The non-result does not mean that foreign official demand is irrelevant. It means that its effect is conditional. When the Federal Reserve is buying, the official retreat is absorbed without visible cost. When the Federal Reserve stops buying and starts shrinking its portfolio, as in 2022 to 2025, the retreat of the official holder adds to the burden on private investors at the worst moment. The rise in the term premium since 2021, about 1.75 points from trough to 2026, coincides with a fall of about 12 points in the Federal Reserve's share and about 8 points in the foreign official share. At the Federal Reserve coefficient, the decline in its share alone accounts for about 1.3 points of the increase. The foreign official retreat is best understood as the loss of the cushion that would otherwise have softened that shock.
5. The fiscal cost
5.1 Debt or rates?
Net interest on the federal debt rose from about 229 billion dollars in fiscal 2014 to about 1.05 trillion in fiscal 2026, from 7.6 percent of federal revenue to about 19.4 percent. Figure 6 shows the effective interest rate on the debt, net interest divided by debt held by the public, and the share of revenue absorbed by interest. The effective rate fell from about 4.7 percent in 2006 to a low of about 1.6 percent in 2020 and 2021, and has since doubled to about 3.25 percent.

We decompose the 821 billion dollar increase in annual net interest between 2014 and 2026 into two parts. If the effective rate had stayed at its 2014 level of 1.79 percent, the larger debt would have raised interest by about 350 billion dollars. The rise in the effective rate, from 1.79 to 3.25 percent, applied to the 2026 debt, accounts for the remaining 471 billion dollars. More than half of the increase in interest costs is therefore a price effect, and the term premium is part of that price.

5.2 The cost of a basis point
Because the average maturity of marketable debt is about six years, a change in long-term yields reaches the interest bill gradually, as debt is refinanced. With debt held by the public of about 32.3 trillion dollars, a permanent increase of 10 basis points in the yields at which the Treasury borrows adds about 32 billion dollars a year to net interest once the entire debt has been refinanced, and about 5 billion in the first year. An increase of 100 basis points in the term premium, comparable to the change between 2021 and 2026, would add about 320 billion dollars a year at full pass-through, about one percent of GDP.
Table 4. The interest cost of the term premium
| Increase in yields | First year (billion dollars) | After three years | After five years | Full pass-through |
|---|---|---|---|---|
| 10 basis points | 5 | 16 | 27 | 32 |
| 50 basis points | 27 | 81 | 135 | 162 |
| 100 basis points | 54 | 162 | 269 | 323 |
Source: Global Strategy Files calculations; debt held by the public of 32.3 trillion dollars; average maturity of six years, linear repricing.
6. Scenarios to 2030
6.1 Assumptions
We project the ownership of the debt from 2027 to 2030 assuming that debt held by the public grows by about 2.2 trillion dollars a year, in line with deficits of about 6 percent of GDP, to about 41 trillion dollars in 2030, and that nominal GDP grows by about 4.3 percent a year. The Federal Reserve, having ended quantitative tightening and resumed purchases of bills for reserve management, adds about 100 billion dollars a year. We consider three paths for foreign holdings: growth of 4 percent a year, close to the 2023 to 2026 average; no growth; and a decline of 2 percent a year, a scenario of sustained official selling not offset by private buyers.
6.2 Results
Table 5 and Figure 8 summarize the results. In all three scenarios, the foreign share of the debt continues to fall, to between 21 and 27 percent by 2030. The absorption burden on domestic private investors remains between 4.5 and 7 percent of GDP a year, well above the 2011 to 2019 average of 3.5 percent. Even in the favorable scenario, domestic investors must absorb about 1.6 to 1.8 trillion dollars of new debt each year.
Table 5. Foreign holdings and the domestic absorption burden, 2027 to 2030
| Scenario | Foreign share of debt, 2030 (%) | Domestic private absorption, 2027 (% of GDP) | Domestic private absorption, 2030 (% of GDP) |
|---|---|---|---|
| Foreign holdings grow 4 percent a year | 26.5 | 5.2 | 4.5 |
| Foreign holdings flat | 22.6 | 6.3 | 5.6 |
| Foreign holdings decline 2 percent a year | 20.9 | 6.9 | 6.1 |
Source: Global Strategy Files projections.

6.3 What it means for yields
Our regressions do not allow us to translate the absorption burden directly into a term premium, because the twenty-year data show no stable relationship once the Federal Reserve's share is controlled for. The scenarios nevertheless point to two risks. The first is gradual: with the Federal Reserve no longer buying long-term debt and the official cushion shrinking, the term premium is unlikely to return to the negative values of the 2010s, and each 10 basis points of durable premium costs about 32 billion dollars a year. The second is nonlinear: price-sensitive investors, especially leveraged ones, can become sellers in periods of stress, as in March 2020 and in the spring of 2025 and 2026. When three quarters of the debt is held by such investors, the market depends more on the Federal Reserve as a lender or buyer of last resort in crises, which blurs the line between monetary policy and debt management.
7. Implications
For debt management. The Treasury has responded to weak demand for long bonds by issuing more bills, which are absorbed by money market funds, and by expanding buybacks. Bills reached 22.2 percent of marketable debt in July 2026. This strategy lowers the immediate cost of financing but raises refinancing risk and makes the interest bill more sensitive to short-term rates, which the Federal Reserve is raising. A more balanced strategy would accept a modestly higher term premium on long bonds in exchange for a more stable maturity structure.
For monetary policy. The Federal Reserve's share of the debt has been the main determinant of the term premium over twenty years. Its decision to end quantitative tightening and to buy bills for reserve management has stabilized its share at about 13 percent. Any return to large-scale purchases of long-term bonds, in a crisis or to contain yields, would lower the premium but would raise questions about the independence of monetary policy from the financing needs of the government.
For fiscal policy. The fiscal outlook depends more than ever on the price of debt. Net interest now absorbs about one dollar in five of federal revenue, more than defense spending. The most effective way to reduce the term premium is not to court foreign central banks, whose retreat is structural, but to reduce the absorption burden by narrowing the deficit. Each percentage point of GDP of deficit reduction lowers the annual absorption burden by the same amount.
For international finance. The retreat of the official holder is partly a consequence of a changing world: slower reserve accumulation, diversification into gold and the political risks revealed by the freezing of reserves. The rise of foreign private holders shows that the dollar's attraction as an investment remains intact. But private investors are more sensitive to hedging costs, exchange rate expectations and relative returns than central banks were. The United States has moved from financing itself with the reserves of other governments to financing itself in a competitive global capital market.
8. What is new in this study
To our knowledge, this study provides the first twenty-year series of the share of American public debt held by price-sensitive investors, showing that it reached a record of about 75 percent in 2026. It defines and measures the annual absorption burden on these investors and shows that it has exceeded 6 percent of GDP for five consecutive years, an unprecedented sequence. It reports a non-result that matters: over 2006 to 2026, the foreign official share has no stable relationship with the term premium once the Federal Reserve's share is accounted for, which suggests that the official retreat acts as the loss of a cushion rather than as a direct driver of yields. It decomposes the rise in net interest since 2014 into debt and rate effects and provides a simple table of the cost of the term premium for budget planning. The finding that Federal Reserve holdings lower the term premium confirms a large existing literature.
Methodological annex
Ownership data. Foreign holdings are end-of-year values from the Treasury International Capital system (major foreign holders table), with 2026 at the June value of about 9.3 trillion dollars. The official share of foreign holdings is interpolated between the Treasury's annual surveys of foreign portfolio holdings (about 59 percent in 2020 and 42 to 43 percent most recently). Federal Reserve holdings are from the H.4.1 release. Debt held by the public is from the Treasury, with 2026 at about 32.3 trillion dollars.
Absorption burden. A(t) = [change in debt held by the public minus change in Federal Reserve holdings minus change in foreign official holdings] divided by GDP.
Term premium. Annual averages of model-based estimates of the ten-year term premium (Adrian, Crump and Moench model), approximate, with 2026 at 0.85 points.
Regressions. Ordinary least squares with Newey-West standard errors (two lags) on 21 annual observations. Specifications include the Federal Reserve share, the foreign official share, the deficit as a share of GDP, a crisis dummy, the price-sensitive share and the absorption burden (annual and three-year to five-year averages).
Interest decomposition. Effective rate = net interest divided by debt held by the public: 1.79 percent in 2014 and 3.25 percent in 2026. Debt effect = change in debt times the 2014 rate; rate effect = 2026 debt times the change in rate.
Limitations. Annual data and model-based term premiums limit the precision of the estimates. Custody-based TIC data can misattribute holdings held through financial centers. The official share between survey years is interpolated. Projections assume constant growth rates and ignore feedback from yields to deficits.
References
Adrian, T., R. Crump and E. Moench (2013). Pricing the term structure with linear regressions. Journal of Financial Economics, 110(1). Updated estimates, Federal Reserve Bank of New York.
Committee for a Responsible Federal Budget (2026). Preliminary analysis of fiscal year 2026. Washington, DC, October 2026.
Congressional Budget Office (2026). The Budget and Economic Outlook: 2026 to 2036. Washington, DC, February 2026.
State Street Global Advisors (2026). Mind on the Market, 5 October 2026.
TD Economics (2026). U.S. bond yields: decomposing the rise in the 10-year yield. September 2026.
U.S. Department of the Treasury (2026). Treasury International Capital data: major foreign holders of Treasury securities; Report on Foreign Portfolio Holdings of U.S. Securities.
Federal Reserve Board (2026). Factors Affecting Reserve Balances (H.4.1) and Financial Accounts of the United States (Z.1).
LPL Research (2026). Are Treasuries losing their luster? April 2026.
The Deep Dive (2026). Foreign ownership of US Treasuries falls to lowest share since 1997. April 2026.
Financial News (2026). The era of buying U.S. Treasuries just because they are U.S. Treasuries is over. 30 August 2026.
Driss EFFINA, PhD
Independent Researcher, Global Strategy Files
The opening pages of our four country reports: United States, United Kingdom, Japan and China. A free PDF, sent to your inbox.
You will also receive occasional analysis from Global Strategy Files. Unsubscribe in one click, at any time.