The Zero-Job Economy: Breakeven Employment, a Shrinking Labor Force and the Misreading of American Payrolls

Abstract
In October 2026 American employers added 165,000 jobs, more than three times the average of the previous twelve months, and the unemployment rate fell to 4.1 percent. Most commentary read the number through a yardstick that dates from the 2010s, when the economy needed roughly 100,000 to 150,000 new jobs a month simply to absorb the growth of the labor force. This study argues that the yardstick is broken. Using twenty years of labor force, payroll and unemployment data (2006 to 2026), we estimate the breakeven pace of employment growth with three independent methods: demographic accounting, a revealed breakeven derived from the relationship between payroll gains and changes in unemployment, and a structural model of population, migration and aging solved by Monte Carlo simulation. The three methods converge on a striking result. In 2026 the United States needs, at the central estimate, about minus 5,000 jobs a month to keep unemployment stable, with a 90 percent range from minus 39,000 to plus 29,000. The probability that the true breakeven is negative is 59 percent. The country has entered what we call a zero-job economy: an economy in which employment can stagnate without unemployment rising, and in which modest payroll gains signal genuine tightness. Measured against the new benchmark, the October report is equivalent to about 280,000 jobs in the labor market of 2018 and 2019. We trace the cause to the collapse of the immigrant contribution to labor force growth, which supplied more than half of the increase between 2006 and 2024 and turned sharply negative after January 2025, compounded by an aging drag that removes roughly 680,000 people a year from the labor force through falling participation. We show that the shift lowers potential output growth by about one percentage point relative to 2023 and 2024, that it coexists with falling real wages because the labor supply shock coincided with an energy price shock, and that it changes the meaning of every monthly employment report. Scenarios to 2030 indicate that only a return to net migration above 500,000 a year would restore a breakeven pace near 30,000 jobs a month.
Key findings
- The breakeven pace of employment growth fell from about 110,000 jobs a month in 2017 to 2019 and about 150,000 in 2023 to 2024 to roughly zero in 2026. Our central estimate is minus 5,000 a month.
- The three estimation methods disagree on the level but agree on the sign of the change: the demographic method gives minus 48,000, the revealed (Okun) method plus 37,000 and the structural simulation a median of minus 5,000.
- Immigrants accounted for about 4.1 million of the 7.8 million increase in the labor force between 2006 and 2016 and for about 5.0 million of 8.9 million between 2016 and 2024. Since January 2025 the foreign-born labor force has fallen by about 1.4 million.
- Payroll growth of 55,000 a month in 2026 is about 60,000 above breakeven. In the scale of 2018 and 2019, the October 2026 gain of 165,000 is equivalent to about 280,000 jobs.
- Labor force growth of minus 0.35 percent in 2026 implies potential GDP growth near 1.3 percent, about one point below the pace of 2023 and 2024, unless productivity accelerates.
- Under net migration of zero, the breakeven pace would stabilize near 10,000 jobs a month to 2030. It would take net migration of about one million a year to bring it back to 50,000.
1. Introduction: 165,000 jobs and a benchmark nobody updated
For most of the last two decades, American economists and markets shared an implicit rule. The monthly employment report was judged against a number somewhere between 100,000 and 150,000: the pace of job creation needed to absorb new entrants into the labor force and keep the unemployment rate unchanged. Above that range the labor market was tightening; below it, slack was building. The rule was rarely stated because it rarely needed to be. Population growth, steady immigration and a broadly stable participation rate made the benchmark move slowly, and a number learned in 2015 remained serviceable in 2019.
That world ended in 2025. According to the Bureau of Labor Statistics, total nonfarm employment grew by only 181,000 in the whole of 2025 after the annual benchmark revision published in February 2026, an average of about 15,000 a month and the weakest year outside a recession since 2003. Yet the unemployment rate, which was 4.0 percent in January 2025, has stayed within a range of 4.1 to 4.3 percent since March 2026. On the old benchmark, an economy creating 15,000 jobs a month should have seen unemployment climb by roughly half a percentage point a year. It did not, because the denominator shrank. The civilian labor force, which stood at 170.7 million in January 2025, had fallen to 169.8 million by August 2026, a decline of about 919,000, before a partial rebound in September and October.
Several institutions have noticed the change. A Federal Reserve staff note published in April 2026 concluded that near-zero growth of the potential labor force could bring the breakeven pace below 10,000 jobs a month. Economists at the Dallas Fed estimated that it had briefly turned negative in the second half of 2025. The Budget Lab at Yale put it at just over 5,000 a month in November 2026, against about 166,000 in late 2023. These estimates are valuable, but each rests on a single method, and none places the 2026 figure in a twenty-year perspective or translates it into a working tool for reading the data.
This study does three things. First, it rebuilds the arithmetic of American labor supply from 2006 to 2026, separating population growth from participation and the native-born from the foreign-born contribution. Second, it estimates the breakeven pace with three methods that rely on different information and different assumptions, and it reports a probability distribution rather than a point. Third, it uses the result to reread the payroll numbers of 2025 and 2026, to estimate the effect on potential output, and to project the breakeven pace to 2030 under alternative migration paths.
The central thesis is simple. The United States has become, for the first time in modern history, an economy in which zero job growth is roughly consistent with stable unemployment. We call this a zero-job economy. It is not a recession, and it is not a boom. It is a new regime in which the usual signals of the labor market carry different meanings, and in which policymakers who keep using the old benchmark will systematically misjudge the degree of slack.
2. Twenty years of American labor supply
2.1 The arithmetic of the labor force
The labor force is the product of two quantities: the civilian noninstitutional population aged 16 and over, and the share of that population that works or looks for work, the participation rate. A change in the labor force can therefore be split into a population effect (more adults at the old participation rate) and a participation effect (a different share of adults in the market). Table 1 reports both quantities for selected years, using annual averages from the Current Population Survey and our estimates for 2025 and 2026, which account for the population control adjustments introduced each January.
Table 1. Labor force, population and participation, selected years
| Year | Labor force (millions) | Adult population (millions) | Participation rate (%) | Unemployment rate (%) |
|---|---|---|---|---|
| 2006 | 151.4 | 228.7 | 66.2 | 4.6 |
| 2010 | 153.9 | 237.9 | 64.7 | 9.6 |
| 2015 | 157.1 | 250.6 | 62.7 | 5.3 |
| 2019 | 163.5 | 259.2 | 63.1 | 3.7 |
| 2022 | 164.3 | 264.1 | 62.2 | 3.6 |
| 2024 | 168.1 | 268.5 | 62.6 | 4.0 |
| 2025 | 170.5 | 273.4 | 62.3 | 4.3 |
| 2026 (Jan to Oct) | 169.9 | 273.5 | 62.0 | 4.2 |
Source: Bureau of Labor Statistics, Current Population Survey; 2025 and 2026 are Global Strategy Files estimates based on monthly releases.
Two features stand out. The first is the long decline in participation, from 66.2 percent in 2006 to about 62 percent in 2026. Part of the decline was cyclical, concentrated in the years after the 2008 crisis, but most of it is demographic. The baby boom generation, born between 1946 and 1964, began to reach 62 in 2008 and 65 in 2011, and the share of adults over 65, who participate at rates below 20 percent, has risen relentlessly since. The second feature is that, despite falling participation, the labor force kept growing for most of the period because the adult population grew by roughly 2 to 2.5 million a year, a large part of it through immigration.
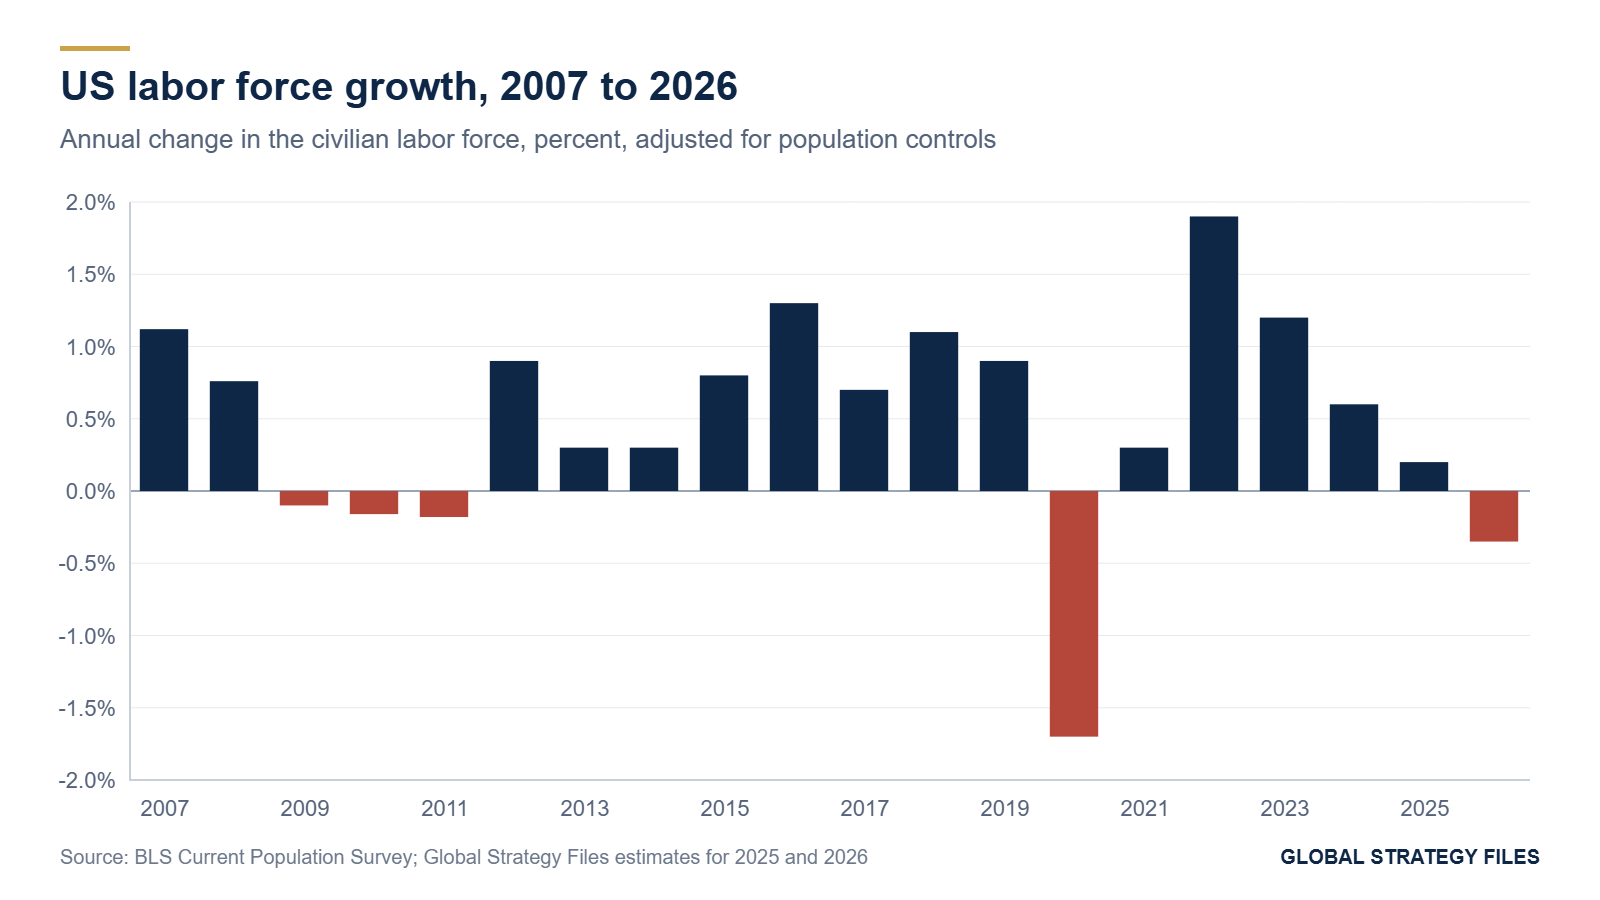
Once population control adjustments are removed (they added about 0.9 million to the measured labor force in January 2023 and about 2.1 million in January 2025 without reflecting any change in the real economy), the underlying pace of labor force growth can be compared across years. Figure 1 shows it. Growth averaged about 0.8 percent a year between 2012 and 2019, collapsed in 2020, rebounded to 1.9 percent in 2022 and 1.2 percent in 2023 as immigration surged, slowed to 0.6 percent in 2024 and 0.2 percent in 2025, and turned negative in 2026, at about minus 0.35 percent. The Congressional Research Service reports the same pattern from the monthly data: the twelve-month growth rate of the labor force fell from minus 0.1 percent in January 2026 to minus 0.6 percent in September.
2.2 The immigrant engine and its reversal
The foreign-born labor force is the single most important driver of the change. Figure 2 tracks it from 2006 to 2026. It rose from about 22.9 million in 2006 to 27.0 million in 2016, 28.4 million in 2019 and a peak of about 32 million in early 2025, when it represented close to one worker in five. Over the decade 2006 to 2016, foreign-born workers accounted for about 4.1 million of the 7.8 million increase in the labor force, or 53 percent. Between 2016 and 2024, the share was even higher: about 5.0 million of an 8.9 million increase, or 56 percent. The post-pandemic surge of 2022 to 2024, when net international migration peaked at about 2.7 million in 2024, explains why breakeven estimates of 150,000 to 200,000 jobs a month were common in those years.
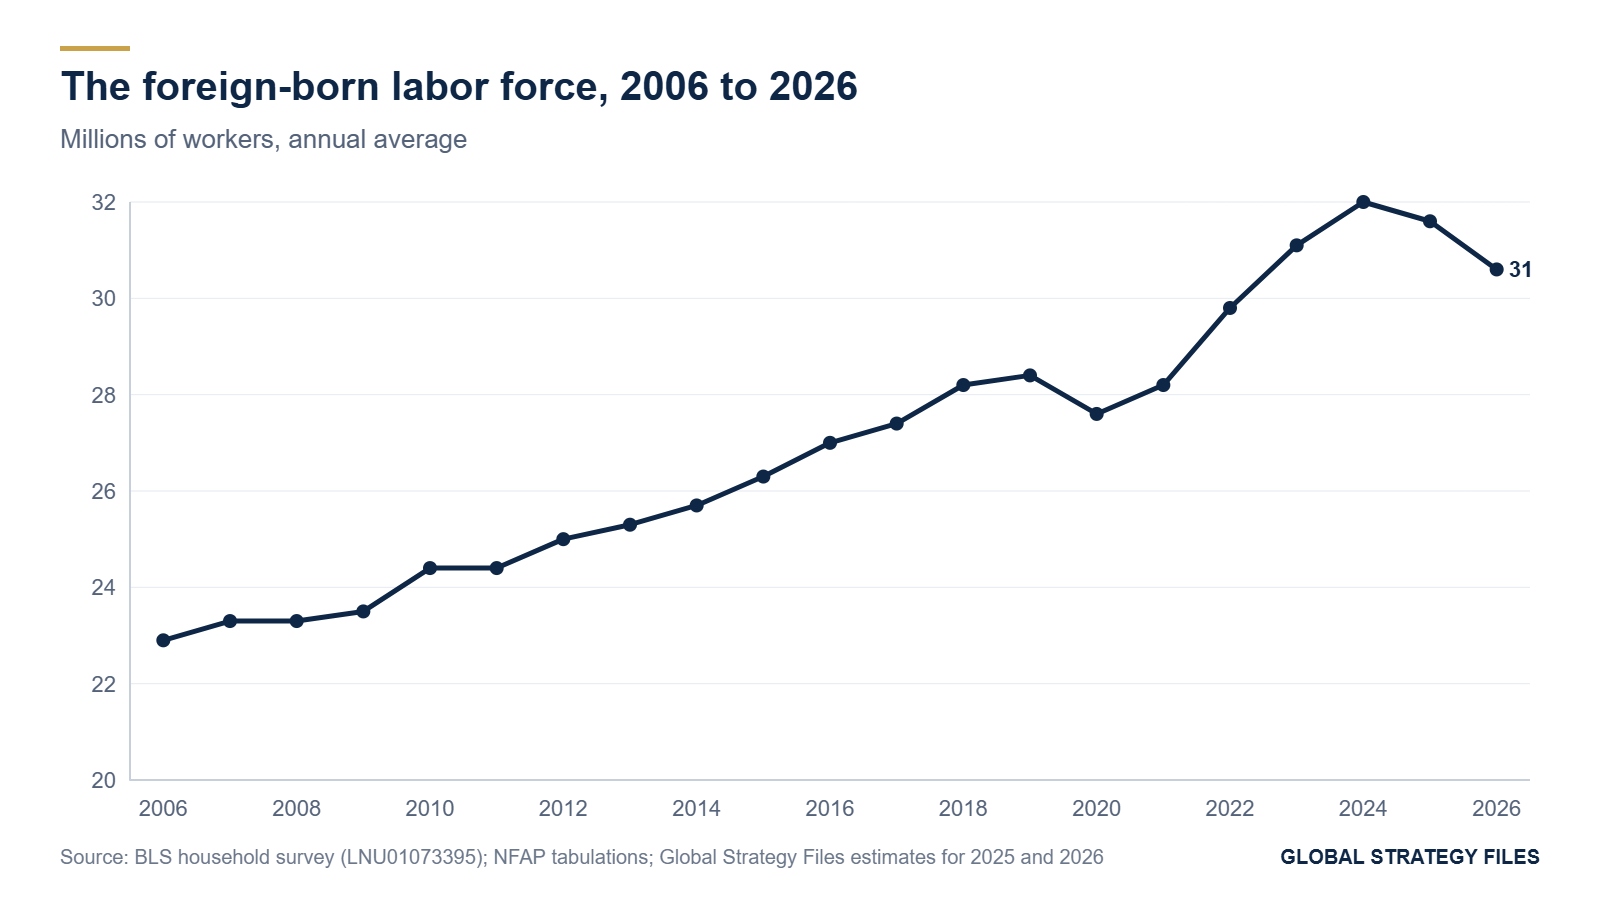
The reversal since January 2025 has been abrupt. The household survey shows a decline of about 1.4 million foreign-born workers between January 2025 and August 2026, according to tabulations by the National Foundation for American Policy, and the Center for Immigration Studies estimates that the total foreign-born population fell by 2.9 million between January 2025 and July 2026. The Brookings Institution estimates that net migration in 2025 was between minus 295,000 and minus 10,000, the first negative figure in at least half a century, and projects a range from minus 925,000 to plus 185,000 for 2026. Monthly survey estimates of the foreign-born population are noisy and depend on population weights that are themselves projections, so the exact magnitudes deserve caution. The direction, however, is confirmed by every independent source.
Two consequences matter for this study. The first is mechanical: when the inflow of working-age adults stops, the population effect in the labor force arithmetic drops by about 0.6 to 0.8 million a year. The second is behavioral. There is no sign that native-born workers have filled the gap. The participation rate of the native-born aged 16 and over fell from 61.8 percent in June 2025 to 60.9 percent in August 2026, and their unemployment rate rose to 4.6 percent in June 2026. The withdrawal of immigrant labor has not pulled Americans into work; if anything, the uncertainty that accompanied it has coincided with weaker native participation.
2.3 Aging: the slow drag that never stops
The third force is aging. Each year, about four million Americans reach 65, and Oxford Economics projects that the peak of baby boom retirements falls between 2026 and 2029. Because participation drops sharply after 62, the rising share of older adults pulls the aggregate participation rate down by roughly 0.2 to 0.3 percentage points a year, holding age-specific rates constant. Applied to an adult population of about 274 million, a drag of 0.25 points removes about 685,000 people from the labor force every year. Before 2020, this drag was more than offset by population growth of 2 million or more. With population growth now limited to the native-born, roughly 1.3 million adults a year according to Census projections, the offset is thin. The aging drag, which was a background feature of the 2010s, has become the decisive one.
Put together, these three forces produce the arithmetic that defines the zero-job economy: native population growth adds about 0.8 million to the labor force a year at current participation, aging subtracts about 0.7 million, and net migration determines the sign of the remainder.
3. Three ways to measure the breakeven
The breakeven pace of employment growth cannot be observed. It has to be inferred, and every method of inference relies on assumptions that can fail. The prudent approach is to triangulate: to use methods that draw on different data and different hypotheses, and to treat agreement between them as evidence and disagreement as a measure of uncertainty.
3.1 Demographic accounting
The first method asks a direct question: how fast is the labor force growing, and how many jobs are needed to employ the same share of it? If the labor force grows by L people a month and the unemployment rate is to stay at its structural level u*, the economy needs L times (1 minus u*) new jobs a month. We measure L as the three-year trailing average of the control-adjusted change in the labor force and set u* at 4.3 percent, close to the Congressional Budget Office estimate of the noncyclical rate.
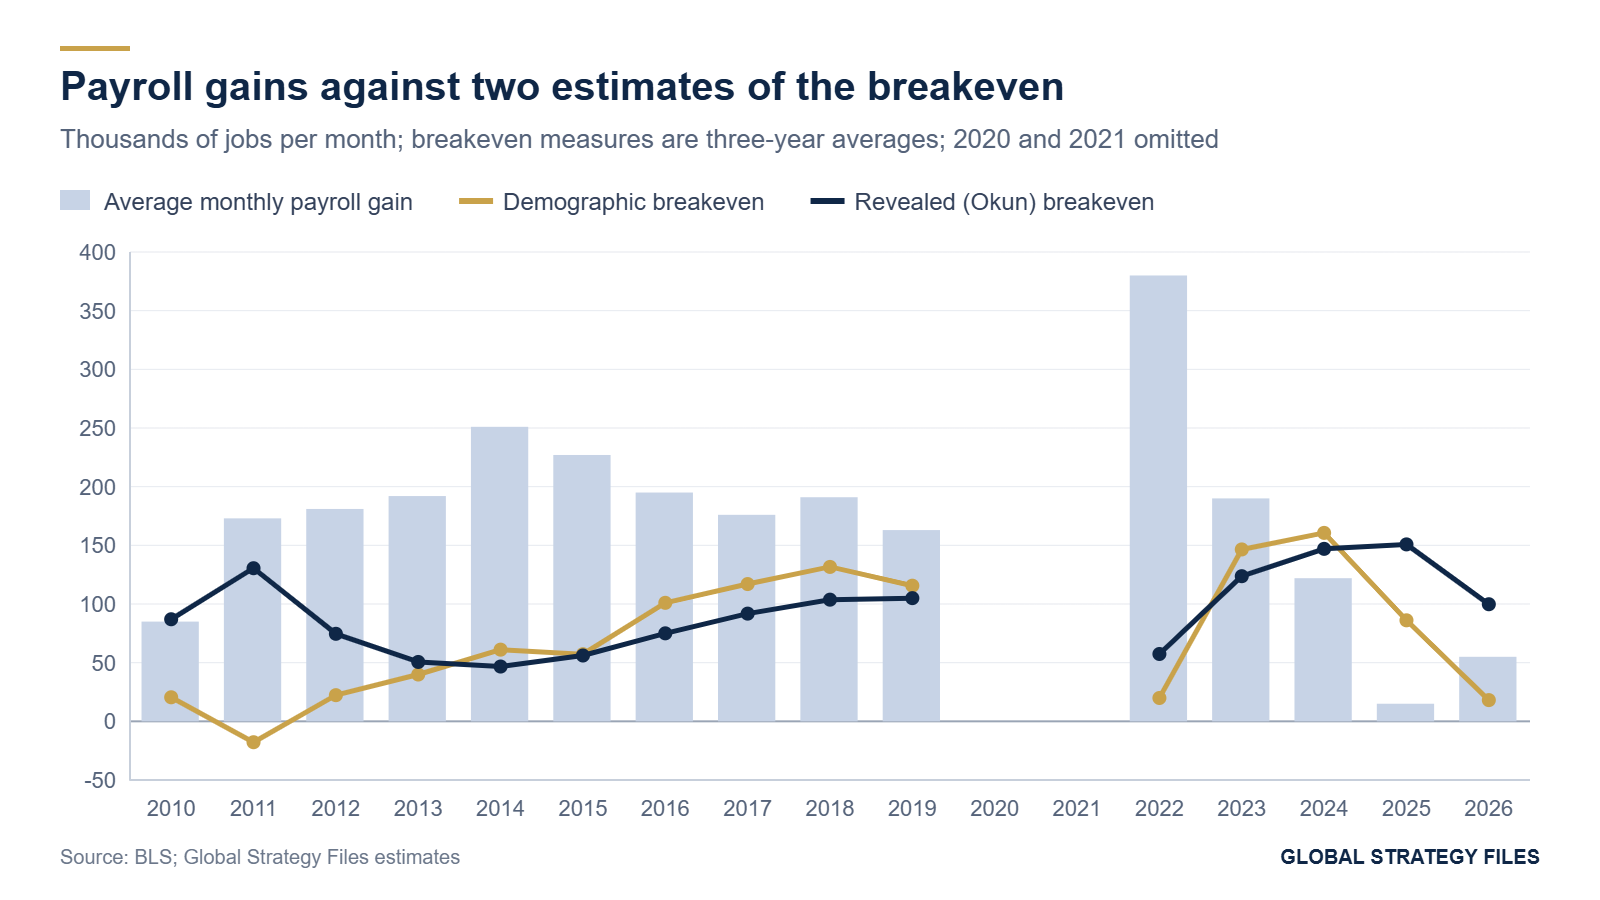
The result, shown as the gold line in Figure 3, tracks the demographic history described above. The demographic breakeven was about 135,000 in 2007, collapsed with participation after the 2008 crisis, recovered to 100,000 to 130,000 between 2016 and 2019, reached about 150,000 to 160,000 in 2023 and 2024, and fell to about 18,000 on a three-year average in 2026. Using the 2026 change alone, which is the relevant measure for reading the current year, the demographic breakeven is about minus 48,000 jobs a month: the labor force is shrinking, so a stable unemployment rate is consistent with falling employment.
3.2 The revealed breakeven: what unemployment tells us
The second method does not use population data at all. It asks what the behavior of the unemployment rate reveals about the pace of job creation that would have kept it stable. Over the period 2007 to 2026, excluding the pandemic years 2020 and 2021, a simple regression of the annual change in the unemployment rate on average monthly payroll gains fits the data closely (R squared of 0.88). Each additional 100,000 jobs a month lowers the unemployment rate by 0.56 percentage points over a year, with a standard error of 0.05. Figure 4 shows the relationship.
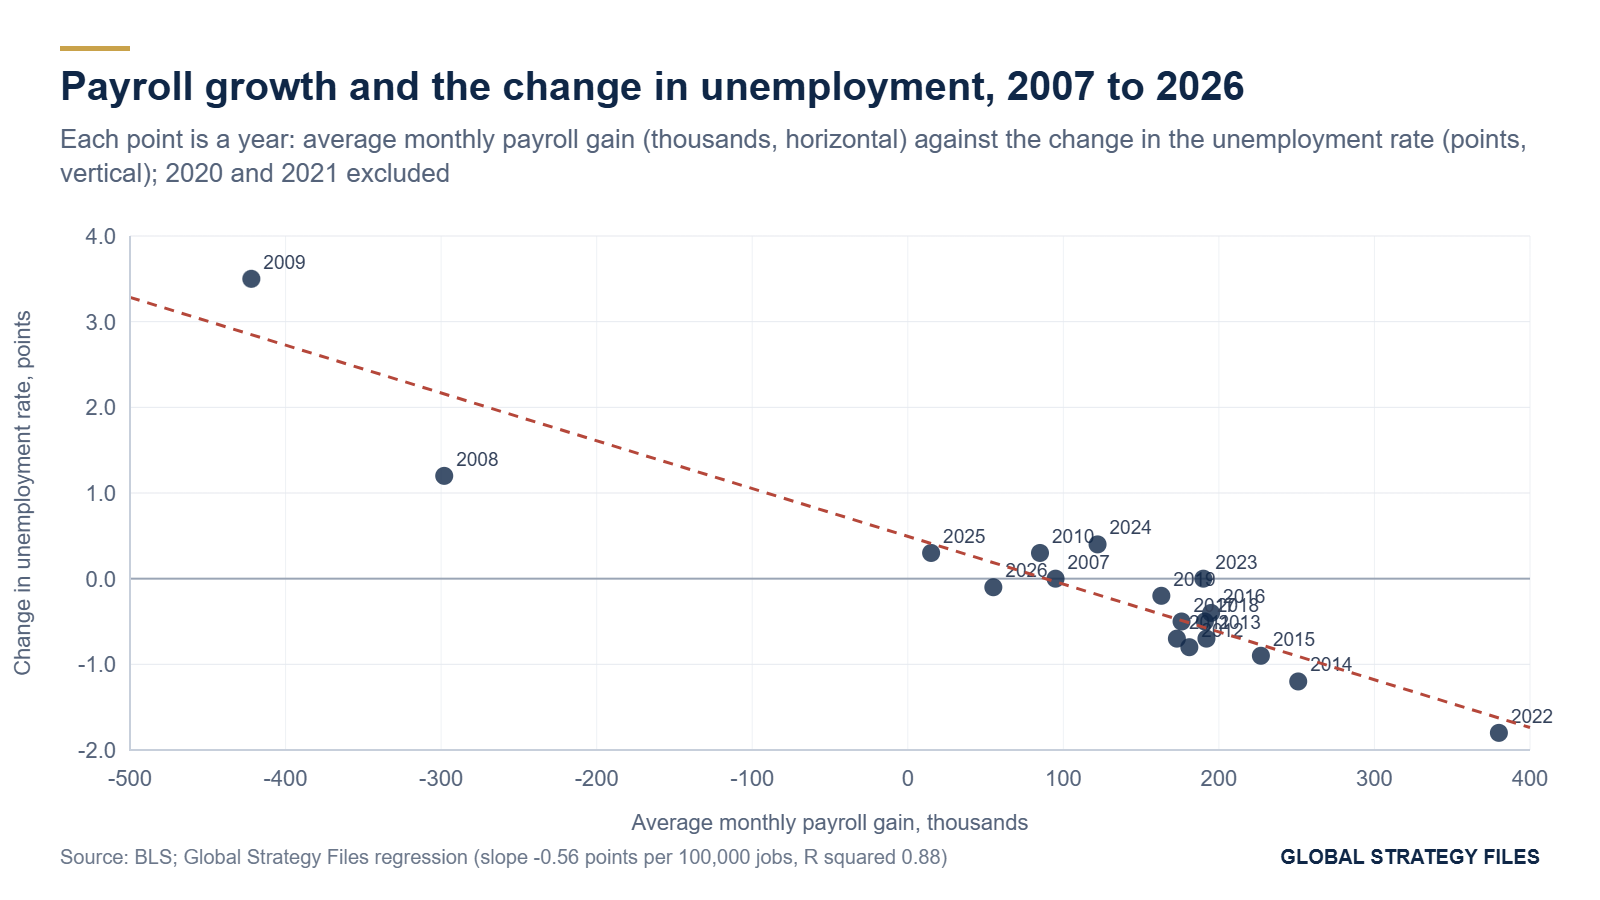
Given that slope, each year's data reveal an implied breakeven: the payroll gain that would have produced no change in unemployment. In 2025, payrolls grew by about 15,000 a month and unemployment rose by about 0.3 points, which implies a breakeven of about 69,000. In 2026, payrolls have grown by about 55,000 a month and the unemployment rate has edged down by about 0.1 point, which implies a breakeven of about 37,000. The three-year average of this revealed measure, the navy line in Figure 3, peaked near 150,000 in 2024 and 2025 and was falling fast in 2026.
The revealed method has an important advantage: it does not depend on the population controls and survey weights that make the foreign-born estimates uncertain. Its weakness is that it attributes every unexplained movement in unemployment to labor supply, including changes in productivity, in the composition of jobs and in measurement error between the payroll and household surveys. It therefore tends to lag turning points and to overstate the breakeven when the household survey is losing respondents, which is precisely the situation of 2025 and 2026.
3.3 A structural model with uncertainty
The third method builds the breakeven from its components and treats each one as uncertain. The monthly breakeven is the sum of three terms, multiplied by the share of the labor force that must find work (one minus u*):
- Native-born adult population growth times the participation rate. We draw native growth from a normal distribution centered on 1.3 million a year, with a standard deviation of 0.2 million, consistent with Census projections.
- Net migration times the share of migrants who are adults (about 80 percent) times the participation rate. We draw net migration from a uniform distribution between minus 925,000 and plus 185,000, the range estimated by Brookings for 2026.
- The aging drag on participation, drawn from a normal distribution centered on minus 0.25 points a year with a standard deviation of 0.06 points, applied to an adult population of 274 million.
We simulated the model 200,000 times. Figure 5 shows the distribution of the resulting breakeven. The median is minus 4,900 jobs a month and the mean minus 4,900, with a standard deviation of 20,700. The 90 percent interval runs from minus 39,000 to plus 29,000. The probability that the breakeven is below zero is 59 percent; the probability that it exceeds 50,000, a level that would have been considered very low in any year between 2010 and 2024, is less than half of one percent.
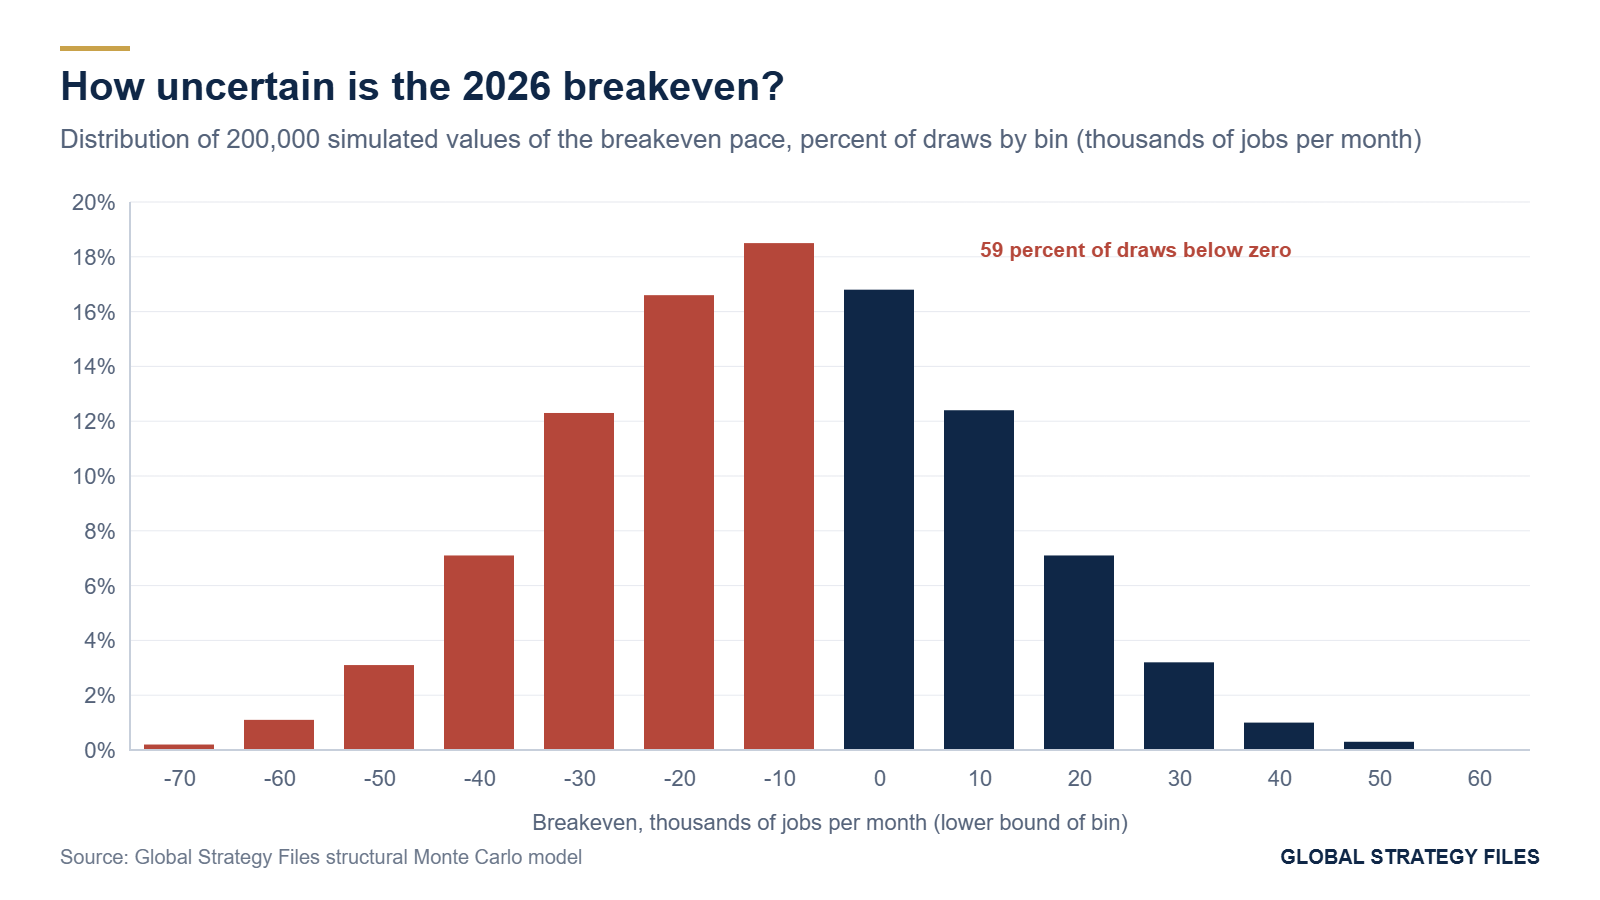
3.4 Reconciling the three estimates
Table 2 summarizes the results. The three methods give different levels for 2026, from minus 48,000 to plus 37,000, but they agree on three points. The breakeven has fallen by more than 100,000 jobs a month in two years. It is lower than at any time in the twenty-year sample outside the pandemic. And it is within a range of plus or minus 50,000 around zero, which is narrower than the sampling error of a single monthly payroll estimate (about 136,000 at the 90 percent confidence level).
Table 2. Breakeven employment growth, thousands of jobs per month
| Method | 2017 to 2019 | 2023 to 2024 | 2025 | 2026 |
|---|---|---|---|---|
| Demographic accounting, three-year average | 121 | 154 | 86 | 18 |
| Demographic accounting, current year | 116 | 118 | 23 | -48 |
| Revealed breakeven (Okun), three-year average | 100 | 135 | 151 | 100 |
| Revealed breakeven (Okun), current year | 105 | 192 | 69 | 37 |
| Structural Monte Carlo, median | n.a. | n.a. | n.a. | -5 |
| Structural Monte Carlo, 90 percent interval | n.a. | n.a. | n.a. | -39 to 29 |
| Federal Reserve staff note (April 2026) | n.a. | n.a. | n.a. | below 10 |
| Yale Budget Lab (November 2026) | n.a. | 166 (late 2023) | n.a. | about 5 |
Source: Global Strategy Files estimates; Federal Reserve Board; Yale Budget Lab as reported by the Associated Press.
The disagreement between the revealed and demographic measures is itself informative. The revealed measure is higher because the unemployment rate rose a little in 2025 even as the labor force stagnated. One interpretation is that the household survey overstates the decline in the labor force, a possibility raised by analysts who note that the Bureau of Labor Statistics reweights its sample to Census population projections that may not fully capture emigration. Another is that the 2025 slowdown in labor demand was real and coincided with the supply shock. Our central estimate, a breakeven close to zero, sits between the two readings. For practical purposes, the conclusion is robust: in 2026, any positive payroll number is consistent with a labor market that is not loosening.
4. Rereading the payroll numbers
4.1 A breakeven-adjusted payroll index
If the benchmark has moved, the headline payroll number must be read differently. We propose a simple correction: the breakeven-adjusted payroll gain, equal to the average monthly payroll gain minus the estimated breakeven of the same year. A positive number means that job creation is fast enough to absorb more than the growth of the labor force and is tightening the market; a negative number means slack is accumulating. Figure 6 shows the index from 2010 to 2026, excluding the pandemic years.
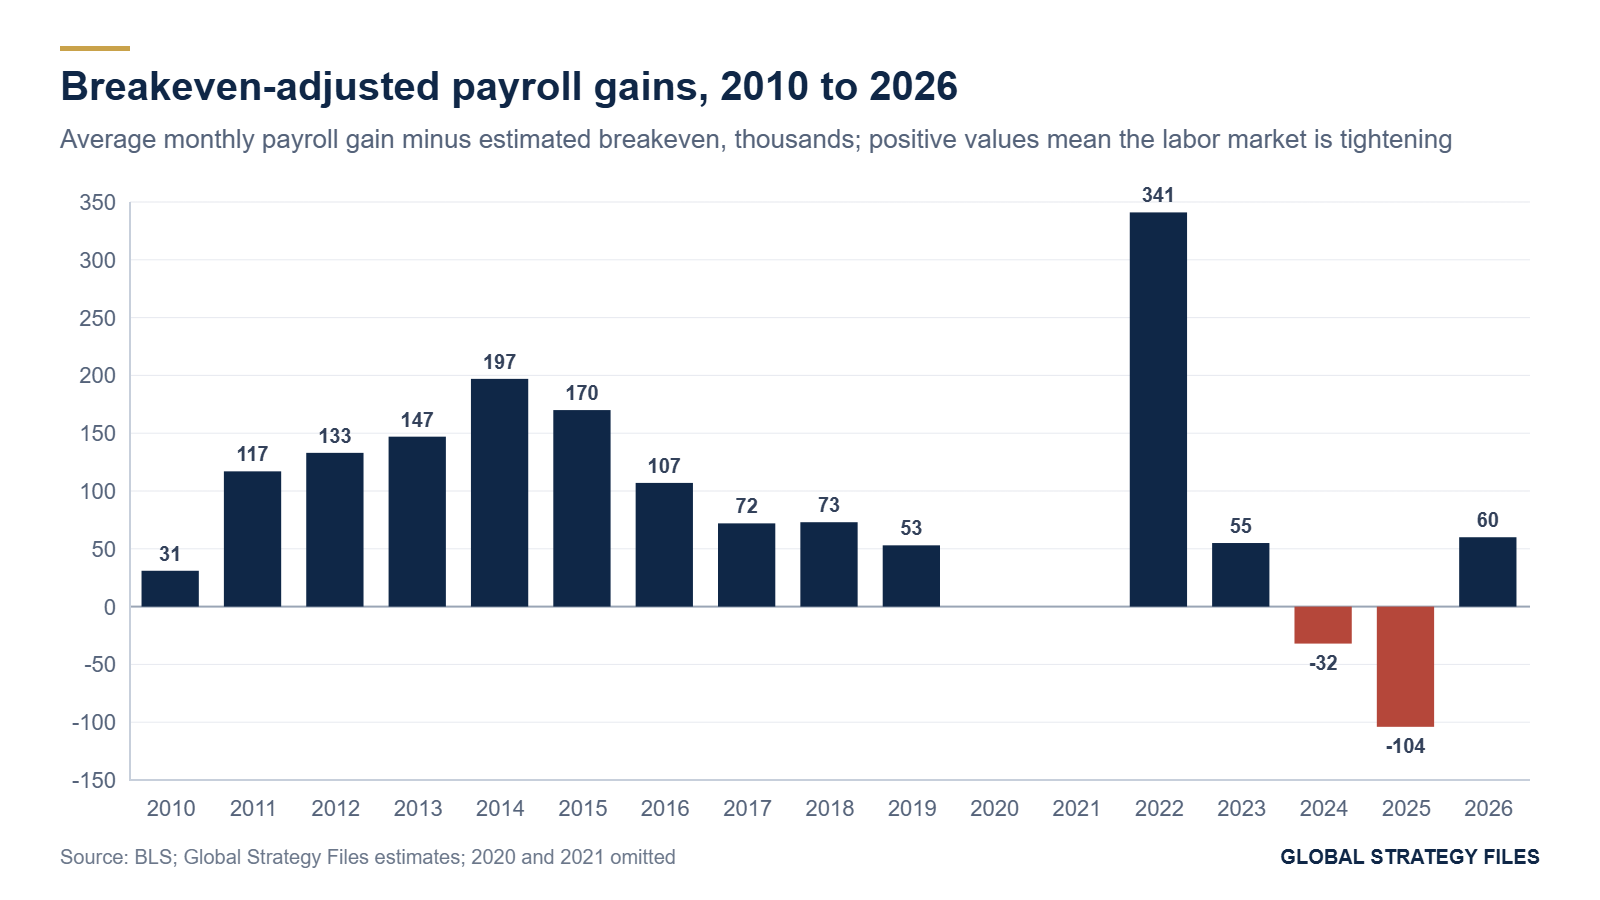
The index tells a different story from the raw numbers. The strongest years of tightening were 2014 and 2015, when payrolls ran 170,000 to 200,000 above breakeven and unemployment fell by about a point a year. The late 2010s, often remembered as the hottest labor market in a generation, were in fact years of moderate excess job creation, about 50,000 to 75,000 a month, sustained over a long period. The years 2024 and 2025 were years of slack accumulation: payroll growth fell below a breakeven that was still elevated by the immigration surge, which is why unemployment rose from 3.6 percent to 4.3 percent. In 2026, the index turned positive again, at about plus 60,000 a month, a pace of tightening comparable to 2017 to 2019.
The practical consequence is a conversion rule. To compare a 2026 payroll number with the experience of 2018 and 2019, add about 115,000, the difference between the breakeven of those years (about 110,000) and the current central estimate (about minus 5,000). The 165,000 jobs reported for October 2026 are therefore equivalent to about 280,000 jobs in the labor market of 2019. The disappointing 29,000 first reported for September, later revised to 60,000, was equivalent to about 175,000. The weakest months of 2025, which looked like the beginning of a recession, were in fact close to neutral.
4.2 The payroll and household gap
The zero-job economy also helps explain a puzzle that has troubled analysts since 2025: the divergence between the two surveys that make up the monthly employment report. The payroll survey counts jobs on the books of about 120,000 businesses and government agencies. The household survey counts people, from a sample of about 60,000 households weighted to population estimates. Between January 2025 and October 2026, payroll employment rose by roughly 0.74 million (181,000 in 2025 and about 560,000 in the first ten months of 2026). Over the same period, the labor force measured by the household survey was roughly unchanged, and the unemployment rate rose from 4.0 to 4.1 percent, which implies that household employment fell slightly, by perhaps 0.2 million.
A gap of about 0.9 million between the two surveys over 21 months is large but not unprecedented. Three mechanisms consistent with the zero-job economy can produce it. First, multiple jobholding: when labor is scarce, existing workers take second jobs, which raises payroll counts without adding people. Second, the composition of the immigrant outflow: workers who leave are disproportionately in informal or cash employment that the payroll survey never captured, so their departure lowers household employment but not payroll employment. Third, survey weights: if the household survey's population controls overstate emigration, the decline in household employment is partly a statistical artifact. The first two mechanisms imply that the payroll survey is the better guide to labor demand in 2026; the third implies that the household survey understates the labor force. All three imply that the unemployment rate, which is computed from the household survey, should be read together with the breakeven estimate rather than alone.
4.3 Underemployment and the quality of the tightness
The October report contained a warning that the zero-job framework does not dismiss. The U-6 measure of underemployment, which adds discouraged workers and people working part time for economic reasons, rose from 7.6 percent to 7.9 percent, and involuntary part-time work increased by 339,000. Tightness measured by the breakeven-adjusted index is a statement about the quantity of labor. It says nothing about the quality of the jobs created or the hours offered. A labor market in which employers hire just enough people but keep them on short hours is not the same as one in which employers compete for scarce workers with higher pay. Section 5 shows that, in 2026, the American labor market looks more like the first than the second.
5. Wages, productivity and potential output
5.1 Scarcity without bargaining power
Textbook reasoning predicts that a shrinking labor supply should raise wages. In 2026 it has not, at least not in real terms. Average hourly earnings rose 3.1 percent in the twelve months to October 2026, while the last available annual rate of consumer price inflation, for September, was 3.7 percent. Real hourly earnings are therefore falling, by roughly half a percentage point a year, in the tightest labor market since 2019 as measured by the breakeven-adjusted index.
The explanation lies in the coincidence of two supply shocks. The labor supply shock reduced the number of workers. The energy shock that followed the outbreak of war with Iran at the end of February 2026 raised gasoline prices by about 37 percent over the twelve months to September and pushed headline inflation to its highest level in three years in the spring. Employers facing higher input costs and uncertain demand have absorbed the scarcity of labor through hours, overtime and second jobs rather than through pay increases that would keep up with prices. Workers, for their part, have limited bargaining power when nominal wage growth of 3 to 4 percent already exceeds the pre-2020 norm. The result is a configuration that the old rules of thumb do not describe: a labor market that is tight in quantity, loose in hours and losing ground in real pay.
This matters for the interpretation of inflation. A central bank that reads the labor market through the old breakeven sees weak job growth and concludes that wage pressures will fade. A central bank that reads it through the new breakeven sees a labor market that is tightening at a pace comparable to the late 2010s, at a time when inflation is already above target because of energy. The second reading is more consistent with the decision of the Federal Reserve to resume tightening in the autumn of 2026.
5.2 Potential output
Potential output growth is, to a first approximation, the sum of the growth of labor input and the growth of labor productivity. With labor force growth at about minus 0.35 percent in 2026 and trend productivity growth of about 1.6 percent (the average for the nonfarm business sector over the last twenty years), potential growth falls to roughly 1.25 percent. Figure 7 compares this with earlier periods. In 2017 to 2019 and again in 2023 to 2024, potential growth was close to 2.5 percent, of which labor force growth contributed about 0.9 points. The zero-job economy removes about one percentage point from the growth the American economy can sustain without inflation.
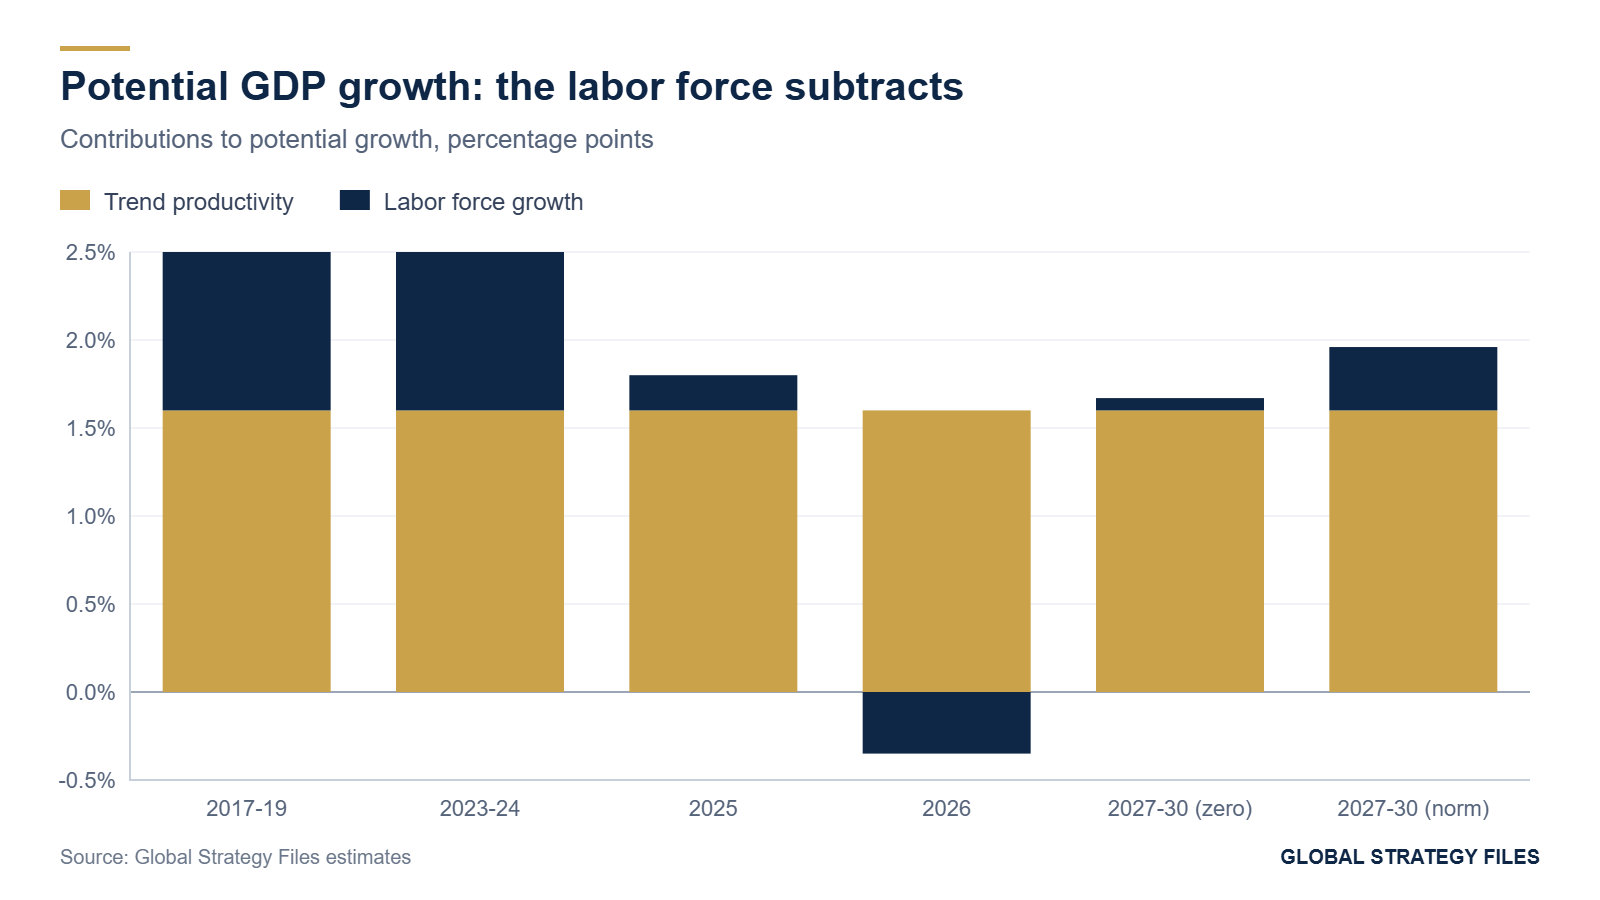
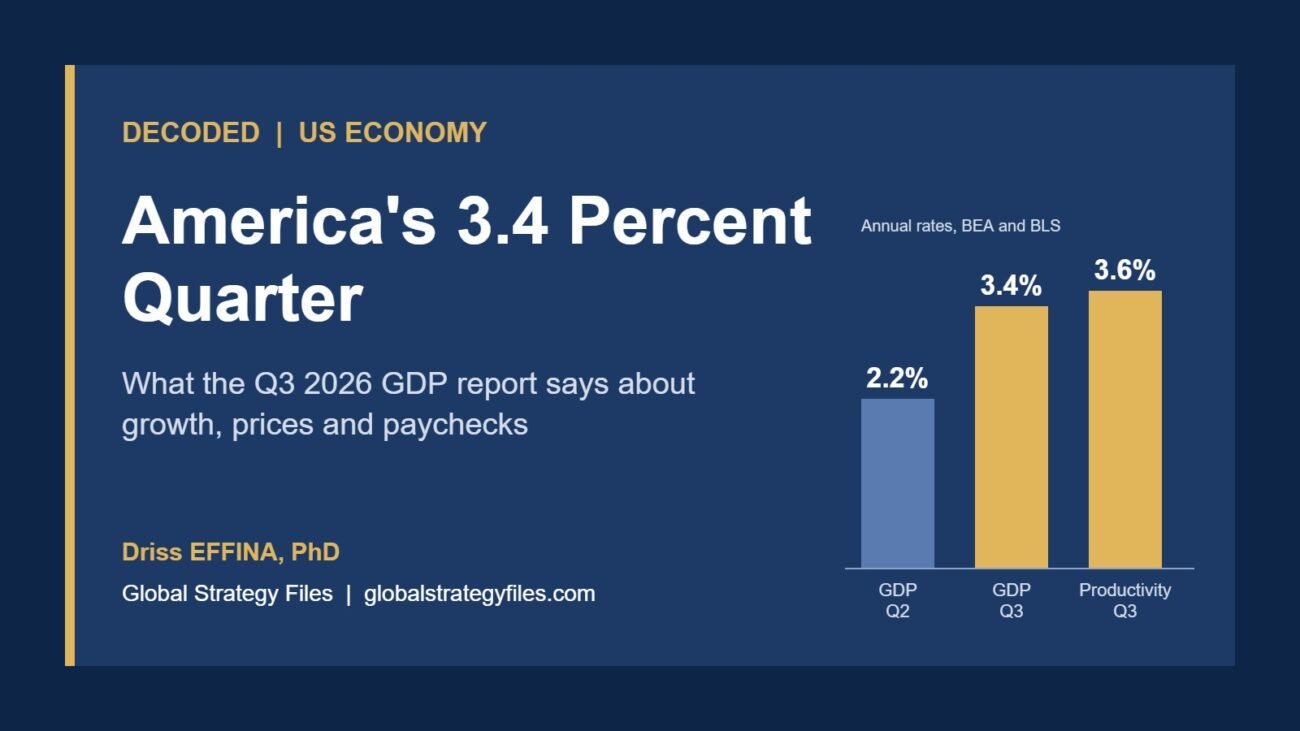
Real GDP grew at an annualized rate of 3.4 percent in the third quarter of 2026, more than twice our estimate of potential. Part of the gap can be explained by a genuine acceleration of productivity linked to investment in artificial intelligence, which would raise potential growth. But if productivity growth merely returns to its long-run average, sustained growth above 2 percent will eventually show up as rising pressure on prices rather than on employment. The zero-job economy is, in macroeconomic terms, a low-speed-limit economy.
6. Scenarios for 2027 to 2030
The structural model can be used to project the breakeven pace under alternative paths for net migration, holding the native-born population growth at 1.3 million a year and the aging drag at 0.25 points a year. Table 3 and Figure 8 report the results.
Table 3. Breakeven employment growth and potential output under migration scenarios, 2027 to 2030
| Scenario | Net migration per year | Breakeven (jobs per month) | Labor force growth (% per year) | Potential GDP growth (%) |
|---|---|---|---|---|
| Deep outflow | -925,000 | -27,000 | -0.20 | 1.4 |
| Mild outflow | -300,000 | -2,000 | -0.01 | 1.6 |
| Zero net migration | 0 | 10,000 | 0.07 | 1.7 |
| Partial recovery | +500,000 | 29,000 | 0.21 | 1.8 |
| Pre-2020 norm | +1,000,000 | 49,000 | 0.36 | 2.0 |
| 2022 to 2024 surge | +2,500,000 | 109,000 | 0.80 | 2.4 |
Source: Global Strategy Files structural model. Potential growth assumes trend productivity growth of 1.6 percent.
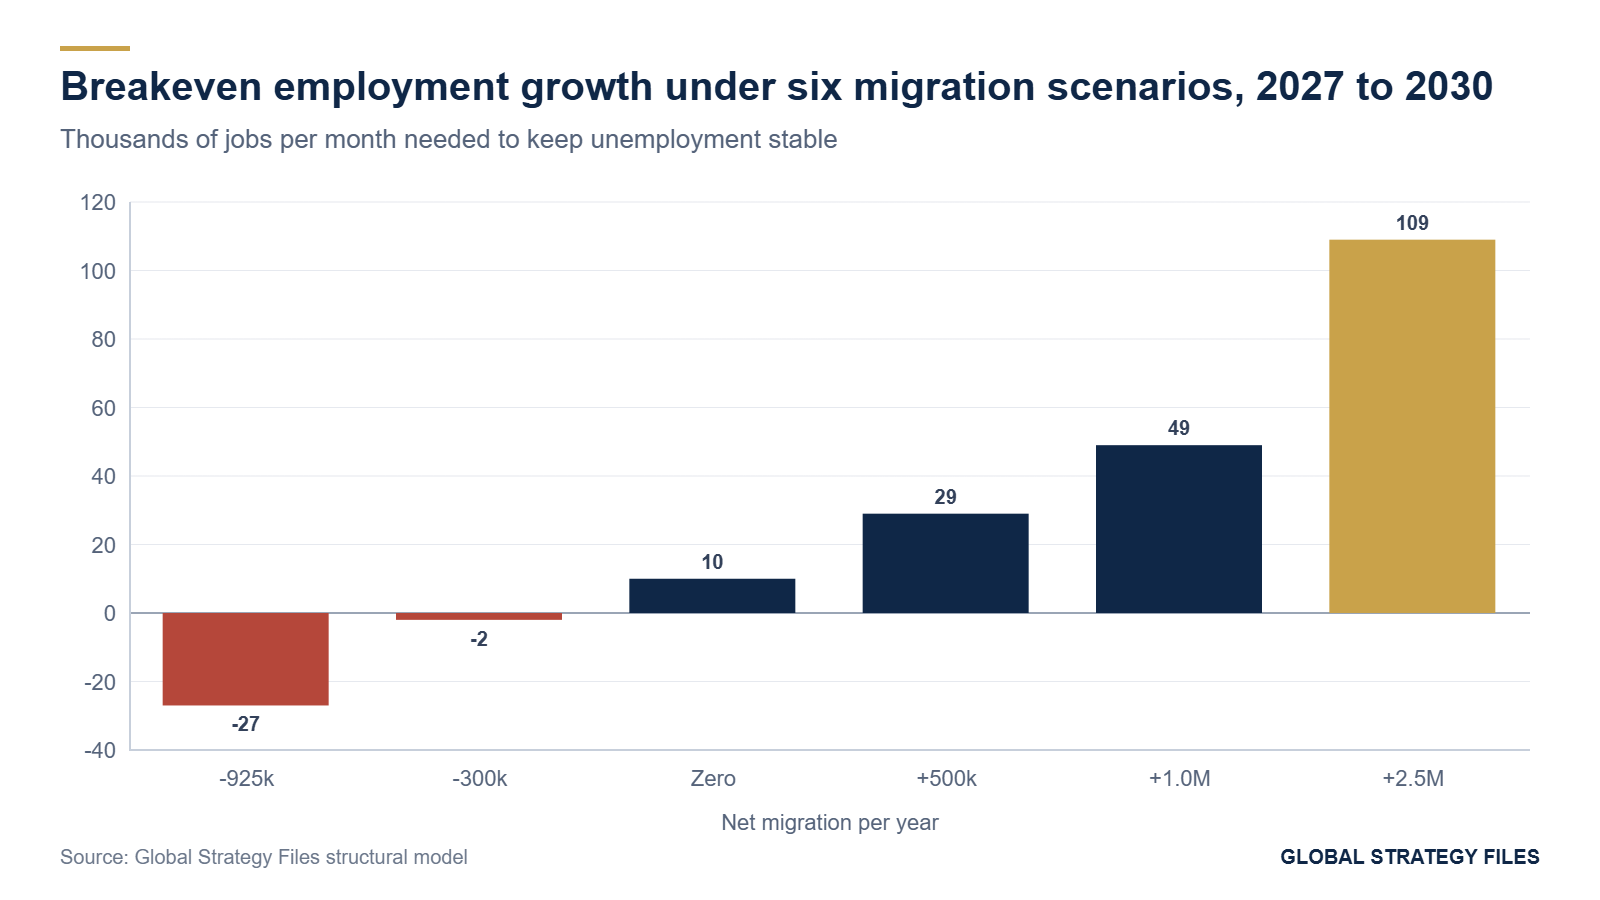
Three conclusions follow. First, under any plausible policy path, the breakeven pace will remain far below the levels of the 2010s for the rest of the decade. Even a return to the pre-2020 migration norm of about one million a year would leave it near 50,000, less than half the 2017 to 2019 level, because the aging drag has intensified. Second, the breakeven is extremely sensitive to migration and almost insensitive to everything else: each additional 100,000 net migrants a year raise it by about 4,000 jobs a month. Third, the range of plausible outcomes is asymmetric. The scenarios that lift the breakeven back toward 100,000 require a migration surge comparable to 2022 to 2024, which current policy rules out. The scenarios that push it further below zero require only a continuation of 2025 and 2026.
The baby boom retirement peak reinforces this conclusion. If the aging drag rises to 0.3 points a year between 2027 and 2029, as the Oxford Economics projection implies, the breakeven under zero net migration falls from about 10,000 to about minus 1,000 a month. The zero-job economy is not a temporary consequence of one year of enforcement. It is the arithmetic of an aging society that has stopped importing workers.
7. Implications
For the reading of economic data. Monthly payroll reports should be published, and read, alongside an estimate of the breakeven. A payroll gain of 50,000, which in 2015 would have signaled a sharp slowdown, now signals moderate tightening. Conversely, the unemployment rate becomes a less reliable thermometer of labor demand: it can stay low while employment stagnates and while underemployment rises. We recommend that analysts track three indicators together: the breakeven-adjusted payroll index, the employment rate of people aged 25 to 54, which is insensitive to aging, and the U-6 underemployment rate.
For monetary policy. The breakeven matters for the assessment of slack. If the Federal Reserve were to judge 2026 job growth against a benchmark of 100,000, it would conclude that the labor market is weakening and that inflation will fade. Against a benchmark near zero, the same data indicate a labor market that is tightening while inflation is above target. Our estimates support the view that the American economy has less spare capacity than headline job growth suggests, and that the neutral pace of GDP growth is closer to 1.5 percent than to 2 percent.
For public finances. A shrinking labor force erodes the payroll tax base that finances Social Security and Medicare. Each 100,000 fewer workers at the median wage reduces payroll tax receipts by roughly 0.8 billion dollars a year. More importantly, slower potential growth lowers the denominator of every debt ratio. A one-point reduction in potential growth, sustained for a decade, raises the projected ratio of federal debt to GDP by roughly 10 points relative to a baseline that assumes the old growth path.
For business. Firms should plan for a labor market in which scarcity is structural rather than cyclical. Sectors that relied on immigrant labor, such as construction, agriculture, food processing, home health care and hospitality, face the largest gaps, and the incentive to substitute capital and automation for labor will strengthen. The productivity gains associated with artificial intelligence, if they materialize, will arrive in an economy where they are needed to sustain growth rather than to displace workers.
For political debate. The zero-job economy creates a paradox for every side. Supporters of restrictive immigration can point to stable unemployment as evidence that reduced migration has not hurt native workers. Critics can point to falling participation among the native-born, falling real wages and lower potential growth. Both readings are partly correct, and neither is complete without the breakeven arithmetic.
8. What is new in this study
Several results are, to our knowledge, original. We provide the first twenty-year series of the breakeven pace of employment growth estimated with three independent methods and reconciled in a single table. We report a probability distribution for the 2026 breakeven, including the probability that it is negative (59 percent), rather than a point estimate. We propose a breakeven-adjusted payroll index and a conversion rule that allows any 2026 payroll number to be compared with the experience of 2018 and 2019. We quantify the immigrant share of labor force growth over two decades (53 percent in 2006 to 2016 and 56 percent in 2016 to 2024). And we project the breakeven to 2030 under six migration scenarios, showing that even a return to the pre-2020 norm would not restore the benchmark of the 2010s. Findings that confirm existing work include the near-zero level of the breakeven, consistent with the Federal Reserve staff note and the Yale Budget Lab, and the negative sign of net migration in 2025, consistent with Brookings.
Methodological annex
Data. Annual averages of the civilian labor force, participation rate and unemployment rate are from the Current Population Survey (Bureau of Labor Statistics). Payroll employment changes are December to December changes in total nonfarm employment from the Current Employment Statistics survey, expressed as monthly averages, after the benchmark revisions of February 2025 and February 2026. Values for 2025 and 2026 are Global Strategy Files estimates built from monthly releases through October 2026. The foreign-born labor force is from the household survey (series LNU01073395) and the tabulations of the National Foundation for American Policy.
Population controls. The household survey introduces new population controls each January. We removed the estimated effect on the labor force of the January 2023 (about 0.87 million) and January 2025 (about 2.1 million) adjustments when computing underlying growth. The January 2026 controls are not separately identified and may bias the 2026 figure.
Demographic breakeven. BE equals L times (1 minus u*), where L is the trailing three-year average of the monthly change in the adjusted labor force and u* equals 4.3 percent.
Revealed breakeven. We estimated by ordinary least squares the equation: change in unemployment rate = a + b times monthly payroll gain (in hundreds of thousands), on annual data for 2007 to 2026 excluding 2020 and 2021. Estimates: a = 0.49 (standard error 0.11), b = minus 0.56 (0.05), R squared 0.88. The implied breakeven for year t is the payroll gain minus 100 times the change in unemployment divided by b. A local-level state-space version of the model, in which the intercept follows a random walk, did not find significant time variation in the intercept over the full sample, which is why we rely on rolling and current-year estimates.
Structural model. BE = [(N + 0.8 M) times p + P times d] times (1 minus u*) divided by 12, where N is native-born adult population growth, M net migration, p the participation rate (0.62), P the adult population (274 million) and d the annual change in participation from aging. Distributions: N normal (1.3 million, 0.2 million); M uniform (minus 925,000, plus 185,000); d normal (minus 0.25 points, 0.06 points); p normal (0.62, 0.005). 200,000 draws.
Limitations. Monthly estimates of the foreign-born population are imprecise and depend on population weights. The annual frequency of the regression limits the number of observations. The aging drag is assumed constant within each scenario. Potential growth estimates ignore changes in hours worked and assume trend productivity of 1.6 percent; a sustained productivity acceleration would raise them.
References
Associated Press (2026). US employers added a surprising 165,000 jobs in October; unemployment rate dipped to 4.1 percent. 6 November 2026.
Brookings Institution (2026). Macroeconomic implications of immigration flows in 2025 and 2026: January 2026 update. Washington, DC.
Bureau of Labor Statistics (2026). The Employment Situation, October 2026. Washington, DC, 6 November 2026.
Bureau of Labor Statistics (2026). Consumer Price Index, October 2026. Washington, DC, 10 November 2026.
Center for Immigration Studies (2026). Total foreign-born down 2.9 million. Washington, DC, 3 September 2026.
Congressional Budget Office (2026). The Budget and Economic Outlook: 2026 to 2036. Washington, DC, February 2026.
Congressional Research Service (2026). A Slowdown in U.S. Labor Supply Growth. Insight IN12750, 30 October 2026.
Federal Reserve Bank of Dallas (2026). Breakeven employment growth and the immigration slowdown. Dallas Fed Economics, March 2026.
Murray, S. and I. Vidangos (2026). Labor force growth, breakeven employment, and potential GDP growth. FEDS Notes, Board of Governors of the Federal Reserve System, 2 April 2026.
National Foundation for American Policy (2026). The Decline in the US Labor Force. Policy Brief, September 2026.
Oxford Economics (2026). Baby boomer retirements and breakeven employment. Research briefing.
Yale Budget Lab (2026). Immigration, productivity and the labor market. New Haven, CT.
Driss EFFINA, PhD
Independent Researcher, Global Strategy Files
The opening pages of our four country reports: United States, United Kingdom, Japan and China. A free PDF, sent to your inbox.
You will also receive occasional analysis from Global Strategy Files. Unsubscribe in one click, at any time.