The Petrodollar Inverted: How Energy Independence Rewired the Response of the Dollar to Oil Shocks

Abstract
For most of the modern era, a rise in the price of oil weakened the dollar. The United States was the largest importer of petroleum in the world, so an oil shock widened its trade deficit, transferred income to exporting countries and depressed the American economy relative to others. That relationship has inverted. When the war with Iran closed the Strait of Hormuz in 2026, the dollar index rose by more than 3 percent to a ten-month high, gave back most of the gain when hopes of a ceasefire lowered oil prices in April, and reached an eighteen-month high in October as attacks escalated and Brent stayed about 45 percent above its pre-war level. Market analysts noted that the correlation between the dollar and the price of oil had become a defining feature of the year. This study shows that the change is structural and dates from the transformation of the United States into a net energy exporter. Using twenty years of data, we find that the correlation between annual changes in the dollar index and in the price of Brent crude was minus 0.78 over 2006 to 2014 and plus 0.69 over 2020 to 2026. A rolling six-year correlation moved from minus 0.95 in 2014 and 2015 to plus 0.73 in 2025. In a regression in which the sensitivity of the dollar to oil depends on American net petroleum imports, the interaction is statistically significant: the oil beta of the dollar was about minus 0.15 when the United States imported 12.4 million barrels a day in 2006, crossed zero when net imports fell below about 2.9 million barrels a day around 2018, and is about plus 0.09 at net exports of 3 million barrels a day in 2026. A 10 dollar increase in the price of oil, which once worsened the American petroleum balance by about 45 billion dollars a year, now improves it by about 11 billion. The dollar has acquired some of the features of a commodity currency on top of its role as a safe haven. We argue that this explains why the dollar behaved as a refuge in 2026 after failing to do so in 2025: it rises in shocks that originate abroad and raise energy prices, and falls in shocks that originate in American policy. The inversion changes the international transmission of oil shocks: it partly shields the United States from imported inflation, and it hits energy-importing emerging economies twice, through the price of oil and through a stronger dollar.
Key findings
- The correlation between annual changes in the dollar index and in Brent crude was minus 0.78 in 2006 to 2014 and plus 0.69 in 2020 to 2026.
- The rolling six-year correlation turned positive in 2020 and reached plus 0.73 in 2025.
- The oil sensitivity of the dollar depends on the American petroleum balance: it fell by about 0.016 for each million barrels a day of net imports (p value 0.015), and crosses zero at net imports of about 2.9 million barrels a day.
- A 10 dollar rise in oil prices improves the American petroleum trade balance by about 11 billion dollars a year in 2026, against a deterioration of about 45 billion in 2006.
- In 2026 the dollar index rose about 3 percent in the first weeks of the war, fell back when oil fell in April and reached an eighteen-month high in October, tracking oil more closely than at any time in the sample.
- The dollar fell about 11 percent in 2025, when the shock originated in American trade and monetary policy, and rose in 2026, when the shock originated abroad. The safe-haven role of the dollar is conditional on the origin of the shock.
1. Introduction: a currency that now likes expensive oil
In the first quarter of 2025, many investors concluded that the dollar had lost its status as a safe haven. After the announcement of broad tariffs in April, long-term American interest rates rose while the dollar fell, a combination more typical of emerging markets than of the issuer of the world's reserve currency. Over the first half of 2025 the dollar index fell by about 11 percent, its worst first half in decades, and by the end of the year it had lost roughly 10 percent, ending what Morgan Stanley described as a fifteen-year bull cycle. Commentators spoke of a broken dollar smile, the theory according to which the dollar rises both when the American economy outperforms and when the world is in crisis.
The war with Iran seemed to repair the smile. When American and Israeli strikes began at the end of February 2026 and Iran closed the Strait of Hormuz, the dollar index rose from about 97.6 to a ten-month high of 100.64. Gold, the Swiss franc and the Japanese yen, the usual alternatives, did not hold up. When President Trump postponed strikes on Iranian energy infrastructure in late March and talks raised hopes of a ceasefire, oil prices fell and the dollar gave back most of its gains; by mid-April the index was at 98.1, close to its pre-war level. In October, after new attacks in the Gulf, the dollar held at an eighteen-month high, with Brent still about 45 percent above its pre-war price.
What the market discovered in 2026 was not only that the dollar could still behave as a refuge, but that it now moved with the price of oil. Traders described the correlation between the dollar index and Brent as a defining feature of the conflict. This study asks whether that correlation is new, why it appeared, and what it implies. Our answer is that it is new, that it is the currency counterpart of the transformation of the United States from the largest importer of petroleum to a large net exporter, and that it changes how oil shocks are transmitted across the world.
Section 2 describes the energy transformation in terms that matter for currencies. Section 3 measures the relationship between the dollar and oil over twenty years. Section 4 estimates a model in which the sensitivity of the dollar to oil depends on the petroleum balance. Section 5 analyzes the episodes of 2025 and 2026. Section 6 discusses the implications for inflation, monetary policy, emerging markets and the safe-haven role of the dollar.
2. From importer to exporter: the energy balance as a currency fundamental
2.1 The petroleum balance
In 2006, the United States imported, net of exports, about 12.4 million barrels a day of crude oil and petroleum products. At an oil price of 60 to 70 dollars, the petroleum deficit represented about 290 billion dollars a year, a large part of the current account deficit. Every increase in the price of oil widened it further. By 2019 net imports had fallen below 1 million barrels a day, in 2020 the country became a net exporter, and in 2026 net exports are about 3 million barrels a day, while LNG exports have grown from nothing to about 17 billion cubic feet a day.
The currency implications follow from simple arithmetic. Figure 1 shows the effect of a 10 dollar increase in the price of a barrel on the American petroleum trade balance in each year, holding volumes constant. In 2006 it would have widened the deficit by about 45 billion dollars a year. By 2014 the effect had fallen to about 19 billion, by 2019 to less than 3 billion, and in 2026 it improves the balance by about 11 billion. Adding natural gas, whose world price rises with oil in a crisis like that of 2026, the improvement is larger.

2.2 Terms of trade and growth
The petroleum balance is not the only channel through which oil affects a currency. Oil shocks also change the relative growth prospects of countries: they depress growth in importers, raise investment and income in producers, and shift the relative path of interest rates. In 2026, the United States combined three features that tend to strengthen a currency in an oil shock: improved terms of trade, a domestic energy investment boom concentrated in the Gulf Coast and the Permian Basin, and a central bank that responded to higher inflation by tightening. The euro area and Japan, both large energy importers, faced deteriorating terms of trade and weaker growth.
2.3 Beyond oil: a record energy surplus
The petroleum balance understates the change, because natural gas has become a major export. Total American energy exports reached a record 31 quadrillion British thermal units in 2025, and net energy exports reached a record 11 quads, 20 percent more than the previous record set in 2024. Natural gas exports, almost all of them as LNG to Europe and Asia, were a record 9 quads, about 29 percent of energy exports, four times their level of 2015. In a crisis like that of 2026, in which Iranian strikes damaged about 17 percent of Qatar's LNG capacity and the closure of Hormuz cut off about a fifth of world LNG supply, the value of these exports soared. American LNG exporters loaded a record of about 32 million tonnes in the first four months of the year, and about 73 million tonnes in the first seven.
For the currency, the relevant point is that the United States now benefits from high energy prices on two fronts. When oil and gas prices rise together, as they do in a Gulf crisis, the improvement in the American energy balance is larger than the petroleum arithmetic alone suggests, and the deterioration in the balances of Europe and East Asia, which import both, is larger as well. The relative terms-of-trade shock between the United States and its main currency partners is therefore stronger than at any time in the past.
2.4 A short history of the dollar in oil shocks
Each major oil shock of the past fifty years tells the same story under the old regime. In 1973 and 1979, the dollar weakened against the Deutsche mark and the yen as the American import bill soared, even though Germany and Japan imported a larger share of their energy; the effect was dominated by the size of the American market and by inflation. In 2007 and 2008, as oil rose toward 147 dollars, the dollar index fell to its lowest level since its creation, and analysts linked the two through the recycling of petrodollars into other currencies. In 2011, during the Libyan war, oil rose and the dollar weakened again. The 2022 invasion of Ukraine was the first major energy shock in which the dollar rose strongly together with oil, and at the time the move was attributed mainly to the Federal Reserve's aggressive tightening and to the flight to safety. The 2026 war, in which the Federal Reserve was tightening less dramatically, shows that the energy channel itself has changed sign.
3. Twenty years of the dollar and oil
3.1 The data
We use end-of-year values of the ICE dollar index, which measures the dollar against six major currencies dominated by the euro and the yen, and of the price of Brent crude, from 2005 to 2026, with the 2026 values taken in the autumn. We compute annual log changes, which approximate percentage changes. Annual data are coarse, but they filter out the noise of daily and monthly movements and capture the persistent component of the relationship, which is what matters for a structural question.
Figure 2 shows the level of the dollar index over the period. The dollar fell from about 91 in 2005 to a low near 77 in 2007 and 2008, as oil soared and the American current account deficit peaked; rose during the financial crisis; stayed near 80 during the years of quantitative easing; appreciated sharply in 2014 and 2015, when oil collapsed; peaked near 108.5 at the end of 2024; fell to about 97 in 2025; and recovered to about 100 to 101 in 2026.

3.2 Two regimes
The relationship between annual changes in the dollar and in oil splits into two regimes. Table 1 reports correlations and slopes for different subperiods, and Figure 3 plots the annual observations.
Table 1. The dollar and oil: correlation of annual log changes
| Period | Correlation | Slope (dollar change per unit of oil change) | Average net petroleum imports (million b/d) |
|---|---|---|---|
| 2006 to 2014 | -0.78 | -0.11 | 9.1 |
| 2006 to 2019 | -0.68 | -0.11 | 7.0 |
| 2015 to 2026 | 0.13 | 0.03 | 0.6 |
| 2020 to 2026 | 0.69 | 0.20 | -1.3 |
Source: ICE; EIA; Global Strategy Files calculations.
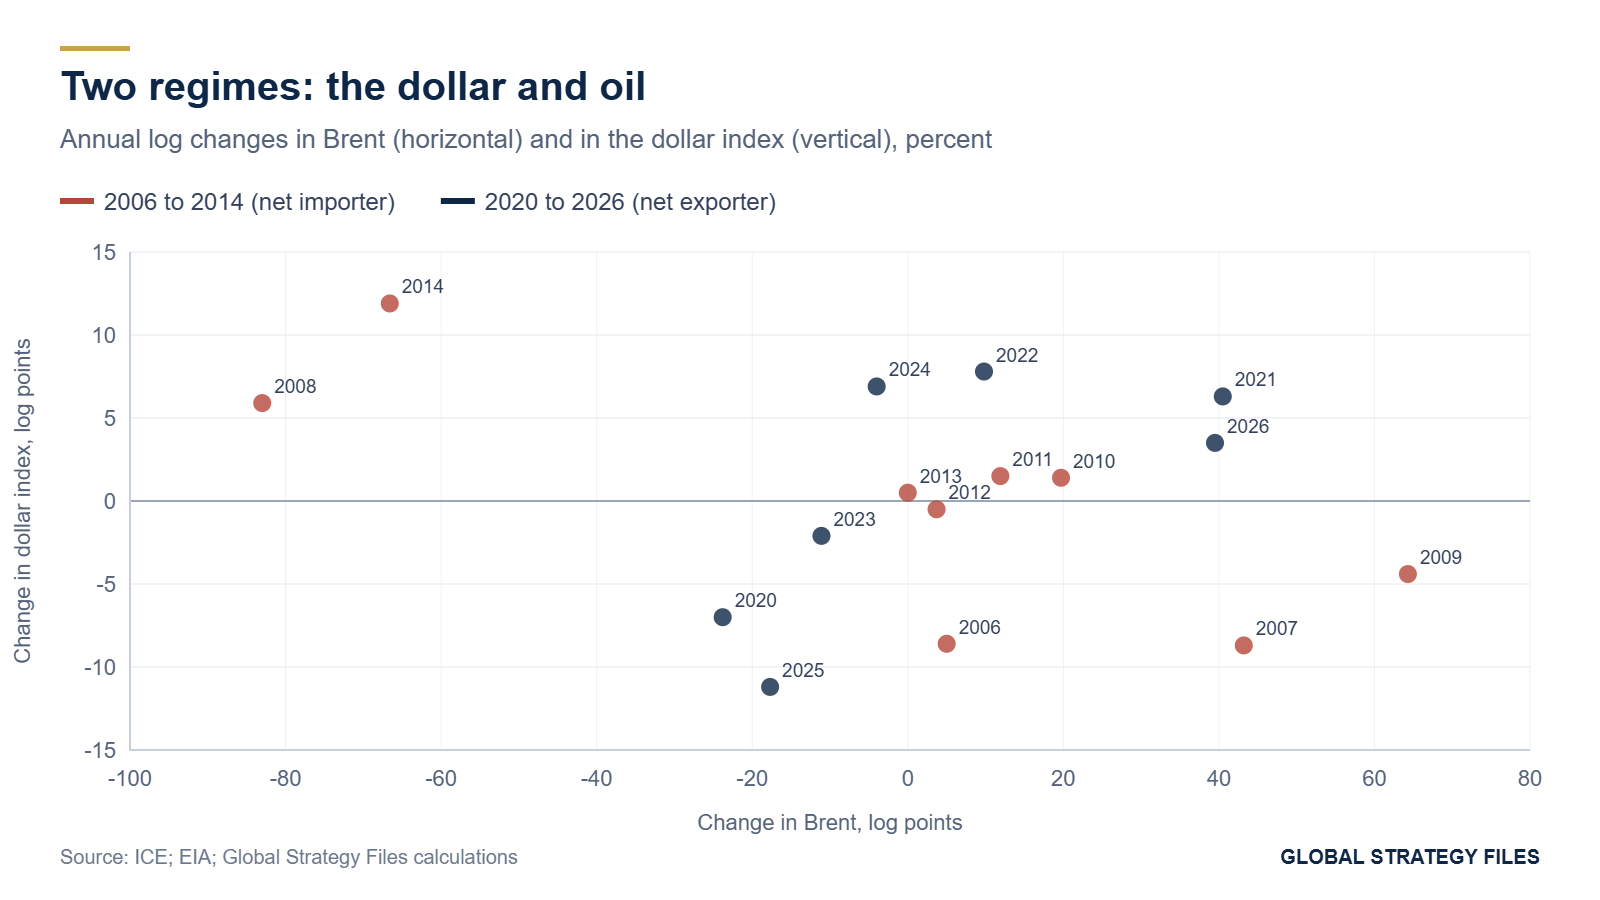
In the first regime, from 2006 to 2014, the correlation was strongly negative: the dollar fell when oil rose and rose when oil fell. The largest movements confirm the pattern: in 2007 oil rose by about 43 log points and the dollar fell by about 9; in 2008 oil collapsed by 83 points and the dollar rose by 6; in 2014 oil fell by 67 points and the dollar rose by 12. In the second regime, from 2020 to 2026, the correlation is strongly positive: in 2021 oil rose by 41 points and the dollar by 6; in 2022 oil rose by 10 and the dollar by 8; in 2025 oil fell by 18 and the dollar by 11; in 2026 oil rose by about 40 and the dollar by about 3.5. The years 2015 to 2019 were a transition, with a weak relationship.
3.3 The rolling correlation
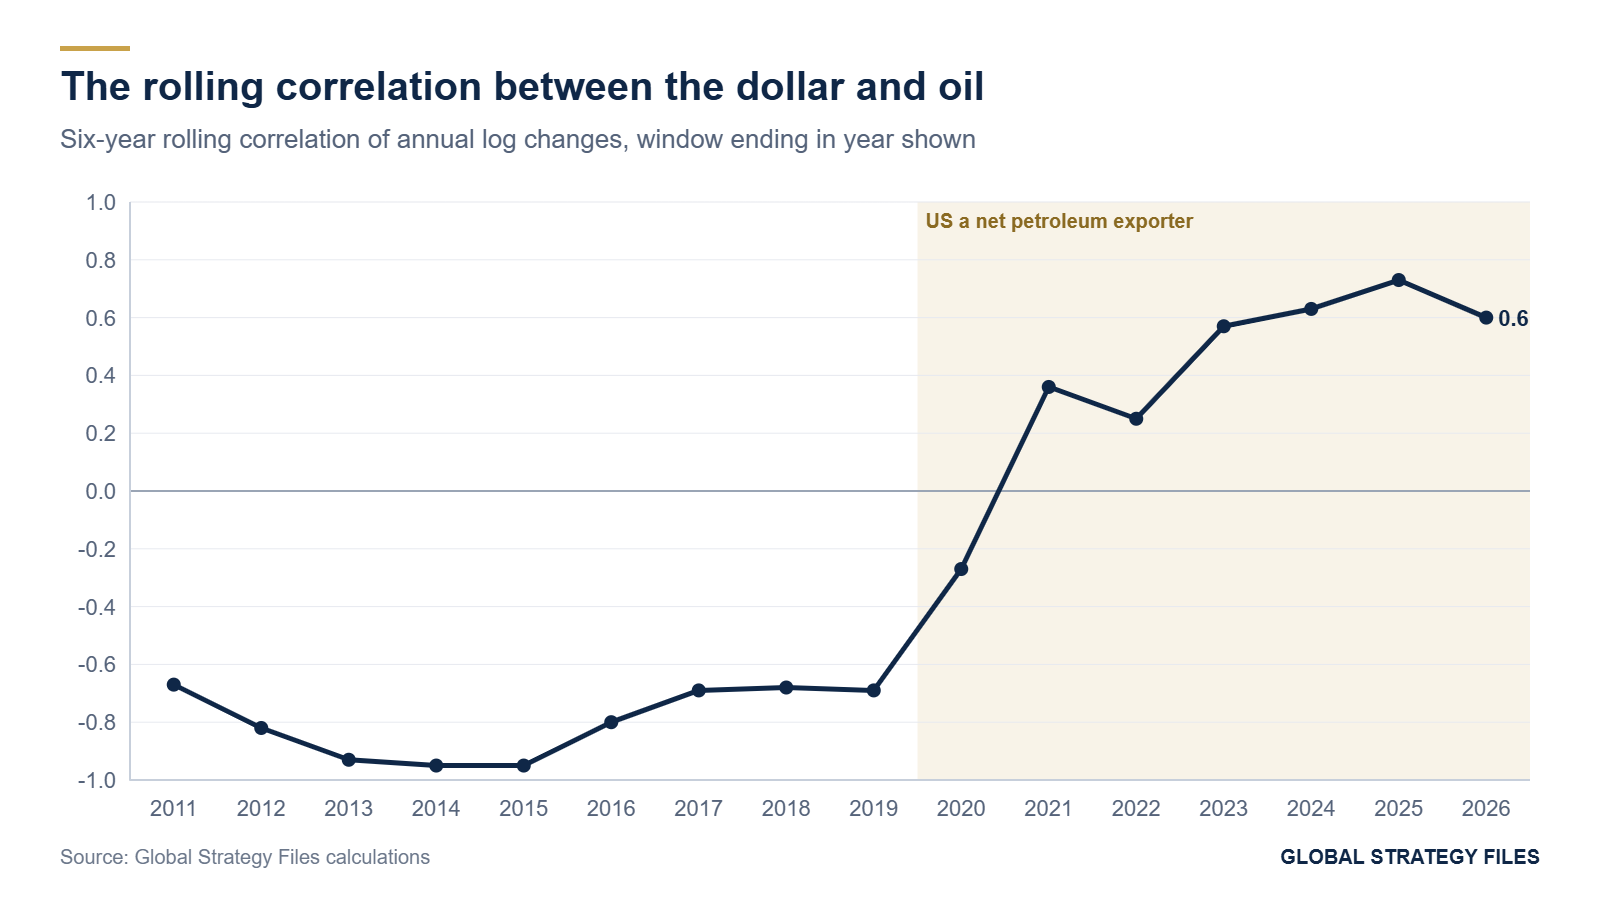
Figure 4 shows a rolling six-year correlation. It was strongly negative, between minus 0.67 and minus 0.95, in every window ending between 2011 and 2019. It turned positive in the window ending in 2021, and has stayed positive since, reaching plus 0.73 in the window ending in 2025 and plus 0.60 in the window ending in 2026. The timing coincides with the moment the United States became a net petroleum exporter, in 2020.
4. A model of the oil sensitivity of the dollar
4.1 Specification
If the sign of the relationship reflects the petroleum balance, the sensitivity of the dollar to oil should depend on the size of net petroleum imports. We estimate, over 2006 to 2026:
change in dollar = a + b times change in oil + c times (change in oil times net petroleum imports),
where net petroleum imports are measured in millions of barrels a day. The oil beta of the dollar in a given year is b + c times net imports. If c is negative, the dollar becomes less sensitive to oil, and eventually positively related to it, as net imports fall.
4.2 Results
Table 2 reports the estimates. The interaction coefficient c is negative and significant (minus 0.0159, p value 0.015 with robust standard errors). The coefficient b is positive but not significant on its own. The model explains 27 percent of the annual variation of the dollar, which is substantial for a single commodity variable in a currency equation.
Table 2. The oil sensitivity of the dollar, 2006 to 2026
| Coefficient | Estimate | p value |
|---|---|---|
| Constant | 0.54 | 0.69 |
| Oil price change (b) | 0.046 | 0.47 |
| Oil price change times net petroleum imports (c) | -0.0159 | 0.015 |
| R squared | 0.27 | |
| Implied oil beta at 12.4 million b/d of net imports (2006) | -0.15 | |
| Implied oil beta at 5 million b/d (2014) | -0.03 | |
| Implied oil beta at zero net imports (2020) | 0.05 | |
| Implied oil beta at 3 million b/d of net exports (2026) | 0.09 | |
| Net imports at which the beta changes sign | about 2.9 million b/d |
Source: Global Strategy Files estimates; robust (HC1) standard errors; annual log changes in percent.
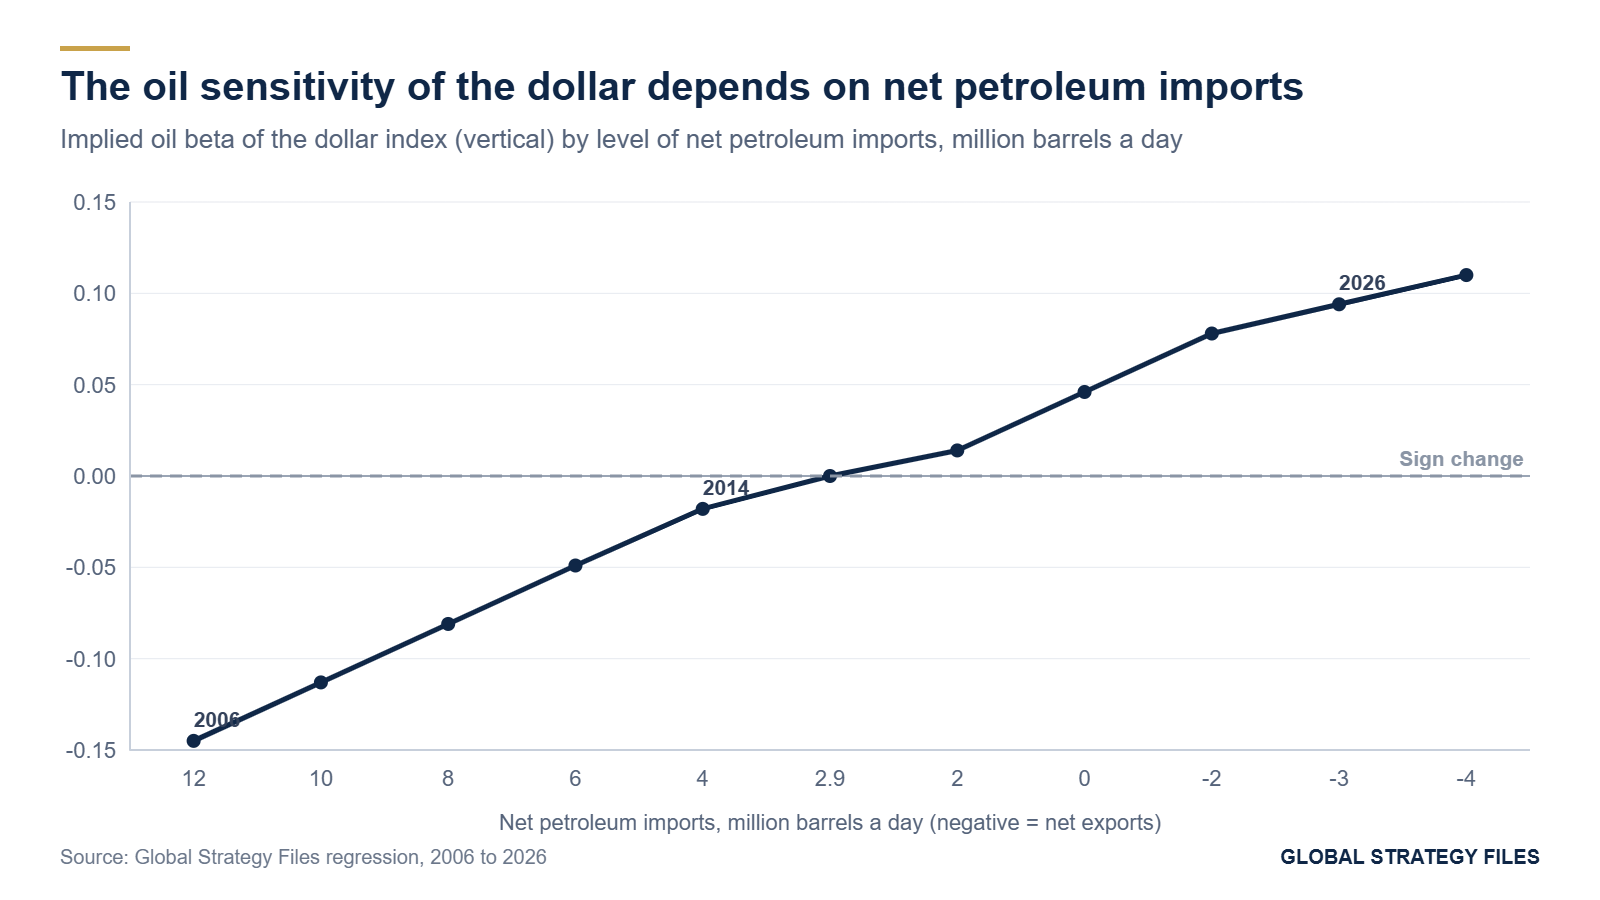
The implied beta crosses zero when net imports fall below about 2.9 million barrels a day, a threshold that the United States crossed in 2018. In 2006, a 10 percent rise in oil was associated with a 1.5 percent fall in the dollar; in 2026, it is associated with a rise of about 0.9 percent. Figure 5 shows the implied beta as a function of net imports, with the position of selected years.
4.3 Robustness and caveats
The result rests on 21 annual observations and should be read with caution. The petroleum balance trends steadily over the period, so the interaction may partly capture other trends that changed the behavior of the dollar, such as the rise of the United States as a destination for global equity investment, or the changing composition of risk shocks. Three observations nevertheless support the interpretation. The timing of the sign change matches the timing of the energy transformation. The mechanism is supported by the arithmetic of the trade balance. And the same pattern is well documented for the currencies of large net energy exporters, such as the Canadian dollar and the Norwegian krone, whose correlation with oil is positive and strong.
4.4 What the model implies for 2027
The model can be used to translate oil price scenarios into currency effects, holding everything else constant. With an oil beta of about 0.094 at current net exports, each 10 log points of change in Brent moves the dollar index by about 0.9 log points in the same direction. Table 3 applies this to four scenarios for the average price of Brent in 2027 relative to its 2026 level of about 96 dollars.
Table 3. Oil scenarios for 2027 and the implied effect on the dollar index
| Scenario | Brent in 2027 (dollars) | Change in oil (log points) | Implied change in dollar index (log points) |
|---|---|---|---|
| Durable peace in the Gulf | 65 | -39 | -3.7 |
| Official forecast (EIA, November 2026) | 86 | -11 | -1.0 |
| Prolonged tension | 100 | +4 | +0.4 |
| Renewed escalation | 130 | +30 | +2.9 |
Source: Global Strategy Files calculations using the interaction model; the effects are partial and ignore other determinants of the dollar.
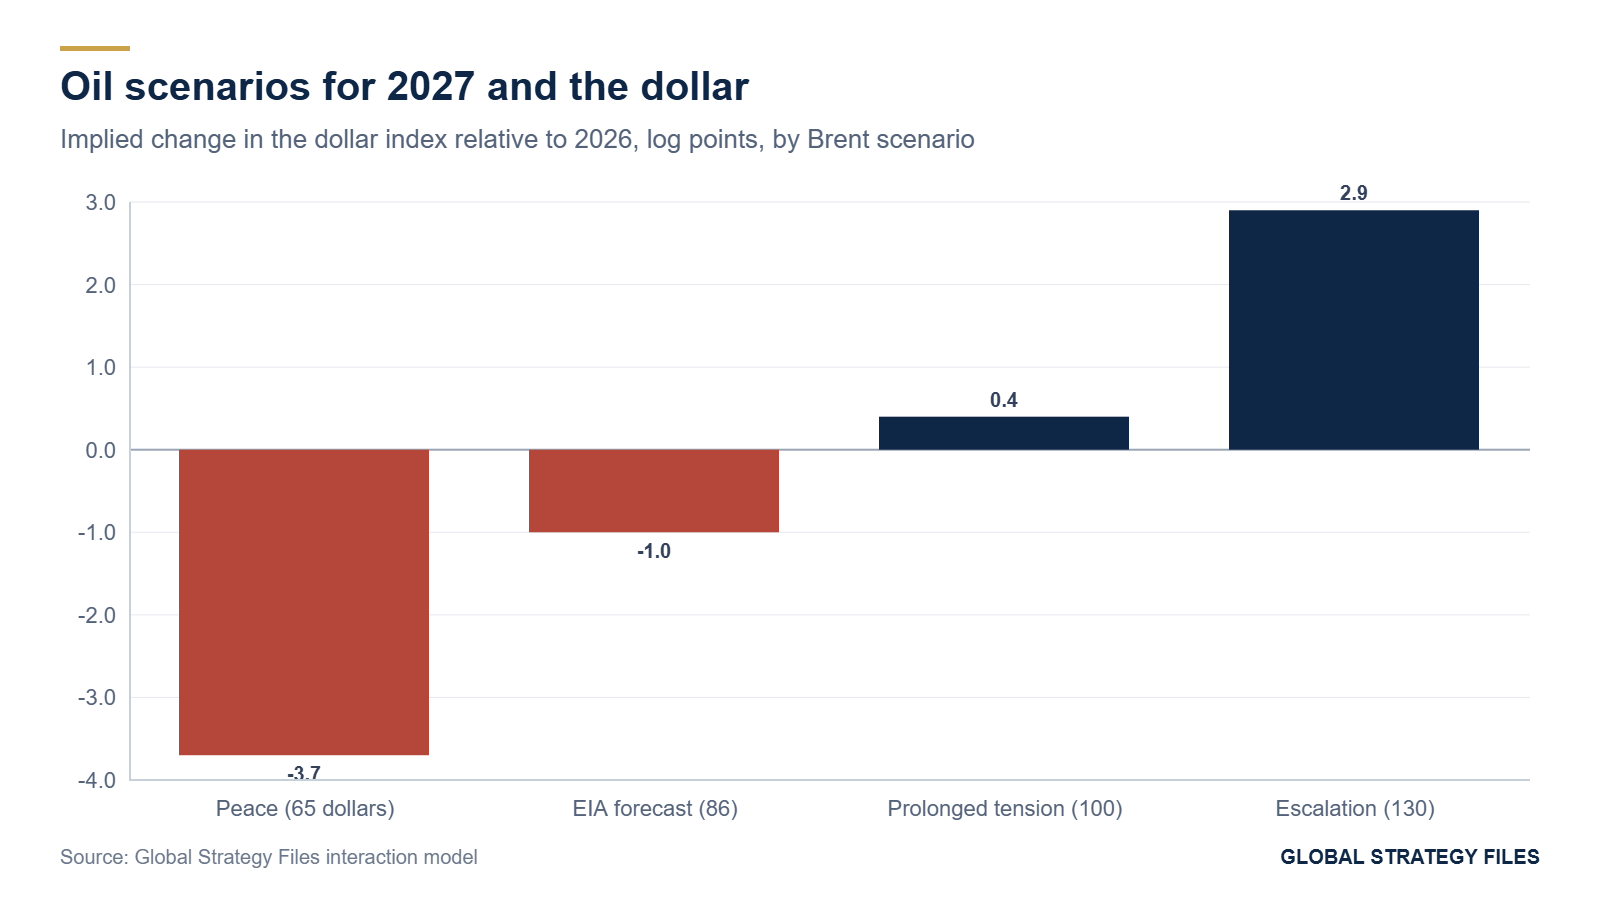
These effects are modest relative to the normal annual volatility of the dollar, which is in the order of 6 to 8 percent. Oil has become a positive factor for the dollar, not the dominant one. But the direction of the effect matters for policy and for markets: a peace in the Gulf, which would be good news for the world economy and for American consumers, would now remove a source of support for the dollar, and a renewed escalation would add to it. In the old regime, the opposite was true.
The model also suggests that the oil sensitivity of the dollar will continue to rise if American net energy exports grow further, as the Energy Information Administration projects for LNG and crude oil in 2027. If net petroleum exports reached 5 million barrels a day, the oil beta would rise to about 0.13, still far below those of established commodity currencies, but large enough to make the price of oil a regular component of the dollar outlook.
5. Two shocks, two answers: 2025 and 2026
5.1 The war of 2026, step by step
The events of 2026 provide a natural experiment for the new relationship, because oil prices moved sharply in both directions within a few weeks, driven by news about the war. Table 4 summarizes the main episodes.
Table 4. The dollar and oil during the 2026 war
| Date | Event | Dollar index | Brent |
|---|---|---|---|
| Late February | Before the strikes | about 97.6 | about 70 dollars |
| Early March | Strikes and closure of Hormuz | above 98.5, five-week high | sharply higher |
| Mid to late March | Escalation | 10-month high of 100.64 | above 100 dollars |
| 23 March | Postponement of strikes on energy infrastructure | intraday above 100, closes near 99.1 | sharp fall |
| Mid-April | Hopes of a ceasefire | 98.1, more than 80 percent of war gains reversed | lower |
| Early May | Peak of the oil shock | about 98.9 at end of May | about 115 dollars |
| June | Hot inflation data; new strikes | near 100, 10-week high | high |
| October | Renewed attacks in the Gulf | 18-month high | about 45 percent above pre-war |
Source: press reports (Reuters, FXStreet, Trading Economics, DBS, MarketWatch); values approximate.
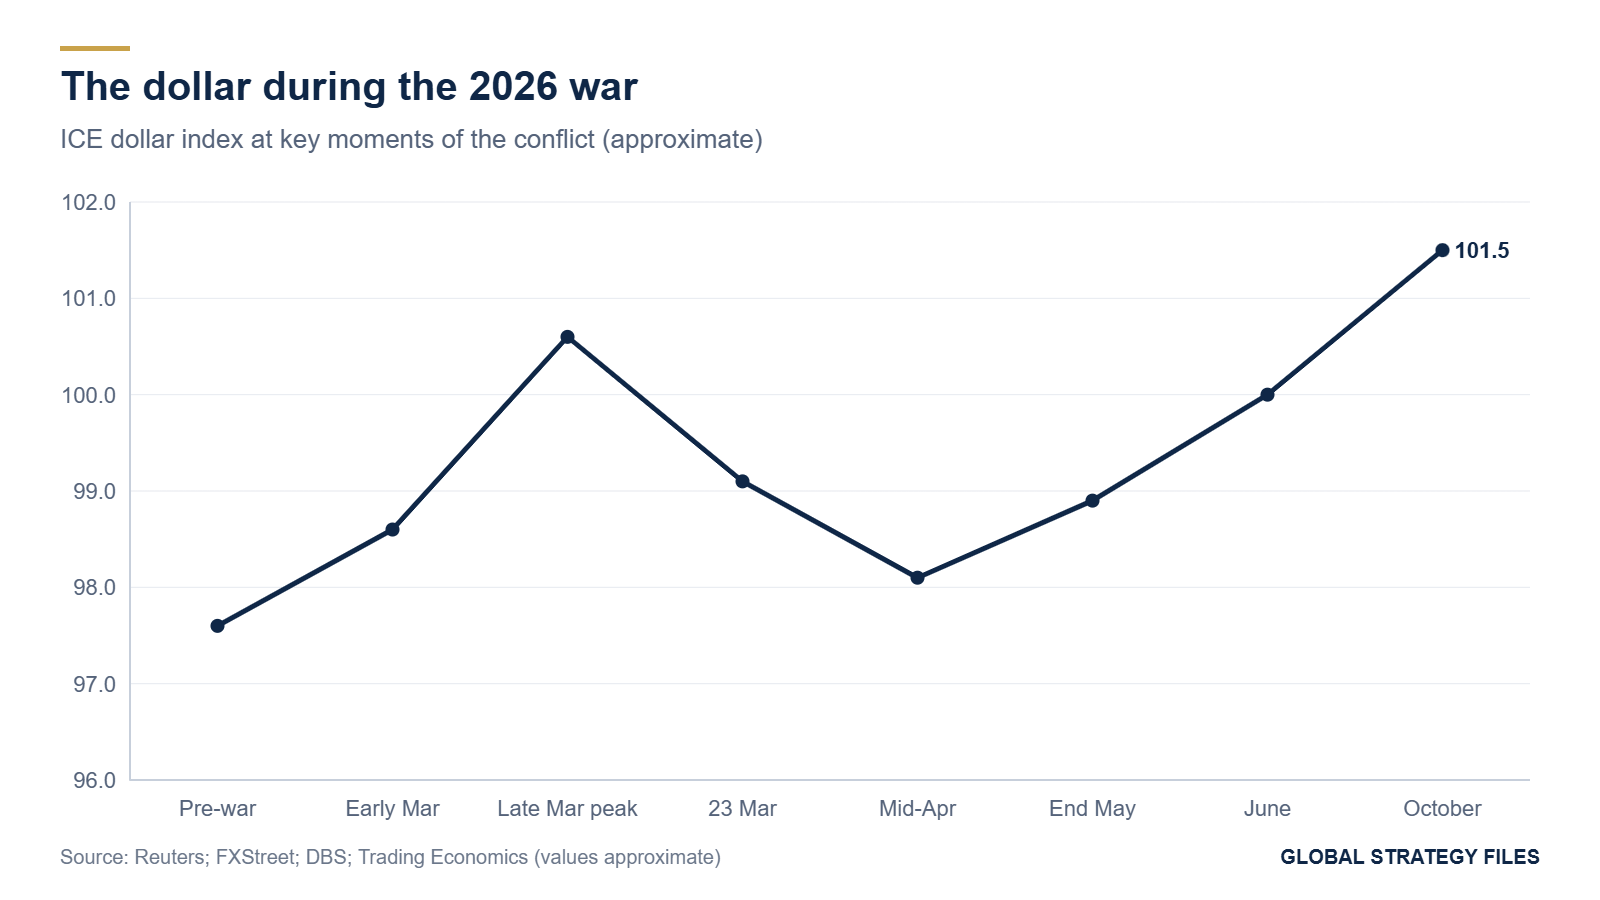
The sequence shows a currency that rose and fell with the expected path of oil and of the war. When the conflict escalated, oil and the dollar rose together; when diplomacy raised hopes of a ceasefire, both fell. Analysts noted that the higher correlation between the dollar index and Brent was a defining feature of markets since the war started, and that the dollar, rather than gold, the franc or the yen, provided protection for global equity portfolios. Our model offers a structural explanation: in a world where the United States exports energy, a war that raises the price of energy is, in currency terms, a positive shock for the United States relative to Europe and Japan.
5.2 Why 2025 was different
The fall of the dollar in 2025 is not a contradiction of this explanation; it is its complement. The shocks of 2025 originated in American policy: the broad tariffs announced in April, which raised the risk of a recession in the United States and of retaliation against American exporters, and public pressure on the Federal Reserve, which raised questions about the independence of monetary policy. These were American shocks, and in American shocks the dollar behaves like any other currency: it falls when the country's prospects or institutions are questioned. Oil fell in 2025 as well, by about 18 log points, which in the new regime added to the dollar's decline.
The lesson is that the safe-haven role of the dollar is conditional. The dollar rises in shocks that originate abroad and that leave the United States relatively better off, such as a war in the Middle East that raises energy prices or a crisis in Europe. It does not rise, and may fall, in shocks that originate in Washington. The broken dollar smile of 2025 and the repaired smile of 2026 are two sides of the same rule. The energy transformation has strengthened the first side of the rule: a foreign oil shock is now doubly favorable to the dollar, as a flight to safety and as a terms-of-trade gain.
5.3 The dollar against the world: a split
The dollar index is dominated by the euro and the yen, the currencies of two large energy importers. Against a broader basket that includes the currencies of energy exporters and emerging economies, the picture is different: the Federal Reserve's broad dollar index was about 1.3 percent lower in mid-September 2026 than at the start of the year, even as the six-currency index was higher, and the yield advantage of American bonds over a weighted average of foreign bonds widened from 0.96 to 1.11 points. The dollar rose against the currencies of countries that import energy and was flat or lower against those of commodity exporters, a pattern consistent with an oil-driven rather than a pure safe-haven move.
6. Implications
For inflation and monetary policy. In the old regime, an oil shock raised American inflation twice: directly, through energy prices, and indirectly, through a weaker dollar that raised the price of imports. In the new regime, the second channel works in reverse. A stronger dollar during an oil shock lowers the dollar price of non-energy imports and partly offsets the direct effect. The offset is small, an oil beta of about 0.09 implies that a 40 percent rise in oil raises the dollar by about 3.5 percent, but it is a new automatic stabilizer that the Federal Reserve should incorporate in its assessment of the inflationary impact of energy shocks.
For emerging markets. For energy-importing emerging economies, especially those with dollar debts, the new regime is unfavorable. An oil shock now raises their import bill and strengthens the dollar at the same time, tightening their financial conditions when their current accounts deteriorate. The 2026 shock combined higher oil, a stronger dollar against importers and higher American yields, a triple squeeze on countries such as India, Turkey or Pakistan.
For Europe and Japan. The euro and the yen have become, in effect, short-oil currencies against the dollar. A war in the Middle East now weakens them against the dollar through the terms of trade, independently of any flight to safety. European and Japanese policymakers who rely on a stable exchange rate to contain imported inflation face a worse trade-off than in the past.
For investors. A long position in the dollar against the euro or the yen has become a partial hedge against oil shocks and geopolitical crises in energy-producing regions. Conversely, portfolios that held dollars as a hedge against American policy shocks learned in 2025 that the dollar offers no protection when the shock originates in the United States.
For the Treasury market. In the old regime, oil shocks tended to lower American long-term yields through weaker growth expectations, while weakening the dollar. In 2026, oil shocks raised yields, through inflation expectations and the expected path of the Federal Reserve, and strengthened the dollar at the same time. For foreign investors in Treasuries, the combination is ambiguous: they lose on bond prices and gain on the currency. For foreign investors who hedge their currency exposure, as most private holders now do, the hedge removes the currency gain, and only the loss on bond prices remains, which helps explain the persistence of a positive term premium during the war.
For American consumers. The new regime does not protect households from energy shocks: they pay world prices for gasoline and diesel whatever the exchange rate. But a stronger dollar lowers the cost of imported goods and of foreign travel, a partial and unevenly distributed compensation that accrues mostly to higher-income households, while the pain of fuel prices falls more heavily on lower-income and rural households.
For the international role of the dollar. The inversion does not weaken the reserve role of the dollar; it changes its character. The dollar is now a reserve currency issued by a large commodity exporter, a combination without precedent. This makes the dollar more attractive in energy crises and more volatile in energy busts. A sustained fall in oil prices, for example after a durable peace in the Gulf or a collapse of demand, would now weigh on the dollar, which was not the case for most of its history.
7. What is new in this study
To our knowledge, this study is the first to document, with twenty years of data, the inversion of the relationship between the dollar and oil, from a correlation of minus 0.78 in 2006 to 2014 to plus 0.69 in 2020 to 2026, and to link it formally to the American petroleum balance through an interaction model in which the oil sensitivity of the dollar changes sign at net imports of about 2.9 million barrels a day. It provides an event table of the 2026 war that shows the co-movement of the dollar and oil, and it proposes a unified explanation of the dollar's weakness in 2025 and strength in 2026 based on the origin of shocks. The observation that the dollar acted as a safe haven during the 2026 war confirms market commentary; the structural explanation and its quantification are new.
Methodological annex
Data. End-of-year ICE dollar index and Brent crude prices for 2005 to 2025, and autumn 2026 values (dollar index about 100.5, Brent about 92 dollars). Net petroleum imports from the Energy Information Administration, with Global Strategy Files estimates for 2023 to 2026.
Model. Ordinary least squares on 21 annual observations (2006 to 2026): change in log dollar index (times 100) = a + b times change in log Brent (times 100) + c times change in log Brent times net petroleum imports (million barrels a day). Robust standard errors (HC1). The oil beta in a year is b + c times net imports.
Rolling correlation. Pearson correlation of annual log changes over six-year windows ending in each year from 2011 to 2026.
Trade balance effect. Net petroleum imports times 10 dollars times 365 days, holding volumes constant.
Limitations. Annual data limit the sample. The dollar index covers only six currencies. The interaction term may capture other trends correlated with the energy transformation. The event table uses approximate values from press reports.
References
Energy Information Administration (2026). Petroleum Supply Monthly and Short-Term Energy Outlook. Washington, DC.
Reuters (2026). Dollar sheds bulk of Iran war premium but few expect a sharper drop. April 2026.
Reuters (2026). Dollar holds 18-month high as Gulf tension, US inflation keep investors on edge. 12 October 2026.
MarketWatch (2026). This is the real reason behind the U.S. dollar's climb as the Iran conflict drags on. 14 April 2026.
DBS Group Research (2026). DXY: war gains unwind as allies resist blockade. April 2026.
FXStreet (2026). US Dollar Index reverses sharply on Iran de-escalation hopes. 23 March 2026.
Khaleej Times (2026). Iran conflict: US dollar regains status as safe haven. 30 March 2026.
Morgan Stanley (2026). The end of the dollar bull cycle. Research note.
Federal Reserve Board (2026). Nominal broad dollar index (H.10).
Trading Economics (2026). Dollar index news stream, March to June 2026.
Driss EFFINA, PhD
Independent Researcher, Global Strategy Files
The opening pages of our four country reports: United States, United Kingdom, Japan and China. A free PDF, sent to your inbox.
You will also receive occasional analysis from Global Strategy Files. Unsubscribe in one click, at any time.