The Locked Nation: Mortgage Rate Lock-In, a Frozen Housing Market and the Return of Delinquency

Abstract
The American housing market has been frozen for four years. Sales of existing homes fell from 6.12 million in 2021 to 4.09 million in 2023 and have stayed near 4 million since, the lowest level in three decades; in September 2026 they ran at an annual rate of 3.99 million, and pending sales were 11.3 percent lower than a year earlier as mortgage rates returned toward 7.5 percent. At the same time, the share of mortgage balances moving into serious delinquency has risen for three years, from 0.4 percent in 2021 to 1.60 percent in the third quarter of 2026. This study examines the two phenomena together with twenty years of data. We first measure the lock-in effect, the reluctance of owners to sell a home financed at a low rate when new mortgages cost far more. We define the rate gap as the difference between the rate on new thirty-year mortgages and the average rate on outstanding mortgages, and show that it explains a large part of the variation in the housing turnover rate since 2006: each point of gap reduces turnover by about 0.94 points, controlling for unemployment. With a gap of about 2.6 points in 2026, the lock-in removes about 2.1 million sales a year, a third of the normal market. Because the average rate on outstanding mortgages rises only about 0.15 points a year, the gap would take more than ten years to fall below one point at current market rates: the lock-in is a decade-long feature of the economy, not a passing phase. We then show that the rise in mortgage delinquency is not mysterious: a simple model based on unemployment and house price growth, estimated over 2006 to 2026, explains 86 percent of its variation and predicts the 2026 rate almost exactly. The danger lies ahead. Home prices have risen for 39 consecutive months but are now barely growing; if they fall 3 percent while unemployment rises to 4.5 percent, the delinquency flow would rise to about 2.3 percent, and in a recession with prices down 6 percent, to about 3.1 percent, the highest since 2011. The locked nation is a nation in which few people move and in which the cushion of rising home prices that protected borrowers since 2012 is disappearing.
Key findings
- The turnover rate of owner-occupied homes fell from 7.4 percent in 2021 to about 4.6 percent in 2026, the lowest in the twenty-year sample, below the trough of the housing crisis (5.5 percent in 2008).
- The rate gap between new and outstanding mortgages was close to zero or negative from 2006 to 2021 and has been between 2.4 and 3.0 points since 2023.
- In a regression of turnover on the rate gap and unemployment, each point of rate gap reduces the turnover rate by 0.94 points (p value below 0.001; R squared 0.73).
- The lock-in removed about 2.1 million existing home sales in 2026. Without it, sales would have been about 6.1 million instead of 4 million.
- At current market rates, the rate gap would fall below one point only after more than ten years. Even with mortgage rates at 6 percent by 2030, sales would recover only to about 5.4 million.
- Mortgage delinquency is well explained by unemployment and house price growth (R squared 0.86); the model predicts 1.61 percent for 2026 against 1.60 percent observed. A 3 percent fall in prices with unemployment at 4.5 percent would raise it to about 2.3 percent.
1. Introduction: the market that stopped moving
In a normal year in the United States, about 7 percent of owner-occupied homes change hands. Families move for jobs, for schools, to have more space or less, to be closer to relatives, or to retire. These moves are the main channel through which the housing stock is reallocated to the people who value it most, and through which workers move to where jobs are. They also generate economic activity: commissions, mortgage originations, moving services, furniture and renovation.
Since 2022, Americans have stopped moving. Existing home sales fell by a third between 2021 and 2023 and have not recovered. In 2024 and 2025, sales totaled about 4.06 million each year, and in the first nine months of 2026 they ran at a similar pace, with the two months to September the slowest of the year. The cause is widely understood: most homeowners hold a fixed-rate mortgage taken out or refinanced when rates were 3 to 4 percent, and selling would mean replacing it with a mortgage at 6.5 to 7.5 percent. A household with a 400,000 dollar loan at 3 percent pays about 1,690 dollars a month in principal and interest; the same loan at 7 percent costs about 2,660 dollars. Staying put is the rational choice.
The lock-in effect has been widely discussed, but three questions remain open. How large is it, in sales lost, relative to other causes such as affordability and the labor market? How long will it last? And is the freeze related to the steady rise in mortgage delinquency that has accompanied it? This study answers them with twenty years of data. Section 2 describes the long history of turnover, mortgage rates and the rate gap. Section 3 estimates the lock-in effect. Section 4 projects its duration. Section 5 turns to delinquency. Section 6 presents scenarios for 2027 to 2030, and Section 7 discusses implications.
2. Twenty years of housing turnover
2.1 Sales and turnover
Figure 1 shows existing home sales and the turnover rate, defined as sales divided by the number of owner-occupied homes. Sales peaked near 6.5 million in 2006 at the end of the housing boom, collapsed to about 4.1 million in 2008 during the crisis, recovered gradually to 5.3 to 5.5 million between 2015 and 2019, and jumped to 6.12 million in 2021, when mortgage rates were at record lows and the pandemic drove a search for space. They then fell to 5.03 million in 2022 and about 4.1 million in 2023 to 2025.

Because the stock of owner-occupied homes has grown, from about 75 million in 2006 to about 87 million in 2026, the turnover rate gives a better measure of mobility than the number of sales. It was 8.6 percent in 2006, fell to about 5.5 percent in 2008, recovered to about 7 percent in 2015 to 2021 and fell to 4.8 percent in 2023 and about 4.6 percent in 2026. The current rate is the lowest in the twenty-year sample, lower even than at the depth of the housing crisis.
2.2 The rate gap
The lock-in effect depends not on the level of mortgage rates but on the difference between the rate a homeowner would pay on a new mortgage and the rate on the mortgage they already have. We measure it as the gap between the average thirty-year fixed mortgage rate in Freddie Mac's survey and the average rate on outstanding mortgages. Figure 2 shows both series and the gap.

From 2006 to 2021, the gap was small, between minus 1 and plus 0.5 points. For most of the period, the market rate was below the average outstanding rate, which encouraged refinancing and imposed no penalty on moving. In 2022, as the Federal Reserve raised rates, the market rate jumped from about 3 percent to more than 5 percent while the outstanding rate barely moved, and the gap reached 1.7 points. It was 3.0 points in 2023, 2.7 in 2024, 2.4 in 2025 and about 2.6 in 2026, as mortgage rates moved back toward 7 percent and above with the war-driven rise in long-term yields. The average outstanding rate has risen only slowly, from about 3.4 percent in 2021 to about 4.3 percent in 2026, because it changes only as old mortgages are repaid and new ones originated.
Table 1. Turnover, mortgage rates and the rate gap, selected years
| Year | Existing home sales (millions) | Turnover rate (%) | New 30-year mortgage rate (%) | Average outstanding rate (%) | Rate gap (points) |
|---|---|---|---|---|---|
| 2006 | 6.48 | 8.6 | 6.41 | 6.3 | 0.1 |
| 2008 | 4.11 | 5.5 | 6.03 | 6.1 | -0.1 |
| 2012 | 4.66 | 6.3 | 3.66 | 4.7 | -1.0 |
| 2019 | 5.34 | 6.8 | 3.94 | 4.0 | -0.1 |
| 2021 | 6.12 | 7.4 | 2.96 | 3.4 | -0.4 |
| 2023 | 4.09 | 4.8 | 6.81 | 3.8 | 3.0 |
| 2025 | 4.06 | 4.7 | 6.6 | 4.2 | 2.4 |
| 2026 | about 4.0 | 4.6 | about 6.9 | 4.3 | 2.6 |
Source: National Association of Realtors; Freddie Mac; Census Bureau; Global Strategy Files estimates of outstanding rates and owner-occupied stock.
2.3 Prices that would not fall
A market with few sales is usually a market with falling prices. The American housing market of 2023 to 2026 has been the exception. The median price of an existing home rose from about 274,000 dollars in 2019 to 347,000 in 2021, 386,000 in 2022, about 407,000 in 2024 and about 415,000 to 425,000 in 2025 and 2026; according to the National Association of Realtors, prices had risen on an annual basis for 39 consecutive months by September 2026. The explanation is that the lock-in reduced supply as much as demand: the owners who would normally sell are the same households who would normally buy their next home, and when they stay put, both sides of the market shrink.
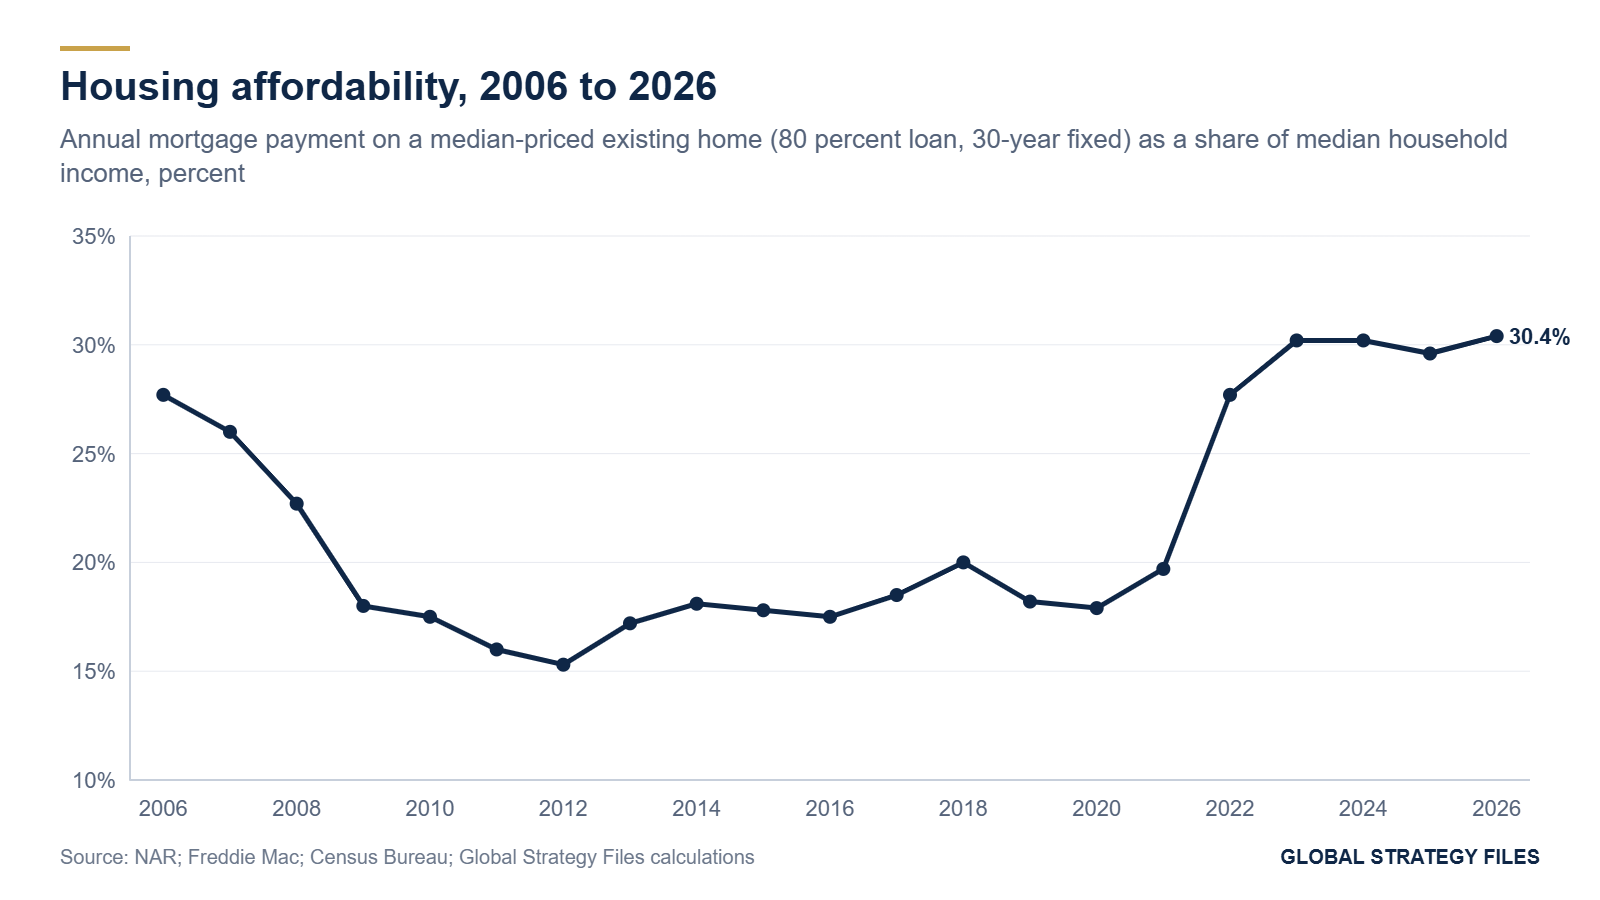
The combination of high prices and high rates has pushed affordability to its worst level in the sample. Figure 3 shows the annual principal and interest payment on a median-priced existing home financed with an 80 percent, thirty-year fixed mortgage, as a share of median household income. The ratio was about 28 percent in 2006, at the peak of the bubble, fell to about 15 to 18 percent between 2011 and 2021, and jumped to about 28 percent in 2022 and about 30 percent in 2023 to 2026. Buying a typical home now absorbs a larger share of a typical income than at the height of the 2006 boom.
This affordability shock falls mainly on first-time buyers, who have no low-rate mortgage to lose but must pay today's prices and rates. Their share of purchases has fallen to record lows in surveys of the National Association of Realtors, and the median age of first-time buyers has risen. The lock-in therefore divides the country into two groups: incumbent owners, protected by their low rates and enriched by rising prices, and aspiring owners, priced out by both.
3. Measuring the lock-in
3.1 The model
We estimate the relationship between the turnover rate and the rate gap over 2006 to 2026, controlling for the unemployment rate, which captures the effect of the business cycle on the willingness and ability of households to move. The results are reported in Table 2. In the simplest specification, with the rate gap alone, each point of gap reduces turnover by about 0.53 points (p value below 0.001), and the gap explains 41 percent of the variation. When unemployment is added, the effect of the gap rises to 0.94 points, both variables are highly significant, and the model explains 73 percent of the variation. Each point of unemployment reduces turnover by about 0.40 points.
Table 2. The determinants of housing turnover, 2006 to 2026
| Specification | Rate gap | Unemployment rate | R squared |
|---|---|---|---|
| Rate gap only | -0.53 (p below 0.001) | 0.41 | |
| Rate gap and unemployment | -0.94 (p below 0.001) | -0.40 (p below 0.001) | 0.73 |
| Rate gap and affordability | -0.94 (p 0.008) | 0.47 |
Source: Global Strategy Files estimates, Newey-West standard errors. Affordability is measured as the payment on a median-priced home with an 80 percent loan as a share of median household income; its coefficient is not significant.
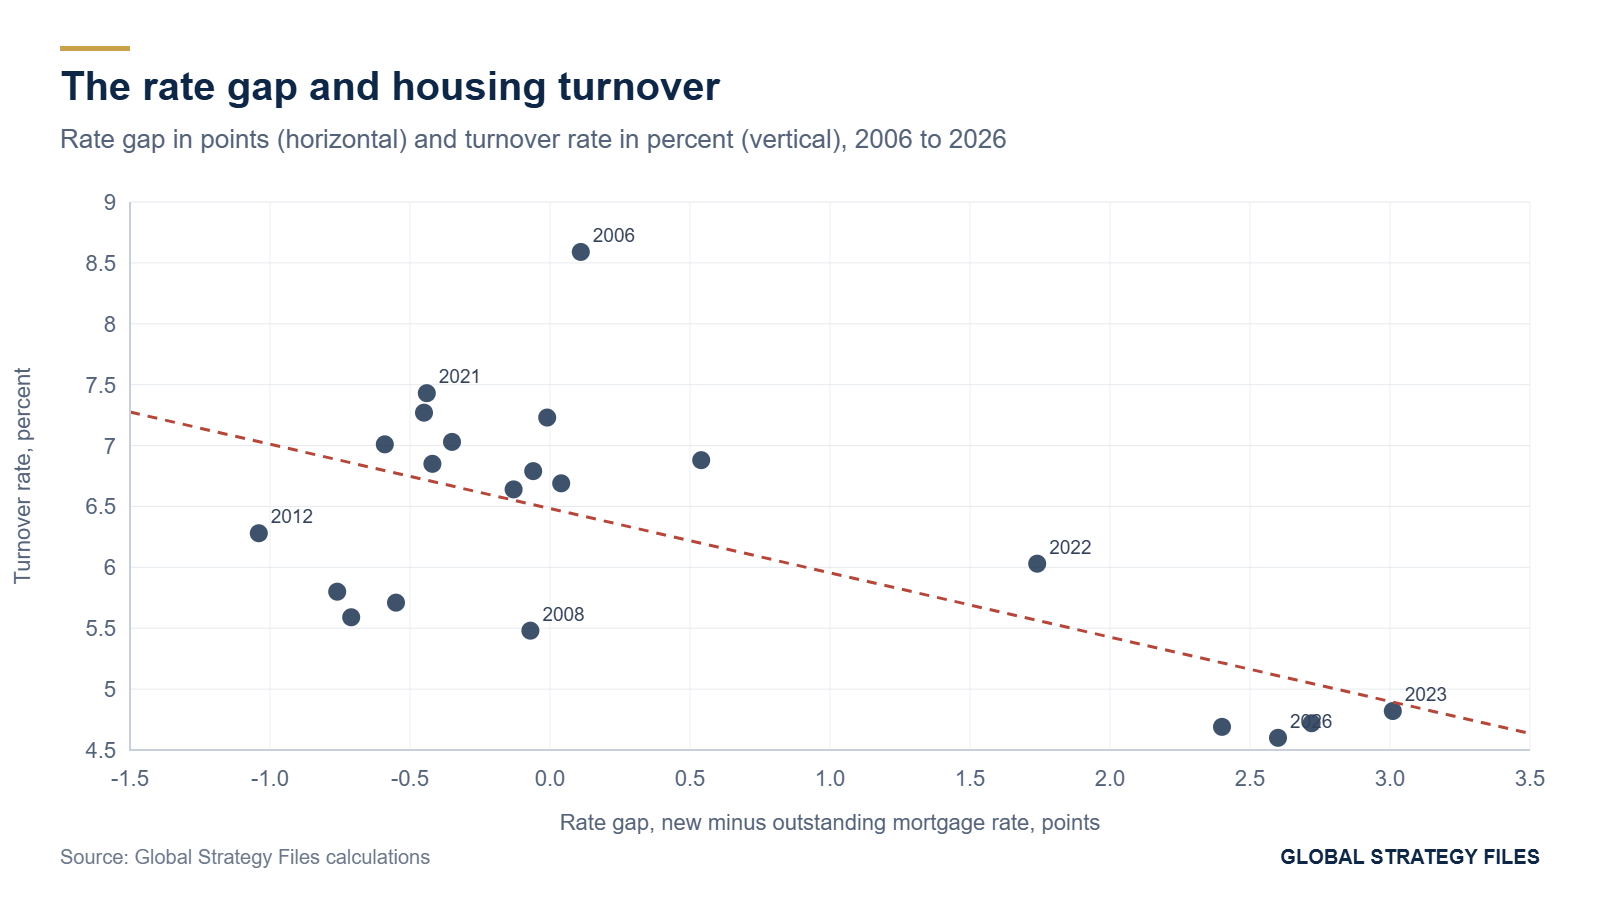
The affordability measure deserves comment. The monthly payment on a median-priced home, as a share of median household income, rose from about 18 percent in 2019 to about 30 percent in 2023 to 2026, the highest level in the sample. One might expect affordability to explain the freeze. In our data, once the rate gap is included, affordability adds little explanatory power: the two variables move together after 2022, and the gap captures the decline in turnover better. This suggests that the frozen market reflects primarily the reluctance of existing owners to sell, rather than only the inability of new buyers to buy. The two are connected: when owners do not sell, the supply of homes for sale is limited, which keeps prices high and affordability poor.
3.2 How many sales are missing?
The model allows us to estimate the number of sales lost to the lock-in. With a rate gap of about 2.6 points in 2026 and a coefficient of minus 0.94, the lock-in reduces the turnover rate by about 2.4 points. Applied to about 87 million owner-occupied homes, this represents about 2.1 million sales a year. Without the lock-in, and with unemployment at its 2026 level, existing home sales would be about 6.1 million rather than 4 million. Figure 5 compares actual sales with this counterfactual since 2006.
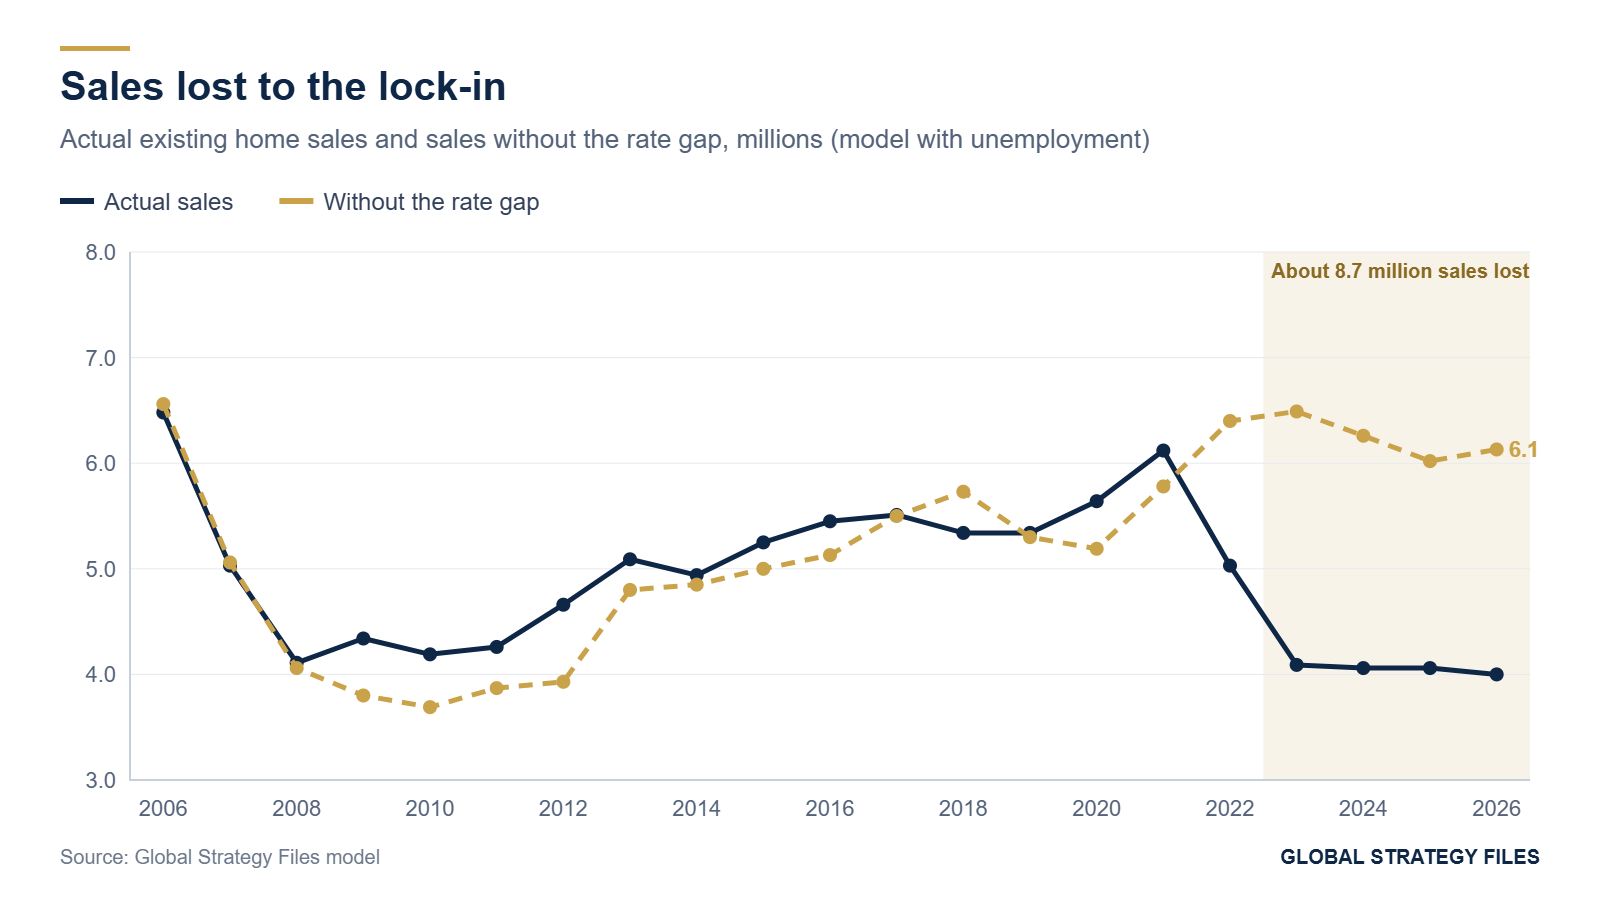
Over 2023 to 2026, the cumulative shortfall is about 8.7 million sales: more than 8 million households that, in a market without lock-in, would have moved and did not. Each of those non-moves represents a loss of economic activity (we estimate the transaction-related spending of a home sale at about 5 to 8 percent of the price, or roughly 20,000 to 35,000 dollars at current prices), and many represent a mismatch between households and homes: retirees in large family homes, young families in small apartments, workers who turn down jobs in other cities.
3.3 Who is locked in?
The lock-in is strongest for households with the lowest rates, which are disproportionately those who bought or refinanced in 2020 and 2021. According to data from the Federal Housing Finance Agency's National Mortgage Database, about half of outstanding mortgages carry a rate below 4 percent, and the large majority carry a rate below 6 percent. For these households, the cost of moving includes not only the higher rate on a new mortgage but also the loss of a valuable asset: a below-market loan whose value, at current rates, can exceed 50,000 dollars for a typical balance. Older households, who are more likely to own their homes outright, are less affected by the rate gap but more affected by the lack of suitable smaller homes to move to.
3.4 The economic cost of immobility
The missing sales have a direct economic cost. A home sale generates spending on brokerage commissions, mortgage origination, title insurance, moving services, furniture, appliances and renovation, which together amount to roughly 5 to 8 percent of the price. At a median price of about 420,000 dollars, each missing sale represents about 20,000 to 35,000 dollars of spending, and 2.1 million missing sales represent about 45 to 70 billion dollars a year, between 0.15 and 0.2 percent of GDP. Employment in real estate brokerage and mortgage lending has declined accordingly since 2022.
The indirect costs are harder to measure but probably larger. Research on the lock-in effect, notably by Fonseca and Liu, has found that homeowners with a larger gap between their mortgage rate and the market rate are significantly less likely to move, and less likely to move for better-paid jobs in other labor markets. In an economy in which, as we show in a companion study in this series, the labor force is shrinking and the breakeven pace of employment growth is close to zero, the reduced mobility of homeowners compounds the scarcity of workers in growing regions. The lock-in also slows the reallocation of homes across the life cycle: empty-nesters who would downsize stay in large homes, while young families crowd into rentals.
4. How long will the lock-in last?
The rate gap closes in two ways: market rates fall, or the average outstanding rate rises as old mortgages are replaced by new ones. The second process is slow. Since 2022, the average outstanding rate has risen by about 0.15 to 0.3 points a year, slowing as fewer homes change hands. At a pace of 0.15 points a year and a market rate of 6.9 percent, the gap would fall from 2.6 points to below one point only after about eleven years, in the second half of the 2030s.
Table 3. The rate gap and existing home sales under three paths, 2027 to 2030
| Year | Rates near 6.9 percent: gap | Sales (millions) | Rates fall to 6 percent: gap | Sales (millions) | Rates 7.5 percent, unemployment 5 percent: gap | Sales (millions) |
|---|---|---|---|---|---|---|
| 2027 | 2.45 | 4.27 | 2.15 | 4.52 | 2.85 | 3.70 |
| 2028 | 2.30 | 4.41 | 1.70 | 4.91 | 2.90 | 3.67 |
| 2029 | 2.15 | 4.56 | 1.35 | 5.22 | 2.75 | 3.81 |
| 2030 | 2.00 | 4.70 | 1.10 | 5.45 | 2.60 | 3.95 |
Source: Global Strategy Files projections using the model of Table 2 and an increase of 0.15 points a year in the average outstanding rate.

Under current rates, sales would recover only slowly, to about 4.7 million by 2030, still far below the 5.3 to 5.5 million of the late 2010s. Even if mortgage rates fell to 6 percent by 2030, a decline that would require both lower inflation and a lower term premium, sales would reach about 5.4 million. In the adverse scenario, with rates at 7.5 percent and unemployment at 5 percent, sales would fall below 4 million and stay there. The lock-in is a structural feature of the American economy for the rest of the decade.
5. The delinquency question
5.1 A slow rise
While sales froze, mortgage delinquency rose. The New York Fed reports that the share of mortgage balances moving into serious delinquency (90 days or more past due) was 1.28 percent in the third quarter of 2025 and 1.60 percent in the third quarter of 2026, up from about 0.4 to 0.6 percent in 2021 and 2022. The level remains low by historical standards, far below the peak of about 5.5 percent in 2009, but the trend has been upward for three years, and New York Fed researchers have noted that mortgage delinquencies continue to increase even as other categories stabilized.
5.2 What explains it
We estimate a simple model of the delinquency flow as a function of the unemployment rate and the annual change in house prices, over 2006 to 2026. Unemployment captures the main cause of mortgage default, the loss of income. House price growth captures the borrower's equity cushion: when prices rise, a borrower in difficulty can sell or refinance; when they fall, borrowers with little equity have fewer options. The model, shown in Figure 7, explains 86 percent of the variation in the delinquency flow. Each point of unemployment raises the flow by about 0.36 points, and each point of house price growth lowers it by about 0.15 points; both coefficients are highly significant.
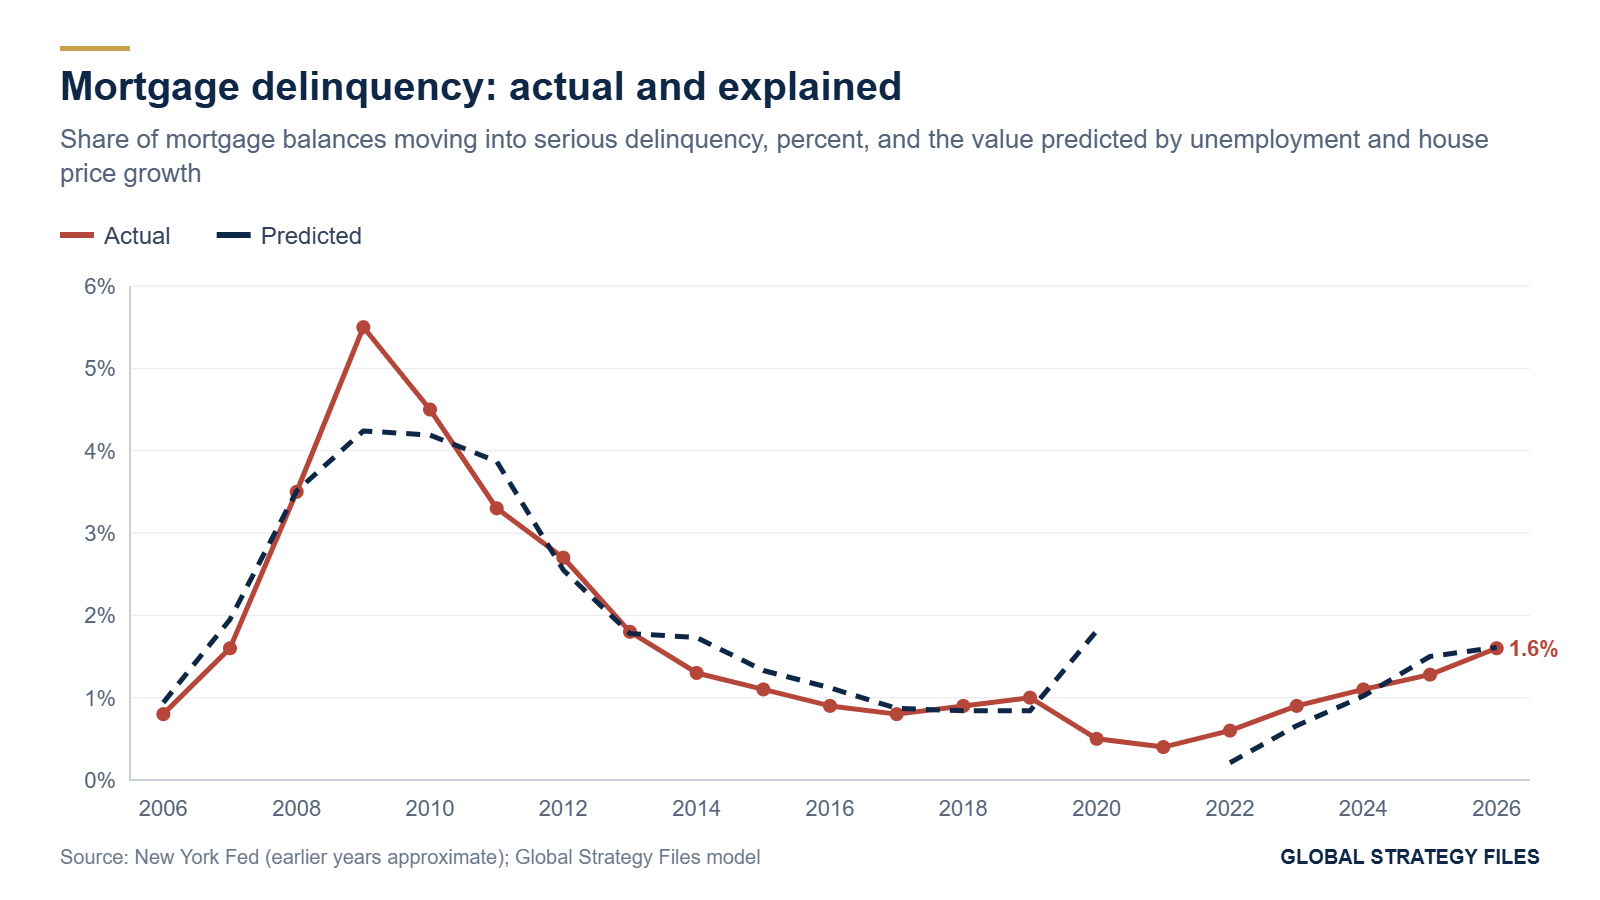
The model predicts a delinquency flow of 1.61 percent in 2026, against 1.60 percent observed. The rise since 2021 is therefore not a mystery requiring exotic explanations: it reflects the slowdown in home price growth, from 18 percent in 2021 to about 1 percent in 2026, and the rise in unemployment from 3.6 percent in 2022 and 2023 to about 4.2 percent. Home prices have risen year on year for 39 consecutive months, but the increases have become very small, and the equity cushion that protected borrowers since 2012 has stopped growing.
5.3 The vintages at risk
The aggregate model hides an important difference between vintages. Borrowers who bought in 2023 to 2025 did so at the highest prices and the highest rates of the past fifteen years, with debt-to-income ratios that were often near the limits of lending standards, and many used government-insured loans with low down payments. They have little equity: with prices growing about 1 to 2 percent a year since they bought, a borrower who put down 3.5 percent on an FHA loan has gained only a few points of equity, less than the cost of selling. If prices fall, these borrowers will be the first to find themselves under water. The lock-in also works against them in a different way: the frozen market makes it harder to sell quickly at a good price in case of difficulty.
6. Scenarios for delinquency
Using the delinquency model, we compute the flow into serious delinquency under four combinations of unemployment and house price growth for 2027. Table 4 and Figure 8 summarize the results.
Table 4. Mortgage delinquency flow under four scenarios for 2027
| Scenario | Unemployment rate (%) | House price change (%) | Flow into serious delinquency (% of balances) |
|---|---|---|---|
| Soft landing with price recovery | 4.0 | +3 | 1.25 |
| Continuation of 2026 | 4.2 | +1 | 1.61 |
| Mild correction | 4.5 | -3 | 2.31 |
| Recession | 5.5 | -6 | 3.11 |
Source: Global Strategy Files model (delinquency = 0.27 + 0.355 times unemployment minus 0.148 times house price growth).

A mild correction, in which national home prices fall by 3 percent while unemployment rises modestly, would raise the delinquency flow to about 2.3 percent, the highest since 2012. A recession with a 6 percent price decline would push it above 3 percent, about the level of 2011. These are not crisis levels comparable to 2009, because underwriting has been much tighter since the financial crisis, most borrowers have fixed rates and substantial equity built up during the price boom of 2020 to 2022, and the lock-in itself limits the supply of homes for sale, which supports prices. But they would represent a significant deterioration, concentrated on recent buyers and on government-insured loans.
The lock-in and the delinquency risk interact in a way that matters for policy. The lock-in supports prices by limiting supply, which protects borrowers' equity. If mortgage rates fell sharply, the lock-in would ease and supply would rise, which could slow price growth just as it improved affordability. If rates rose further, the lock-in would deepen and sales would fall, but prices would be supported by scarce supply, unless a recession forced sales. The worst combination for delinquency is the one in which a weakening labor market forces sales into a frozen market with few buyers.
7. Implications
For labor mobility. The lock-in reduces the willingness of homeowners to move for jobs. In an economy in which the labor force is shrinking and employers struggle to find workers, the inability of workers to move to where jobs are is a real cost. Policies that reduce the cost of moving, such as portable or assumable mortgages, deserve attention.
For mortgage design. The American thirty-year fixed-rate mortgage protects borrowers from rising rates but ties them to their homes when rates rise. Assumable mortgages, already available for government-insured loans, allow a buyer to take over the seller's low rate; making them more widely available, or allowing borrowers to port their mortgage to a new home, as in Canada and the United Kingdom, would reduce the lock-in. These changes would have costs for lenders and investors in mortgage-backed securities, who benefit from the slow prepayment of low-rate loans.
For monetary policy. The lock-in weakens the transmission of monetary policy through housing. When the Federal Reserve raises rates, existing borrowers are unaffected, and the main effect falls on the small number of new buyers and on the volume of transactions. When it cuts, the effect is also muted, because the gap closes only gradually. Housing activity will remain depressed for years even if rates fall modestly.
For housing supply. The best remedy for a frozen market is new construction, which adds supply without requiring existing owners to sell. Builders have partly filled the gap by offering mortgage rate buydowns to new buyers, and new homes have taken a larger share of total sales since 2022. Removing zoning and permitting obstacles to construction would be the most effective long-term response.
For risk monitoring. The rise in mortgage delinquency is a function of the cycle, not of a structural flaw in underwriting. Supervisors and investors should watch home price growth and unemployment, and should focus on the 2023 to 2025 vintages of government-insured loans, where equity is thinnest.
8. What is new in this study
To our knowledge, this study offers the first twenty-year estimate of the effect of the mortgage rate gap on housing turnover controlling for unemployment (minus 0.94 points of turnover per point of gap), an estimate of the sales lost to the lock-in in 2026 (about 2.1 million) and cumulatively since 2023 (about 8.7 million), a projection of the duration of the lock-in (more than ten years at current rates), and a simple model of mortgage delinquency that explains 86 percent of its variation since 2006 and attributes the rise since 2021 to the slowdown in house price growth and the rise in unemployment. The observation that sales are at a thirty-year low and that delinquency is rising confirms the reports of the National Association of Realtors and the New York Fed.
Methodological annex
Data. Existing home sales from the National Association of Realtors (annual; 2026 estimated from the September annual rate). Owner-occupied housing units from the Census Bureau (approximate annual values). Thirty-year fixed mortgage rates from Freddie Mac (annual averages; 2026 estimated at about 6.9 percent). Average outstanding mortgage rates are Global Strategy Files estimates consistent with national accounts and FHFA data. Flows into serious delinquency from the New York Fed Quarterly Report on Household Debt and Credit (third-quarter values for 2025 and 2026; earlier years approximate annual values). Unemployment from the Bureau of Labor Statistics. House price growth from the FHFA index (approximate annual changes).
Turnover model. Turnover = 8.91 minus 0.942 times rate gap minus 0.40 times unemployment, estimated by ordinary least squares with Newey-West standard errors on 2006 to 2026. Lost sales = 0.942 times rate gap times owner-occupied stock.
Projections. The average outstanding rate rises by 0.15 points a year from 4.3 percent in 2026; owner-occupied stock grows by about 0.4 million a year.
Delinquency model. Flow = 0.27 + 0.355 times unemployment minus 0.148 times house price growth; R squared 0.86; Newey-West standard errors.
Limitations. Annual data limit the precision of the estimates. The average outstanding rate is estimated. The turnover model does not include affordability with a significant coefficient, which may reflect collinearity after 2022 rather than a true absence of effect. The delinquency model is aggregate and does not distinguish loan types or vintages.
References
National Association of Realtors (2026). Existing-Home Sales, September 2026. Washington, DC, 13 October 2026.
Freddie Mac (2026). Primary Mortgage Market Survey. McLean, VA.
Federal Reserve Bank of New York (2026). Quarterly Report on Household Debt and Credit, 2026 Q3. New York, November 2026.
Federal Housing Finance Agency (2026). National Mortgage Database aggregate statistics. Washington, DC.
Reuters (2026). US existing home sales rise in September; higher mortgage rates dim outlook. 13 October 2026.
Associated Press (2026). US home sales rose in September, but slowed from a year earlier. 13 October 2026.
HousingWire (2026). Existing home sales beat estimates but do not reflect recent higher rates. October 2026.
RISMedia (2026). Econ Review: October 2026. 5 November 2026.
Fonseca, J. and L. Liu (2024). Mortgage lock-in, mobility, and labor reallocation. Journal of Finance.
Driss EFFINA, PhD
Independent Researcher, Global Strategy Files
The opening pages of our four country reports: United States, United Kingdom, Japan and China. A free PDF, sent to your inbox.
You will also receive occasional analysis from Global Strategy Files. Unsubscribe in one click, at any time.