The Subsidy Withdrawal Experiment: What the End of the EV Tax Credit Reveals About Demand, Cost and Industrial Policy

Abstract
On 30 September 2025, the federal tax credit of up to 7,500 dollars for new electric vehicles, and of up to 4,000 dollars for used ones, ended, years earlier than scheduled, under the 2025 budget law. Economists rarely get a cleaner experiment: a large, well-known subsidy disappeared on a single date announced months in advance, in a market observed quarter by quarter. This study uses the episode, placed in twenty years of data on electrified vehicle sales, to answer three questions that have divided the debate on electric vehicle policy: how sensitive is demand to price, how much of the subsidy bought additional vehicles rather than rewarding buyers who would have purchased anyway, and who depended on it. We find that the announcement produced a large pull-forward of demand: sales in the third quarter of 2025 exceeded the pre-announcement baseline by about 130,000 vehicles and the share of electric vehicles reached a record 10.5 percent, followed by shortfalls of about 70,000 and 88,000 vehicles in the next two quarters. Once the pull-forward was absorbed, the market settled at about 16 percent below its pre-announcement level in volume and about 1.65 points below in share, at 5.8 percent of new vehicle sales, before recovering to 6.5 percent in the third quarter of 2026 as gasoline rose above 4 dollars a gallon. The implied price elasticity of the electric share is between about minus 1.9 and minus 3.6, depending on the assumed effect of fuel prices, a high value that classifies the electric vehicle as a discretionary rather than an essential purchase at current prices. Each additional electric vehicle attributable to the credit cost the Treasury roughly 26,000 to 41,000 dollars, implying a cost of about 590 to 910 dollars per tonne of carbon dioxide avoided over the vehicle's life. The withdrawal also revealed whom the subsidy supported: the electric sales of legacy automakers collapsed by 60 to 90 percent while Tesla's fell by about 20 percent and Toyota's rose fivefold. The credit functioned less as a consumer subsidy than as an industrial policy that allowed traditional manufacturers to enter a market in which they were not yet competitive.
Key findings
- The share of battery electric vehicles in new vehicle sales rose from about 0.1 percent in 2011 to 8.1 percent in 2024, then peaked at 10.5 percent in the third quarter of 2025 before falling to 5.8 percent in the three quarters after the credit ended.
- The pull-forward was large and short: about 130,000 additional sales in the third quarter of 2025, offset by shortfalls of about 158,000 in the fourth quarter of 2025 and first quarter of 2026.
- After the pull-forward, the electric market settled about 16 percent below its pre-announcement volume and about 22 percent below its share, a decline of 1.65 percentage points.
- The implied price elasticity of the electric share is about minus 1.9 to minus 2.2 without correcting for the rise in gasoline prices, and up to minus 3.6 if higher fuel prices added one point to the share in 2026.
- About 84 percent of the vehicles that benefited from the credit would have been purchased without it. The cost per additional electric vehicle was roughly 26,000 to 41,000 dollars.
- Legacy automakers lost 60 to 90 percent of their electric sales year on year in the third quarter of 2026, while Tesla lost about 20 percent and Toyota and Lexus multiplied theirs by about five. Hybrids, not electric vehicles, captured the demand for fuel efficiency: nearly 25 percent of new vehicles sold were electrified in some form.
1. Introduction: a subsidy switched off
Subsidies for electric vehicles have been the centerpiece of American policy to decarbonize transport since 2009, when a tax credit of up to 7,500 dollars was introduced for plug-in vehicles. The credit was phased out for each manufacturer after it sold 200,000 qualifying vehicles, which ended it for Tesla and General Motors in 2019 and 2020, then redesigned in 2022 by the Inflation Reduction Act, which restored it for all manufacturers under conditions on battery sourcing, final assembly and price caps, made it transferable to dealers at the point of sale from 2024, and created a separate credit for leased vehicles that was not subject to the sourcing rules. The 2025 budget law ended all of these credits for vehicles acquired after 30 September 2025.
The debate about these subsidies has always turned on a counterfactual: how many people would have bought an electric vehicle without the credit? Supporters argued that the credit was essential to overcome the price gap between electric and gasoline vehicles while battery costs fell. Critics argued that most of the money went to affluent buyers who would have bought anyway, and that the cost per tonne of carbon avoided was far higher than that of other climate policies. Because the credit had been in place, in one form or another, for the entire life of the modern electric vehicle market, the counterfactual could only be estimated indirectly.
The withdrawal changed that. For the first time, the United States has a full year of data on the electric vehicle market without a federal purchase subsidy, preceded by a well-defined period in which buyers knew the subsidy was about to end. This study uses that natural experiment. Section 2 reviews twenty years of electrified vehicle sales. Section 3 describes the quarterly path around the withdrawal. Section 4 separates the pull-forward from the permanent effect. Section 5 estimates the price elasticity of demand. Section 6 measures the fiscal cost per additional vehicle and per tonne of carbon. Section 7 examines which manufacturers depended on the subsidy. Section 8 presents scenarios to 2030 and Section 9 draws implications.
2. Twenty years of electrification
2.1 Two technologies, two trajectories
The American market for fuel-efficient vehicles has followed two distinct paths over the past two decades. Conventional hybrids, which combine a gasoline engine with a small battery recharged by braking and cannot be plugged in, arrived first. Their share of new vehicle sales rose from about 1.5 percent in 2006, when the Toyota Prius was the emblem of the category, to about 3 percent in 2012 and 2013, then stagnated at about 2 percent from 2015 to 2019, when gasoline was cheap. Since 2020 hybrids have surged, to about 10 percent of sales in 2024, about 13 percent in 2025 and about 16 percent in 2026, as Toyota, Honda, Ford and Hyundai expanded their offerings and fuel prices rose.
Battery electric vehicles followed a later and steeper curve. Their share was negligible until 2017, rose to about 1.4 percent in 2018 and 2019 as the Tesla Model 3 reached volume production, and then accelerated: 3.1 percent in 2021, 5.8 percent in 2022, 7.6 percent in 2023 and 8.1 percent in 2024. In 2025, sales of about 1.28 million electric vehicles represented 7.8 percent of the market, the second best year on record, thanks to a record third quarter. In 2026, the share has averaged about 6 percent. Figure 1 shows both series.

2.2 The role of fuel prices
The two trajectories respond differently to fuel prices. Hybrid sales track gasoline prices closely: their share rose in 2008 and 2011 to 2013, when gasoline exceeded 3.25 dollars a gallon, and stagnated when prices fell below 2.50 dollars in 2015 to 2019. Electric vehicle sales grew through periods of both cheap and expensive fuel, driven by product availability, falling battery costs and subsidies. In 2026, with regular gasoline averaging 4.43 dollars a gallon in September against 3.20 dollars a year earlier, both technologies benefit, but hybrids, which carry no price premium comparable to that of electric vehicles and require no change in refueling habits, have captured most of the additional demand for efficiency. In September 2026, electrified models represented 58.2 percent of Toyota's American sales.
Table 1. Electrified vehicles in the American market, selected years
| Year | Battery electric share of new sales (%) | Hybrid share of new sales, approximate (%) | Average regular gasoline price (dollars) | Federal purchase credit |
|---|---|---|---|---|
| 2006 | 0.0 | 1.5 | 2.59 | Hybrid credit |
| 2012 | 0.1 | 3.0 | 3.64 | Up to 7,500, manufacturer cap |
| 2019 | 1.4 | 2.3 | 2.60 | Tesla and GM capped out |
| 2022 | 5.8 | 5.6 | 3.95 | Redesigned by IRA in August |
| 2024 | 8.1 | 10.0 | 3.31 | Up to 7,500, point of sale, lease credit |
| 2025 | 7.8 | 13.0 | 3.10 | Ended 30 September |
| 2026 (to Q3) | about 6.0 | about 16 | about 3.9 | None |
Source: Cox Automotive and Kelley Blue Book; Energy Information Administration; Global Strategy Files estimates for hybrid shares.
3. The quarterly path around the withdrawal
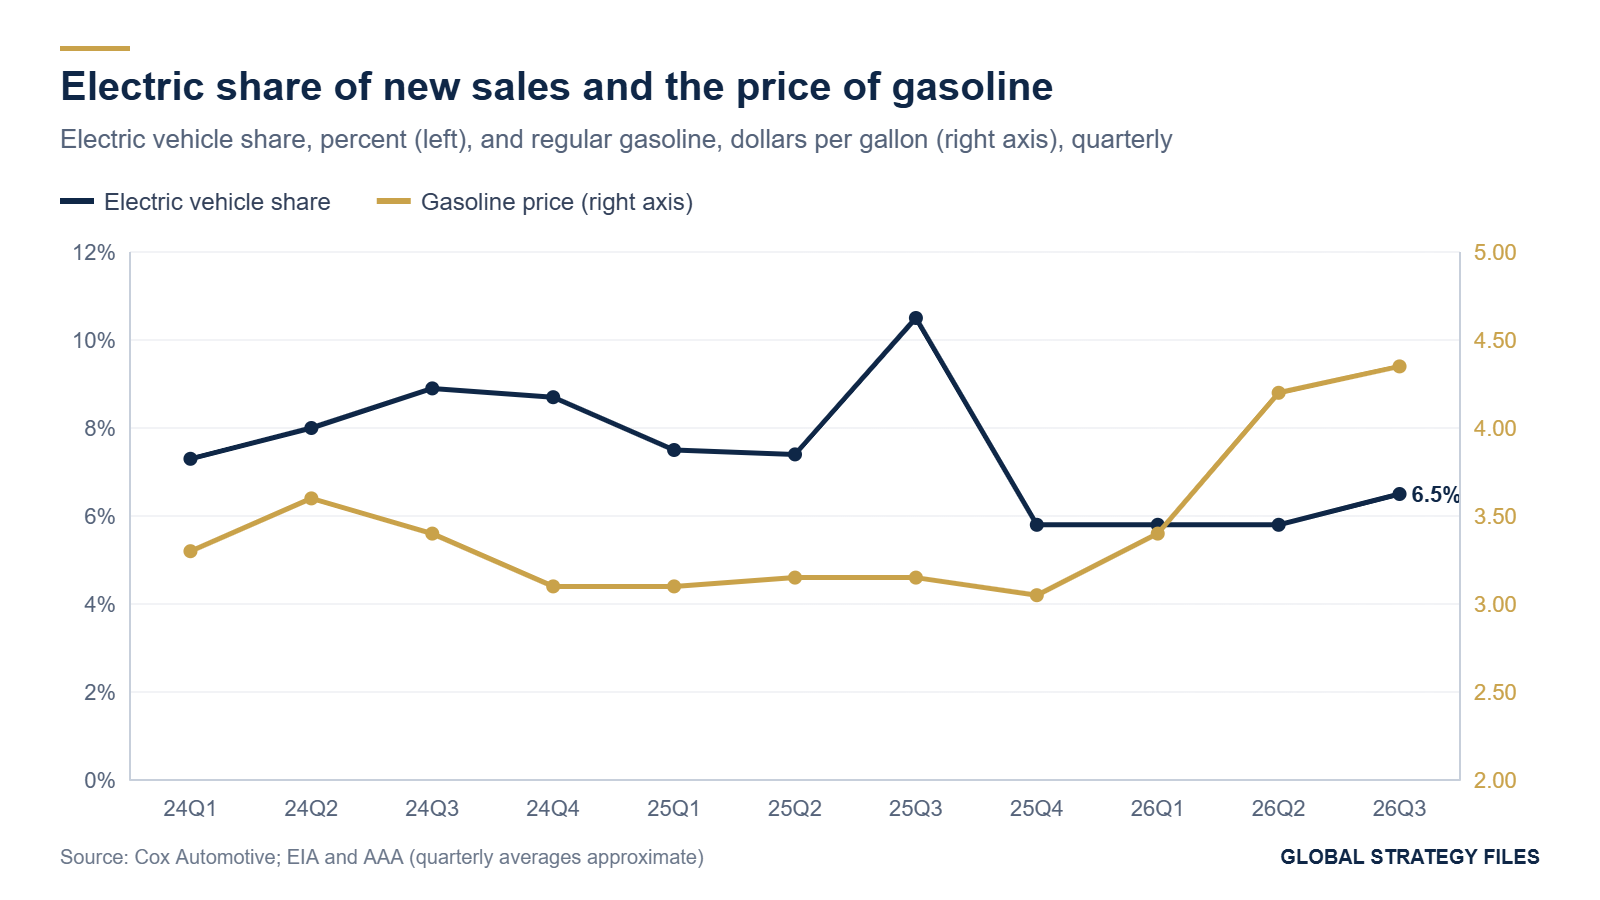
Figure 2 shows quarterly sales of battery electric vehicles from the first quarter of 2024 to the third quarter of 2026, and Figure 3 their share of new vehicle sales. The story unfolds in four phases.
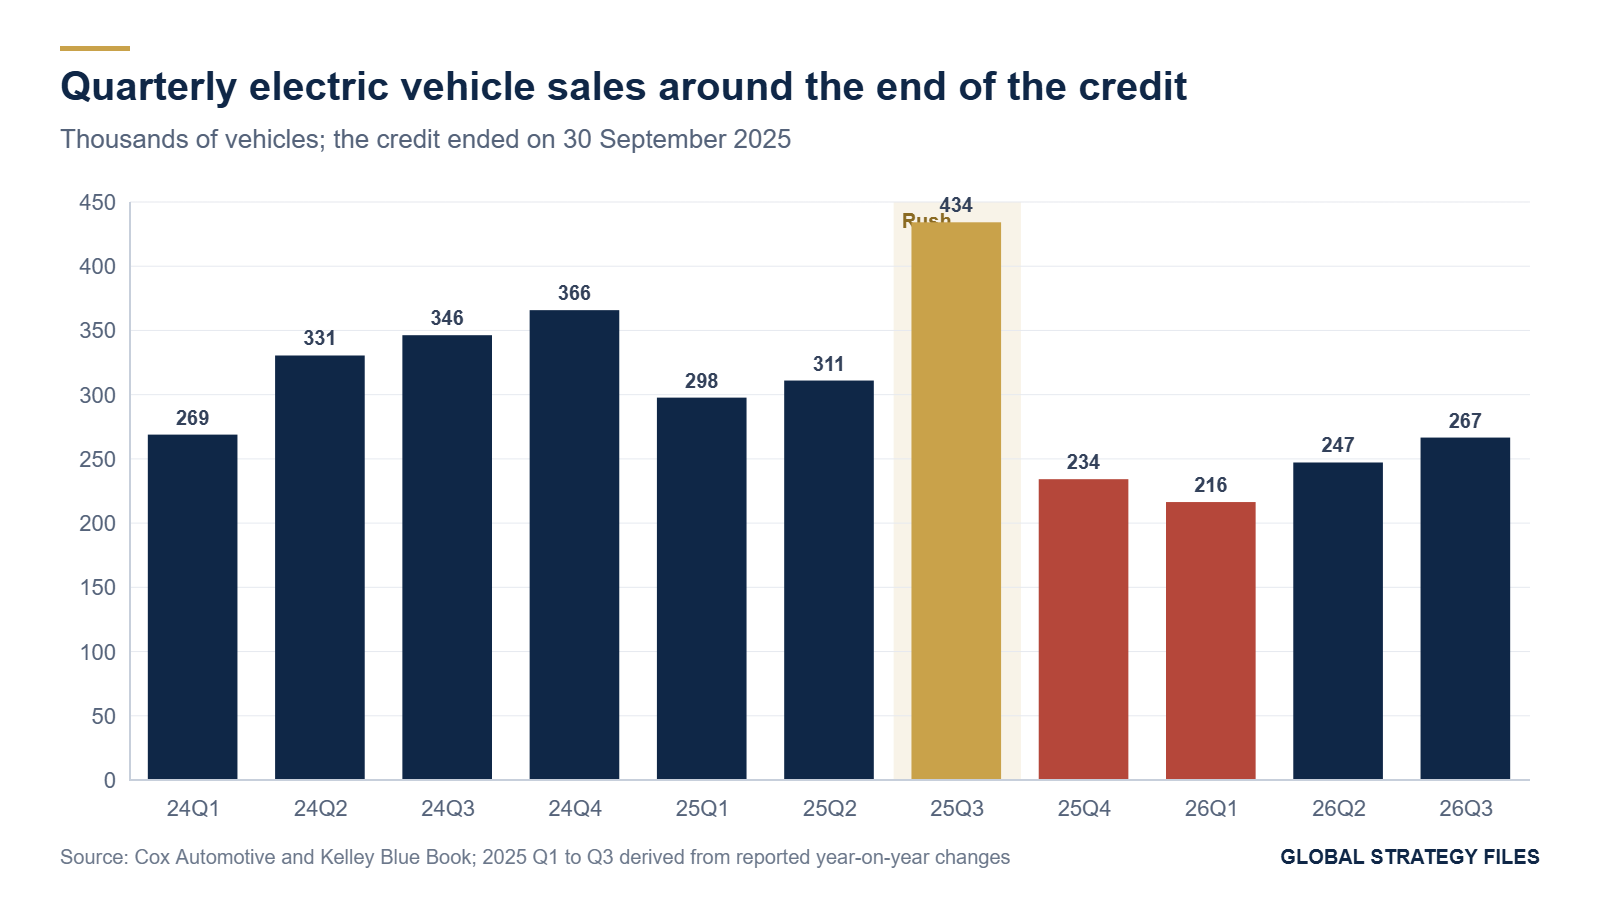
Before the announcement. In 2024, electric vehicle sales grew steadily, from about 269,000 in the first quarter to a then record of about 366,000 in the fourth, with a share between 7.3 and 8.9 percent. In the first half of 2025, sales averaged about 304,000 a quarter and the share about 7.45 percent, slightly below the 2024 pace, as the market absorbed price cuts and new competition.
The rush. After the budget law fixed the end of the credit at 30 September, buyers hurried to qualify. Sales jumped to about 434,000 in the third quarter of 2025, the best quarter in history, and the share reached 10.5 percent. According to J.D. Power, electric vehicles represented more than 14 percent of retail sales in September 2025.
The cliff. In the fourth quarter of 2025, sales fell to about 234,000, 46 percent less than in the third quarter and 36 percent less than a year earlier, the lowest quarter since late 2022. December registrations fell 48 percent. The share dropped to 5.8 percent, roughly where it had been in the first half of 2022. Sales continued to fall in the first quarter of 2026, to about 216,000.
The new floor. From the second quarter of 2026, sales recovered: to about 247,000 in the second quarter and about 267,000 in the third, the best quarter since the rush. The share rose from 5.8 to 6.5 percent. Used electric vehicles, whose 4,000 dollar credit also ended, reached their largest ever share of the used market, with about 47,000 sold in September 2026, as depreciation made them attractive without a subsidy.
4. Pull-forward versus permanent effect
4.1 Measuring the pull-forward
A temporary rush before the end of a subsidy is not evidence that the subsidy increased total demand; it may simply shift purchases in time. To separate the two effects, we compare quarterly sales with a baseline equal to the average of the first two quarters of 2025, about 304,000 vehicles, the last period before the end of the credit was enacted.
Table 2. Electric vehicle sales relative to the pre-announcement baseline, thousands of vehicles
| Quarter | Sales | Difference from baseline (304,400) | Interpretation |
|---|---|---|---|
| 2025 Q3 | 434.2 | +129.8 | Pull-forward before expiry |
| 2025 Q4 | 234.2 | -70.2 | Payback of pull-forward |
| 2026 Q1 | 216.4 | -88.0 | Payback and permanent effect |
| 2026 Q2 | 247.2 | -57.2 | Permanent effect |
| 2026 Q3 | 266.6 | -37.8 | Permanent effect, offset by fuel prices |
Source: Cox Automotive and Kelley Blue Book; Global Strategy Files calculations. 2025 quarterly volumes for Q1 to Q3 are derived from the reported year-on-year changes of 2026.
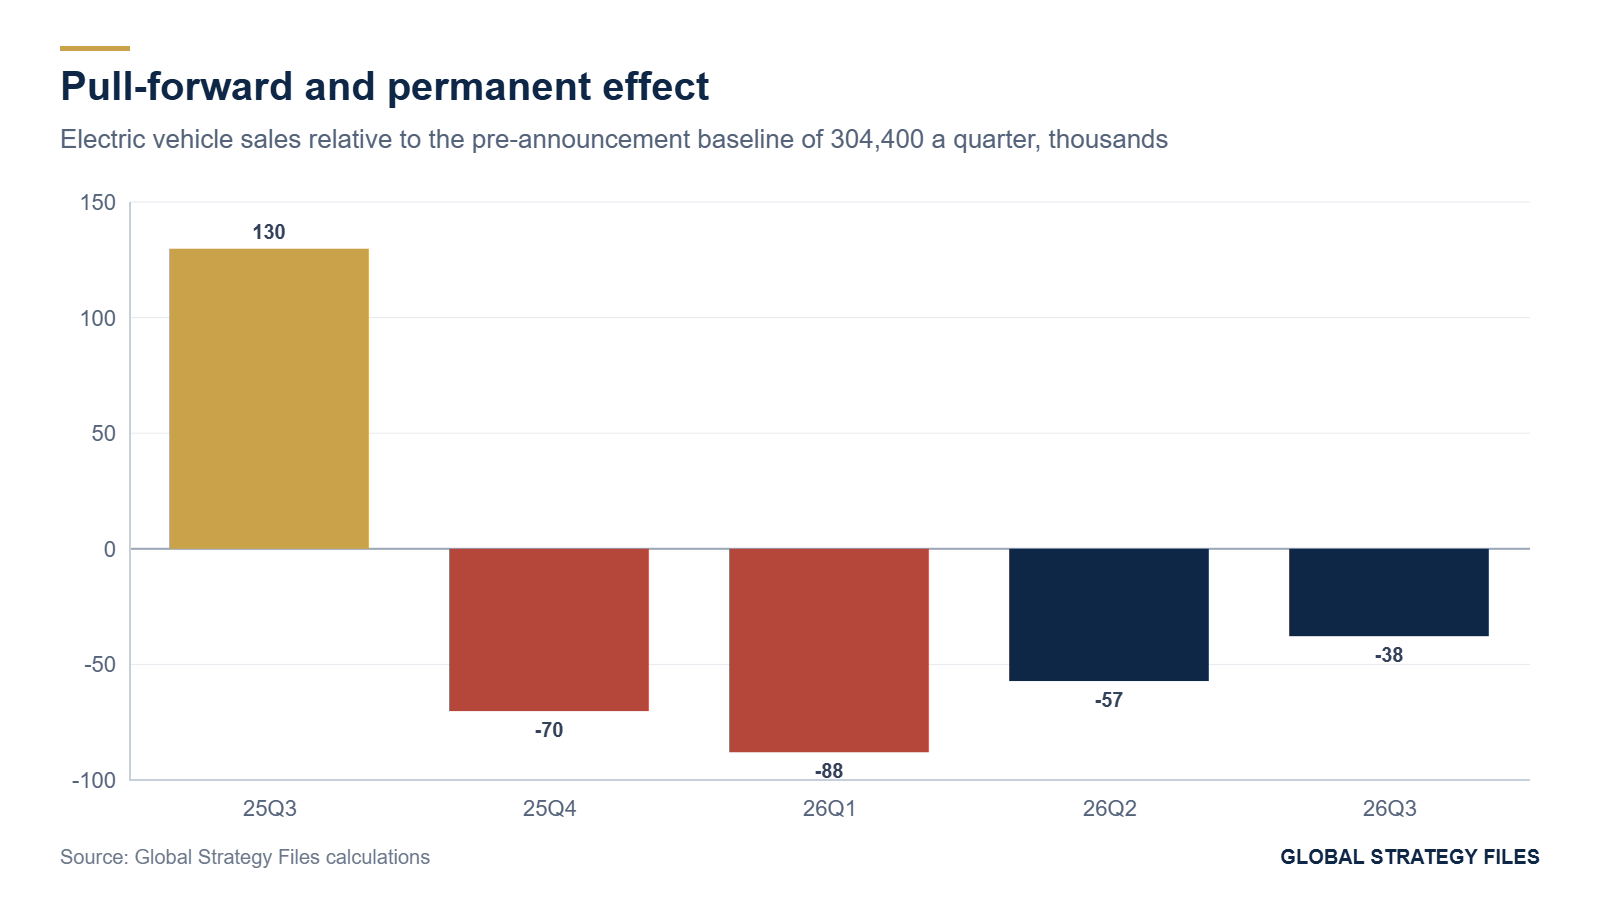
The excess of about 130,000 vehicles in the third quarter of 2025 was more than offset by shortfalls of about 158,000 in the following two quarters. The pull-forward therefore lasted roughly one quarter, and the market had absorbed it by the end of the first quarter of 2026. What remains in the second and third quarters of 2026 is the permanent effect of a market without the credit.
4.2 The permanent effect
In the second and third quarters of 2026, sales averaged about 257,000 a quarter, about 16 percent below the baseline. In share terms, the market fell from about 7.45 percent in the first half of 2025 to 5.8 percent in the first half of 2026, a decline of 1.65 points or 22 percent. Total vehicle sales were roughly stable over the period (about 4.1 million in the third quarter of 2026, down about 1 percent from a year earlier), so the change in share reflects a substitution away from electric vehicles rather than a general decline in car purchases.
These numbers understate the effect of the credit, because other factors moved in favor of electric vehicles in 2026. The most important was fuel: the war with Iran pushed gasoline from about 3.15 dollars a gallon in 2025 to more than 4.20 dollars in the second and third quarters of 2026, which improved the operating cost advantage of electric vehicles by roughly 40 percent. New models from Toyota, Lexus, Rivian and Subaru also expanded the choice of vehicles. Without these favorable factors, the decline would have been larger.
5. How sensitive is demand to price?
5.1 The size of the price shock
The credit was worth up to 7,500 dollars, but not every electric vehicle qualified. Under the rules of 2024 and 2025, purchased vehicles had to meet price caps and sourcing requirements, while leased vehicles could receive the full commercial credit regardless of sourcing, which made leasing the dominant channel for many brands. We estimate that the average effective subsidy across all electric vehicles sold, including those that did not qualify, was about 5,000 to 6,000 dollars, or 10 to 12 percent of an average gross price of about 50,000 dollars.
The end of the credit was not offset by price cuts. On the contrary, the average transaction price of electric vehicles rose 18.1 percent year on year to 51,981 dollars in January 2026, according to Cox Automotive. Part of the increase is mechanical, because point-of-sale credits had lowered recorded transaction prices, and part reflects a shift in mix toward more expensive models as cheaper, credit-dependent models disappeared from sales. Either way, the evidence shows no sign that manufacturers absorbed the loss of the subsidy through lower prices: buyers bore essentially all of it.
5.2 The implied elasticity
Combining the decline in share with the size of the price shock gives an arc elasticity of the electric vehicle share with respect to its relative price. Table 3 shows the results under alternative assumptions.
Table 3. Implied price elasticity of the electric vehicle share
| Assumed contribution of higher gasoline prices to the 2026 share | Underlying effect of the credit (points) | Relative change in share | Elasticity, price shock of 10 percent | Elasticity, price shock of 12 percent |
|---|---|---|---|---|
| None | -1.65 | -22 percent | -2.2 | -1.9 |
| +0.5 point | -2.15 | -29 percent | -2.9 | -2.4 |
| +1.0 point | -2.65 | -36 percent | -3.6 | -3.0 |
Source: Global Strategy Files calculations.

The elasticity lies between about minus 1.9 and minus 3.6. Even the lower bound is high. It means that a 10 percent increase in the relative price of electric vehicles reduces their market share by about 20 percent or more. Demand for electric vehicles at current prices is discretionary: most buyers consider them as one option among several, and a modest change in price tips a large share of them toward a hybrid or a gasoline vehicle. This is consistent with the rise of hybrids, which offer much of the fuel saving without the price premium.
5.3 What the fuel price tells us
The recovery of the electric share from 5.8 to 6.5 percent in the third quarter of 2026, when gasoline averaged more than 4.30 dollars, gives a rough indication of the sensitivity to fuel prices. If the 0.7 point gain is attributed entirely to fuel, an increase in gasoline prices of about 35 to 40 percent relative to 2025 raised the electric share by about 12 percent, an elasticity with respect to the gasoline price of about 0.3. Electric vehicle demand responds to fuel prices, but far less than to purchase prices. For buyers, the price on the window sticker matters more than the price at the pump.
6. The cost of an additional electric vehicle
6.1 Inframarginal buyers
A subsidy is efficient if it changes behavior. Every dollar paid to a buyer who would have purchased an electric vehicle anyway is a transfer, not an incentive. The natural experiment allows us to estimate the share of such inframarginal buyers. Annualized, the pre-announcement baseline corresponds to about 1.22 million electric vehicles a year; the post-credit level of the second and third quarters of 2026 corresponds to about 1.03 million. The difference, about 190,000 vehicles a year, is the number of additional electric vehicles that the credit generated in steady state, before correcting for fuel prices. The remaining 1.03 million, about 84 percent of baseline sales, would have been bought without the credit.
6.2 The fiscal cost
The credit's cost depends on the share of electric vehicles that qualified, through purchase or leasing. We consider shares of 55, 70 and 85 percent of baseline sales, which give annual fiscal costs of about 5.0, 6.4 and 7.8 billion dollars. Dividing by 190,000 additional vehicles gives a cost per additional electric vehicle of about 26,000, 34,000 and 41,000 dollars.
Table 4. The fiscal cost of the electric vehicle credit per additional vehicle and per tonne of carbon dioxide
| Share of electric vehicles receiving the credit | Annual fiscal cost (billion dollars) | Cost per additional vehicle (dollars) | Cost per tonne of carbon dioxide avoided (dollars) |
|---|---|---|---|
| 55 percent | 5.0 | 26,500 | about 590 |
| 70 percent | 6.4 | 33,700 | about 750 |
| 85 percent | 7.8 | 40,900 | about 910 |
Source: Global Strategy Files calculations; lifetime emissions avoided of 45 tonnes of carbon dioxide per vehicle replacing a gasoline vehicle, an order of magnitude consistent with life-cycle studies for the American electricity mix.

6.3 Per tonne of carbon
An electric vehicle that replaces a gasoline vehicle avoids, over a life of about 15 years and 200,000 kilometers, in the order of 40 to 50 tonnes of carbon dioxide with the current American electricity mix, after accounting for the higher emissions of battery production. With 45 tonnes, the cost of the credit was about 590 to 910 dollars per tonne avoided, several times the estimates of the social cost of carbon used by federal agencies in recent years and far above the cost of abatement through power sector policies. If higher fuel prices are taken into account, the number of additional vehicles attributable to the credit rises and the cost per tonne falls, but it remains in the range of several hundred dollars.
These numbers do not prove that the credit was useless. Its supporters argued that its purpose was to accelerate learning, scale and infrastructure in a nascent industry, effects that a static cost per tonne does not capture. But they do show that, by 2025, the credit was mainly a transfer to buyers who would have chosen an electric vehicle anyway, at a high cost per unit of additional adoption.
7. Who depended on the subsidy?
7.1 Winners and losers among manufacturers
The most revealing result of the experiment concerns not consumers but manufacturers. Table 5 shows the change in electric vehicle sales by brand between the third quarter of 2025 and the third quarter of 2026. The comparison is flattered by the rush of 2025, which affected all brands, but the differences between brands are striking.
Table 5. Change in electric vehicle sales by brand, third quarter of 2026 versus third quarter of 2025
| Brand | Change in electric vehicle sales |
|---|---|
| Volkswagen | -90.5 percent |
| Ford | -80.2 percent |
| Chevrolet | -74.6 percent |
| General Motors (all brands) | about -62 percent |
| Tesla | -19.7 percent |
| Subaru | +31 percent |
| Rivian | +46 percent |
| Toyota | +328 percent |
| Lexus | +442 percent |
| Whole market | -38.6 percent |
Source: Cox Automotive and Kelley Blue Book estimates; press reports.

The legacy American and European manufacturers lost most of their electric volume. Tesla, whose vehicles had been designed from the start to be produced profitably and which had lived without the federal credit in 2019 to 2022, lost about a fifth of its sales and saw its share of the electric market rise to 54 percent in the third quarter of 2026 and close to 59 percent in the fourth quarter of 2025. Toyota and Lexus, which entered the electric market late with new models, grew from a small base. Rivian and Subaru, with new products, also grew.
7.2 An industrial policy in disguise
The pattern suggests that the credit functioned less as a consumer subsidy than as an industrial policy that allowed traditional manufacturers to sell electric vehicles that were not yet competitive at their cost of production. Legacy manufacturers relied heavily on leasing, which allowed them to capture the commercial credit without meeting the sourcing rules, and on price points just below the caps. When the credit ended, their electric models lost their price advantage overnight, and buyers turned to the manufacturers' own hybrids or gasoline models. In the third quarter of 2026, Cox Automotive estimated that the share of the Detroit Three in total vehicle sales would fall to about 36 percent, while Asian brands, led by the hybrids of Toyota and Honda, accounted for more than half of the market. General Motors, which sells only one hybrid, saw its total sales fall 5.5 percent in the quarter.
The withdrawal therefore had a consequence that its authors may not have intended: it weakened the electric vehicle programs of American manufacturers relative to those of Tesla and the Japanese manufacturers, and it rewarded the companies that had invested in hybrids. In terms of industrial policy, the subsidy had been buying time for the legacy industry to reach cost parity. Its end shortened that time.
8. Scenarios for 2030
The future of the electric vehicle market without subsidies depends on three variables: the relative price of electric vehicles, which depends on battery costs and competition; the price of gasoline; and the availability of models. Using our elasticities, we sketch three scenarios for the electric share in 2030.
In the stagnation scenario, gasoline returns to about 3.50 dollars a gallon, battery costs fall slowly and the relative price of electric vehicles declines by 5 percent: with an elasticity of minus 2.5, and allowing for the weaker incentive of cheaper fuel, the share rises from about 6 percent to 6.5 to 7 percent. In the parity scenario, competition and cheaper batteries reduce the relative price by 15 percent, enough to close most of the gap for mainstream models, and gasoline stays near 4 dollars: the share reaches about 8 to 10 percent, close to the levels of 2024 and 2025 without any subsidy. In the shock scenario, gasoline stays above 4.50 dollars and new affordable models arrive: the share could reach 9 to 11 percent. In every scenario, hybrids continue to grow faster than electric vehicles, because they capture most of the demand for efficiency at a smaller premium.
Table 6. Electric vehicle share in 2030 under three scenarios
| Scenario | Relative price of electric vehicles | Gasoline (dollars per gallon) | Electric share of new sales, 2030 |
|---|---|---|---|
| Stagnation | -5 percent | 3.50 | 6.5 to 7 percent |
| Parity | -15 percent | 4.00 | 8 to 10 percent |
| Shock and affordable models | -20 percent | above 4.50 | 9 to 11 percent |
Source: Global Strategy Files projections based on the elasticities of Section 5.

9. Implications
For climate policy. The experiment shows that purchase subsidies are an expensive way to reduce emissions once a market has reached several percent of sales: most of the money goes to buyers who would purchase anyway. Policies that act on the relative cost of driving, such as fuel taxes or emission standards, or that lower the cost of batteries and charging, are likely to deliver more abatement per dollar.
For industrial policy. If the goal of the credit was to build a domestic electric vehicle industry, its withdrawal has revealed how far the legacy manufacturers were from competitiveness. Supporting that industry in the future would require instruments aimed at production costs, such as support for battery manufacturing, rather than demand subsidies that are captured by whichever manufacturer has the most competitive product.
For manufacturers. The market has rewarded flexibility. Companies that offered hybrids, plug-in hybrids and electric vehicles side by side, such as Toyota and Honda, gained share; companies that bet on a rapid transition to battery electric vehicles and neglected hybrids lost it. In a market where the electric share is highly price sensitive, a broad powertrain portfolio is a hedge.
For consumers and the used market. The record share of used electric vehicles in 2026 shows that the market can find a price at which electric vehicles are attractive without subsidies: the depreciated price of a three-year-old electric vehicle. The second-hand market may become the main channel through which electric vehicles reach middle-income households.
For the debate on energy security. The war of 2026 demonstrated the value of reducing oil dependence in transport. But the experiment also shows that, at current prices, most American households choose hybrids rather than electric vehicles when they want to reduce their fuel bills. A strategy of energy security in transport should be technology-neutral and focus on efficiency rather than on a single powertrain.
10. What is new in this study
This study offers, to our knowledge, the first quantitative analysis of the withdrawal of the federal electric vehicle credit as a natural experiment after a full year of data. It separates the pull-forward (about 130,000 vehicles, absorbed within two quarters) from the permanent effect (about 16 percent of volume and 1.65 points of share), estimates the price elasticity of the electric share (minus 1.9 to minus 3.6), measures the share of inframarginal buyers (about 84 percent) and the cost per additional vehicle (26,000 to 41,000 dollars) and per tonne of carbon (about 590 to 910 dollars), and documents the asymmetric effect of the withdrawal on legacy manufacturers and on Tesla and Toyota. The observations that sales collapsed in the fourth quarter of 2025 and recovered in 2026 confirm the reports of Cox Automotive and other sources.
Methodological annex
Data. Quarterly electric vehicle sales and shares from Cox Automotive and Kelley Blue Book. The 2025 quarterly volumes for the first three quarters are derived from the year-on-year changes reported for 2026 (minus 27.3, minus 20.5 and minus 38.6 percent). Annual shares from Kelley Blue Book; hybrid shares are approximate Global Strategy Files estimates from industry data. Gasoline prices from the Energy Information Administration and AAA.
Baseline and effects. Baseline = average of 2025 Q1 and Q2 sales (304,400) and shares (7.45 percent). Pull-forward = excess over baseline in 2025 Q3. Permanent effect = average of 2026 Q2 and Q3 relative to baseline (sales) and average of 2026 Q1 and Q2 relative to baseline (share).
Elasticity. Arc elasticity = relative change in share divided by relative change in price, with the effective subsidy at 10 or 12 percent of price, and with adjustments of 0, 0.5 and 1.0 points for the contribution of higher gasoline prices to the 2026 share.
Cost per additional vehicle. Annual fiscal cost = baseline annual sales times the share receiving the credit times 7,500 dollars; additional vehicles = baseline minus post-credit annualized sales (190,000). Carbon: 45 tonnes avoided per additional vehicle over its life.
Limitations. The baseline may itself have been affected by anticipation of the policy change. Other policies changed at the same time, including the relaxation of fuel economy standards and the suspension of state rules, which may have reduced manufacturers' incentives to push electric vehicles. The elasticities are arc estimates from a single episode. The carbon calculation uses an order-of-magnitude estimate of lifetime emissions avoided.
References
Cox Automotive and Kelley Blue Book (2026). Q4 2025, Q1 2026, Q2 2026 and Q3 2026 EV Sales Reports. Atlanta.
Electrive (2026). EV sales in the US plummet, as expected. 14 January 2026.
InsideEVs (2026). After a year without tax credits, EVs are down but not out. October 2026.
InsideEVs (2025). U.S. EV sales are on track for their first year-over-year drop since 2019. December 2025.
CBT News (2026). U.S. EV sales rise 7.7 percent in Q3 as market rebounds; GM keeps U.S. sales crown in Q3. October 2026.
J.D. Power (2025, 2026). Monthly retail sales and EV share estimates.
Experian and Cox Automotive (2025). EV financing and dealer sentiment, fourth quarter 2025.
Energy Information Administration (2026). Gasoline and diesel fuel update. Washington, DC.
Internal Revenue Service (2024). Clean vehicle credits under sections 30D and 45W. Washington, DC.
Driss EFFINA, PhD
Independent Researcher, Global Strategy Files
The opening pages of our four country reports: United States, United Kingdom, Japan and China. A free PDF, sent to your inbox.
You will also receive occasional analysis from Global Strategy Files. Unsubscribe in one click, at any time.