
Russia: Replacing the Irreplaceable? Sanctions, Import Substitution and Productivity

Replacing the Irreplaceable? Sanctions, Import Substitution and Russian Productivity
Driss EFFINA, PhD
Independent Researcher, Global Strategy Files
Reading time: 27 minutes
Key takeaways
- Russia imported 306 billion dollars of goods in 2025, about as much as the 301 billion dollars it imported in 2021 before the sanctions were extended.
- The share of sanctioning economies in Russia's technology imports fell from 61.9 percent in 2021 to 16.0 percent in 2023, while China's share passed 80 percent.
- Exports of machinery and electrical equipment to Russia through Kazakhstan, Kyrgyzstan and Armenia rose 11.4 times between 2021 and 2023.
- Russia grew 1.43 percent a year from 2014 to 2025, less than half the world average, and the IMF projects 0.97 percent for 2026 to 2031.
Abstract
Four years after the extension of Western sanctions in 2022, Russia imports roughly as many goods in dollar terms as before the war: 306 billion dollars in 2025, compared with 301 billion in 2021, according to the balance of payments of the Bank of Russia. This apparent resilience hides a complete reorganisation of the country’s technological supply. Using partner-reported trade statistics from UN Comtrade for eleven major suppliers, IMF growth data for Russia and comparator economies, and World Bank data on research and development, this paper measures how far import substitution has replaced Western technology and what it implies for productivity and medium-term growth. Five results stand out. First, the share of sanctioning economies (the European Union, the United States, Japan and South Korea) in Russia’s imports of machinery, electronics, vehicles and instruments fell from 61.9 percent in 2021 to 16.0 percent in 2023 and about 11 to 13 percent in 2024 and 2025, while China’s share rose from 34.2 percent to more than 80 percent. Second, in value terms, non-sanctioning suppliers replaced about 87 percent of the lost Western supply by 2023. Third, a transit channel through Kazakhstan, Kyrgyzstan and Armenia multiplied exports of machinery and electrical equipment to Russia by 11.4 between 2021 and 2023. Fourth, measured by the research and development intensity of supplier countries, the technological level of the supplier pool fell only slightly, from 2.60 to 2.42 percent of GDP, which suggests that the productivity cost of sanctions lies less in the average technology of imports than in specific frontier goods, services, maintenance and higher transaction costs. Fifth, Russia’s average growth from 2014 to 2025 was 1.43 percent per year, less than half the world average of 3.22 percent, and the IMF projects only 0.97 percent per year for 2026 to 2031. Relative to world output, the Russian economy has lost 19 percent of its weight since 2013 and is projected to lose another 10 points by 2031. Import substitution has preserved supply but not productivity growth.
Keywords: Russia, sanctions, import substitution, productivity, technology transfer, mirror trade statistics, China, transit trade, potential growth.
1. Introduction
When the European Union, the United States, the United Kingdom, Japan, South Korea and other countries imposed sweeping export controls on Russia in 2022, many observers expected a rapid collapse of Russian industry. Russian producers depended heavily on Western machinery, components, software and maintenance. The prohibition of exports of dual-use goods, advanced semiconductors, machine tools and aircraft parts was designed to degrade Russia’s industrial and military capacity over time.
The collapse did not happen. Russian imports, after a fall in 2022, returned to their pre-war dollar value by 2023. China became the dominant supplier of almost everything from cars to machine tools. Intermediaries in Central Asia, the Caucasus, Turkey and the United Arab Emirates developed into transit hubs. The Russian government promoted import substitution as a strategic priority, and the Bank of Russia’s Monetary Policy Guidelines for 2026 to 2028 take as a baseline assumption that “the imposed foreign sanctions will remain in the medium term”, with the economy oriented towards the domestic market and a trade share of GDP smaller than before 2022.
The question this paper addresses is not whether Russia has adapted, which is evident, but at what cost. The topic as formulated in the Bank of Russia’s own documents is the effect of sanctions and import substitution on productivity: what are the costs of access to technology, how have companies adapted, and what are the limits of replacing imported equipment for medium-term growth? The public debate on this question is often polarised. One side claims that sanctions have failed because supply has been restored; the other claims that the Russian economy is technologically hollowed out. This paper measures rather than asserts, using data that any reader can access and reproduce.
The paper proceeds as follows. Section 2 presents the context. Section 3 reviews the literature on trade, technology and productivity. Section 4 describes the data and methods. Section 5 reports the results. Section 6 discusses their implications for productivity and growth, Section 7 outlines scenarios, and Section 8 concludes.
2. Context: from Western dependence to Asian substitution
Before 2022, Russia’s industrial base depended on imported capital goods in a way that was well documented. Machine tools, industrial robots, semiconductors, telecommunications equipment, aircraft and their components, and many specialised instruments were sourced mainly from Germany, Italy, Japan, the United States and South Korea. Russian car production depended on foreign brands assembling vehicles locally with imported components.
The sanctions introduced in 2014 after the annexation of Crimea were limited in scope but already restricted access to finance and to some technologies, particularly in the oil sector and the defence industry. The 2022 measures went much further. They prohibited the export to Russia of a long list of goods, including items on the “common high priority list” of components found in Russian military equipment. Western companies left the Russian market, often selling their assets at a discount. Maintenance contracts, software licences and technical support were interrupted.
The Russian response combined four strategies. The first was reorientation: sourcing from China and other non-sanctioning countries. The second was parallel imports: legalising the import of branded goods without the consent of the trademark owner, often through third countries. The third was transit through intermediaries in countries with customs unions or close trade links with Russia, such as Kazakhstan, Kyrgyzstan and Armenia in the Eurasian Economic Union. The fourth was domestic substitution, supported by subsidies, state orders and protectionist measures such as higher recycling fees on imported vehicles.
By 2026 this reorganisation had largely stabilised. The question is whether it has preserved the conditions for productivity growth, which the Bank of Russia considers the main source of future growth because demographics limit the expansion of the labour force.
3. Literature review
Three strands of the literature are relevant.
The first concerns the link between imports and technology diffusion. Coe and Helpman (1995) showed that a country’s total factor productivity depends not only on its own research and development but also on that of its trading partners, with imports serving as a channel for international knowledge spillovers. Eaton and Kortum (2001) emphasised that trade in capital goods is the main channel through which countries access foreign technology, and that barriers to this trade raise the relative price of investment and reduce productivity. Keller (2004) reviewed the evidence on international technology diffusion and concluded that trade and foreign direct investment are major vehicles of diffusion, with distance and barriers reducing it.
The second strand concerns the effects of sanctions on target economies. Hufbauer, Schott, Elliott and Oegg (2007) provided a comprehensive history of economic sanctions, showing that their economic impact depends on the share of the target’s trade affected and on the availability of alternative suppliers. Felbermayr, Kirilakha, Syropoulos, Yalcin and Yotov (2020) built the Global Sanctions Database and documented the large trade effects of sanctions. Studies of Russia after 2014 found that sanctions and the oil price fall jointly reduced growth, with the sanctions effect concentrated in finance and investment.
The third strand concerns trade diversion and transit. When direct trade is blocked, goods are often rerouted through third countries. Research on Russian trade after 2022 has documented sharp increases in exports to Russia from Armenia, Kazakhstan, Kyrgyzstan, Turkey and the United Arab Emirates, as well as increases in those countries’ imports from the European Union, consistent with re-export.
This paper contributes by combining these perspectives with updated data up to 2025, a quantitative measure of replacement, a transit indicator and a measure of the technological intensity of Russia’s supplier pool.
4. Data and methodology
4.1 Data
- Mirror trade statistics: UN Comtrade, exports to Russia reported by eleven partners: China, the European Union (as a single reporter), Germany (for reference), the United States, Japan, South Korea, Turkey, Kazakhstan, Kyrgyzstan, Armenia, India and the United Arab Emirates, for 2019 and 2021 to 2025. Mirror data are used because Russia stopped publishing detailed trade statistics after 2022. I focus on four chapters of the Harmonized System that represent technology and capital goods: chapter 84 (machinery and mechanical appliances), 85 (electrical machinery and electronic equipment), 87 (vehicles) and 90 (optical, measuring and medical instruments). I refer to their sum as “technology goods”.
- Total imports: Bank of Russia, balance of payments, imports of goods in US dollars, 2013 to 2025.
- Growth and population: IMF World Economic Outlook database (via the IMF DataMapper), real GDP growth and population for Russia and comparators, actual values to 2025 and projections to 2031.
- Research and development: World Bank World Development Indicators, gross domestic expenditure on research and development as a percentage of GDP, latest available year (2020 to 2024 depending on the country).
- Official analysis: Bank of Russia, Monetary Policy Guidelines for 2026 to 2028.
Data were collected on 18 October 2026. Some reporters had not yet published 2025 data (Turkey and the United States), and the United Arab Emirates had not published data for 2024 and 2025. These gaps are indicated where relevant; 2023 is the latest year with complete data for all partners.
4.2 Methods
Supplier shares. I group partners into sanctioning economies (the EU, the United States, Japan and South Korea) and non-sanctioning economies (China, Turkey, Kazakhstan, Kyrgyzstan, Armenia, India and the UAE), and compute their shares in Russia’s imports of technology goods from these eleven partners.
Replacement ratio. I compute the ratio of the increase in technology goods supplied by non-sanctioning economies to the decrease in those supplied by sanctioning economies between 2021 and 2023. A ratio of 1 means full replacement in value.
Transit indicator. I compute the combined exports of chapters 84 and 85 from Kazakhstan, Kyrgyzstan and Armenia to Russia. These countries do not have large domestic industries in these sectors, so a sudden increase is a strong signal of re-export.
Technological intensity of the supplier pool. I compute the average research and development intensity of supplier countries, weighted by their share in Russia’s technology goods imports. This follows the logic of Coe and Helpman (1995), in which the knowledge embodied in imports depends on the research intensity of the source countries.
Comparative growth. I compute average annual growth and cumulative growth of real GDP and real GDP per capita for Russia and comparators over 2014 to 2025, and an index of Russian real GDP relative to world GDP.
Limitations. Mirror statistics are valued at the exporter’s border and may differ from Russian import values. Values are in current dollars and do not account for price changes. Country-level research intensity is a crude proxy for the technology embodied in specific goods. Growth differences between countries have many causes besides sanctions. Results are therefore interpreted as indicators, not as causal estimates.
5. Results
5.1 Total imports: a deceptive recovery
According to the Bank of Russia’s balance of payments, Russia’s imports of goods were 301.0 billion dollars in 2021, fell to 276.5 billion in 2022, and recovered to 303.1 billion in 2023, 301.5 billion in 2024 and 306.4 billion in 2025. In nominal dollar terms, the shock of 2022 was absorbed within one year.
Table 1. Russia’s imports of goods (balance of payments, billion US dollars)
| 2013 | 2014 | 2015 | 2016 | 2019 | 2021 | 2022 | 2023 | 2024 | 2025 |
|---|---|---|---|---|---|---|---|---|---|
| 341.3 | 307.9 | 193.0 | 191.5 | 253.9 | 301.0 | 276.5 | 303.1 | 301.5 | 306.4 |
Source: Bank of Russia.
Two qualifications are necessary. First, the dollar value of imports in 2025 is still 10 percent below its 2013 level, before the first sanctions and the ruble crisis. Second, nominal values do not account for prices. If import prices rose because of longer supply chains, intermediary margins and payment costs, the volume of imports in 2025 is lower than its value suggests. The previous article in this series estimated that investment goods prices in Russia rose about 13 percent in the first half of 2026, more than 7 points faster than consumer prices, which is consistent with such a price effect.
5.2 The great reorientation of technology supply
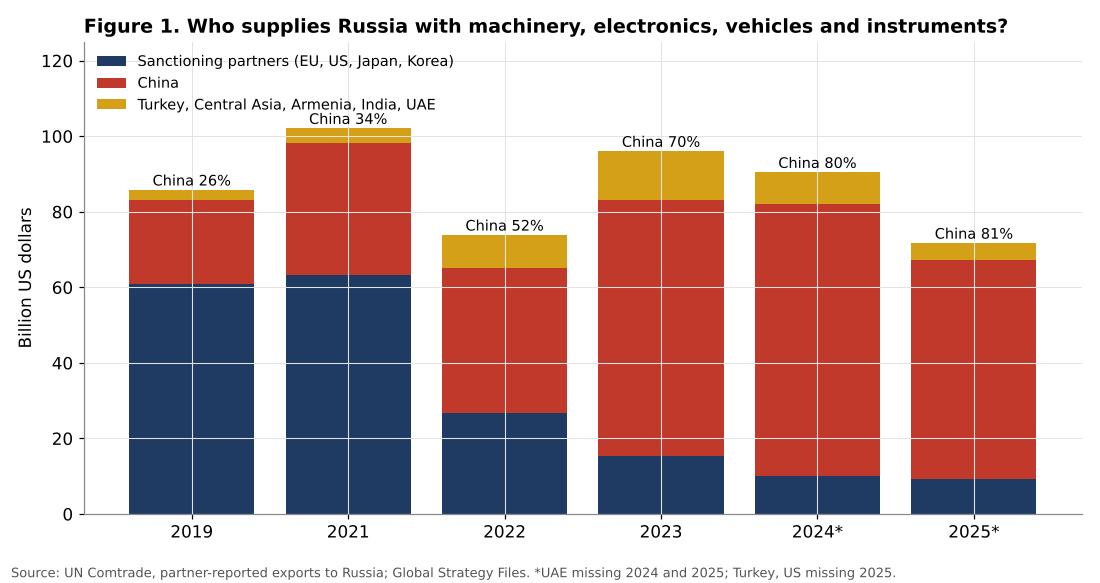
Figure 1 shows Russia’s imports of technology goods from the eleven partners by source. The transformation is dramatic.
Table 2. Russia’s imports of technology goods (HS 84, 85, 87, 90) by source, billion US dollars
| Year | Sanctioning partners | China | Other non-sanctioning | Total | Sanctioning share | China share |
|---|---|---|---|---|---|---|
| 2019 | 60.9 | 22.1 | 2.8 | 85.8 | 71.0% | 25.8% |
| 2021 | 63.2 | 34.9 | 4.0 | 102.1 | 61.9% | 34.2% |
| 2022 | 26.8 | 38.4 | 8.6 | 73.8 | 36.3% | 52.1% |
| 2023 | 15.3 | 67.7 | 13.0 | 96.0 | 16.0% | 70.5% |
| 2024* | 10.1 | 71.9 | 8.4 | 90.4 | 11.2% | 79.5% |
| 2025* | 9.3 | 58.0 | 4.5 | 71.7 | 12.9% | 80.9% |
Source: UN Comtrade (partner-reported exports); calculations by the author. Sanctioning partners: EU, United States, Japan, South Korea. Other non-sanctioning: Turkey, Kazakhstan, Kyrgyzstan, Armenia, India, UAE. \*UAE data missing for 2024 and 2025; Turkey and United States missing for 2025.
Between 2021 and 2023, the year with complete data, technology goods supplied by sanctioning economies fell by 47.9 billion dollars, from 63.2 to 15.3 billion. Over the same period, those supplied by non-sanctioning economies rose by 41.8 billion dollars, from 38.9 to 80.7 billion. The replacement ratio in value is therefore 0.87: about 87 percent of the lost Western supply was replaced by other suppliers within two years. Total technology imports from these partners in 2023 (96.0 billion dollars) were only 6 percent below their 2021 level.
China’s share rose from 34.2 percent in 2021 to 70.5 percent in 2023 and to around 80 percent in 2024 and 2025. Such a rapid shift towards a single supplier for capital and technology goods is highly unusual for an economy of Russia’s size.
The European Union’s exports of technology goods to Russia fell from 47.2 billion dollars in 2021 to 5.7 billion in 2025, a decline of 88 percent. Germany alone, traditionally the main supplier of machinery to Russia, saw its exports of chapters 84 and 85 fall from 10.4 billion dollars in 2021 to less than 1 billion in 2025.
5.3 What China supplies
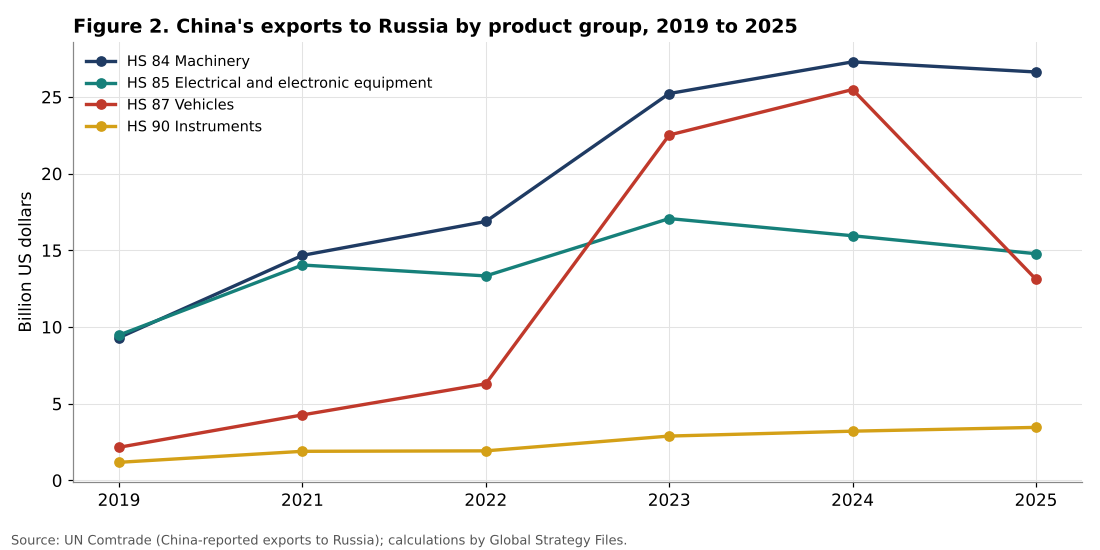
The composition of Chinese exports to Russia reveals the nature of the substitution. Between 2021 and 2024, China’s exports of machinery (chapter 84) to Russia rose from 14.7 to 27.3 billion dollars, and remained at 26.6 billion in 2025. Exports of instruments (chapter 90) rose from 1.9 to 3.5 billion dollars. Exports of vehicles (chapter 87) increased six-fold, from 4.3 billion dollars in 2021 to 25.5 billion in 2024, as Chinese brands replaced Western and Korean cars, before falling by half to 13.1 billion in 2025, after Russia raised recycling fees on imported vehicles and encouraged local assembly.
Exports of electrical and electronic equipment (chapter 85) behaved differently. They rose from 14.0 billion dollars in 2021 to 17.1 billion in 2023 but then fell to 16.0 billion in 2024 and 14.8 billion in 2025, below their 2021 level. This is the category that includes semiconductors, telecommunications equipment and electronic components, the items most targeted by Western export controls and secondary sanctions. The decline after 2023 is consistent with reports that Chinese banks and exporters became more cautious about transactions with Russia because of the risk of secondary sanctions from the United States.
This pattern shows the limits of substitution. China can replace Western suppliers in mass-produced machinery and vehicles. It is less able or less willing to replace them in the most sensitive electronic components, where Chinese firms themselves depend on Western technology or face secondary sanctions.
5.4 The transit channel
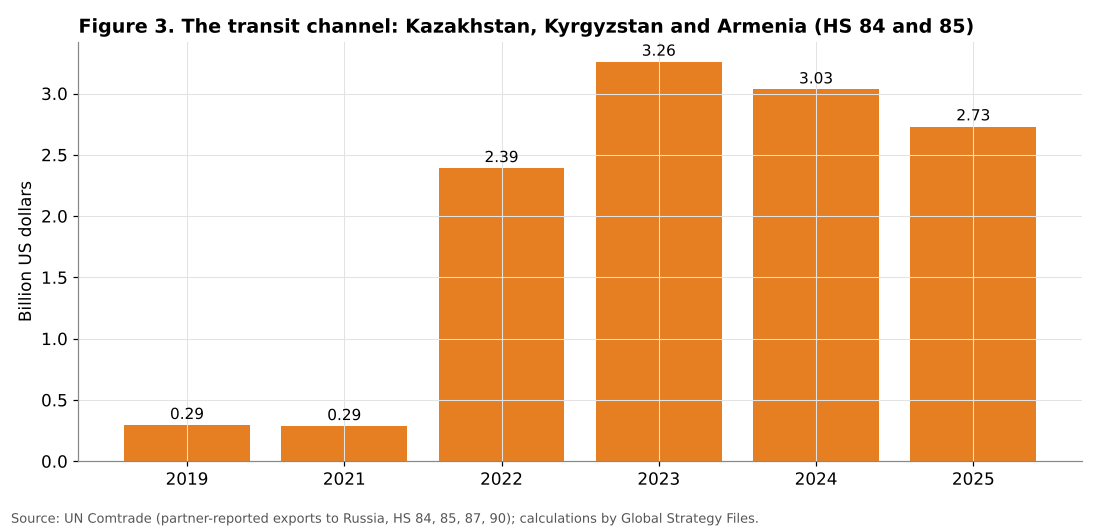
The exports of machinery and electrical equipment (chapters 84 and 85) to Russia from Kazakhstan, Kyrgyzstan and Armenia combined were 0.29 billion dollars in 2021. They rose to 2.39 billion in 2022 and 3.26 billion in 2023, an increase by a factor of 11.4, before declining to 3.03 billion in 2024 and 2.73 billion in 2025.
Armenia’s case is particularly striking. Its exports of electrical equipment (chapter 85) to Russia rose from 12 million dollars in 2021 to 926 million in 2023 and 994 million in 2025, an eighty-fold increase. Armenia has no domestic electronics industry capable of explaining such a change. These flows are almost certainly re-exports of goods produced elsewhere, often in Western countries or in Asia.
The transit channel matters for productivity in two ways. It allows Russia to obtain some goods that would otherwise be unavailable, which mitigates the technological impact of sanctions. But it adds costs: intermediary margins, longer logistics, payment through third countries and legal risks. These costs raise the price of imported technology and therefore the cost of investment. The stabilisation and slight decline of transit flows after 2023 also suggests that enforcement efforts by Western governments and the intermediary countries themselves have had some effect.
5.5 Has the technological level of imports fallen?
A common hypothesis is that replacing Western suppliers with Chinese and other suppliers lowers the technological quality of the equipment Russia receives, and therefore its productivity. A simple way to test this hypothesis at the aggregate level is to compute the average research and development intensity of supplier countries, weighted by their share in Russia’s technology imports.
Table 3. Research intensity of supplier countries and weighted average for Russia’s technology imports
| Supplier | R&D, % of GDP | Year |
|---|---|---|
| South Korea | 4.94 | 2023 |
| United States | 3.45 | 2023 |
| Japan | 3.44 | 2023 |
| China | 2.58 | 2023 |
| European Union | 2.26 | 2023 |
| United Arab Emirates | 1.49 | 2021 |
| Turkey | 1.42 | 2023 |
| India | 0.65 | 2020 |
| Armenia | 0.29 | 2024 |
| Kazakhstan | 0.16 | 2024 |
| Kyrgyzstan | 0.05 | 2024 |
| Russia (for reference) | 0.94 | 2024 |
| Weighted average for Russia’s technology imports | 2019 | 2021 | 2022 | 2023 | 2024 |
|---|---|---|---|---|---|
| All suppliers | 2.59 | 2.60 | 2.47 | 2.42 | 2.46 |
| Excluding transit hubs (Kazakhstan, Kyrgyzstan, Armenia, UAE, Turkey) | 2.62 | 2.65 | 2.65 | 2.63 | 2.59 |
Source: World Bank World Development Indicators; UN Comtrade; calculations by the author.
The result is counterintuitive. The weighted research intensity of the supplier pool fell only from 2.60 percent in 2021 to 2.42 percent in 2023. Excluding transit hubs, whose own research intensity says little about the goods they re-export, it barely changed (2.65 to 2.63). The reason is simple: China’s research intensity (2.58 percent of GDP) is now slightly higher than that of the European Union (2.26 percent). At the aggregate level, replacing European suppliers with Chinese ones does not mean replacing high-technology countries with low-technology ones.
This finding refines the debate. If the productivity cost of sanctions does not come from a lower average technological level of the countries supplying Russia, it must come from other sources:
- Frontier goods. The most advanced items, such as high-end semiconductors, precision machine tools, aircraft engines and specialised software, are concentrated in a few Western, Japanese and Korean firms and are precisely those targeted by export controls. Their absence matters more than average quality.
- Services and maintenance. Technology is not only equipment. The departure of Western firms removed maintenance, software updates, engineering services and training, which are essential to using equipment efficiently.
- Compatibility and switching costs. Russian factories built around Western equipment must adapt to new standards, which reduces efficiency during the transition.
- Concentration risk. Dependence on one supplier for about 80 percent of technology imports reduces bargaining power and exposes Russia to Chinese policy decisions and to secondary sanctions.
- Transaction costs. Transit, payment difficulties and logistics raise the cost of every imported machine, which reduces the volume of capital acquired for a given budget.
5.6 The growth record: a decade of divergence
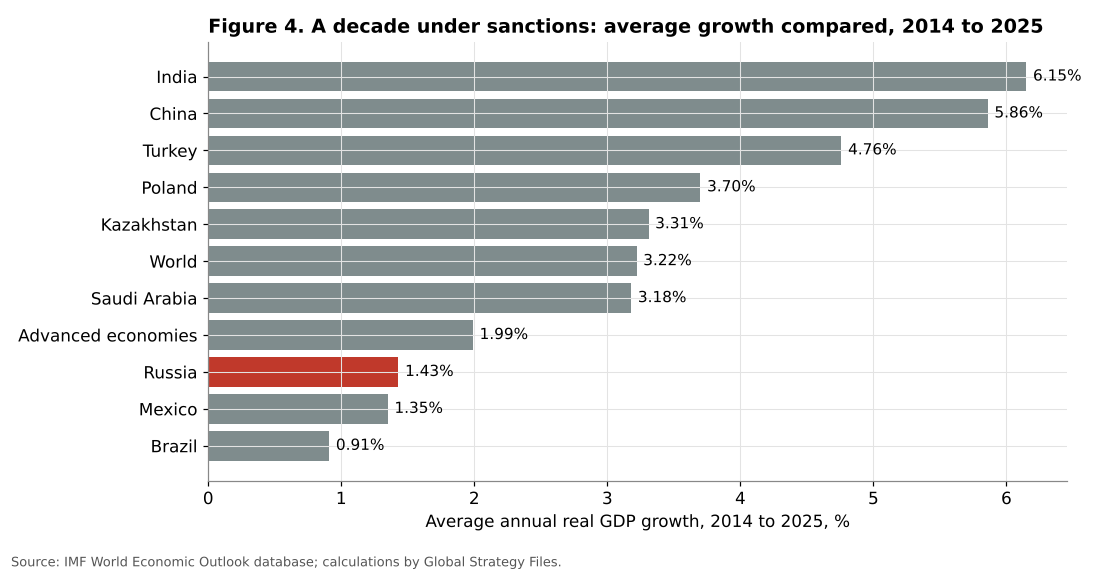
Whatever the precise channels, the macroeconomic result is visible in the growth data. Table 4 compares Russia with selected economies over 2014 to 2025, the period covering both rounds of sanctions.
Table 4. Real growth, 2014 to 2025
| Economy | Average annual GDP growth | Cumulative GDP growth | Cumulative GDP per capita growth |
|---|---|---|---|
| India | 6.15% | 104.7% | n.a. |
| China | 5.86% | 98.1% | n.a. |
| Turkey | 4.76% | 74.7% | 55.0% |
| Poland | 3.70% | 54.6% | 61.2% |
| Kazakhstan | 3.31% | 47.7% | 23.5% |
| World | 3.22% | 46.3% | n.a. |
| Saudi Arabia | 3.18% | 45.6% | n.a. |
| Advanced economies | 1.99% | 26.7% | n.a. |
| Russia | 1.43% | 18.5% | 19.0% |
| Mexico | 1.35% | 17.5% | n.a. |
| Brazil | 0.91% | 11.5% | n.a. |
Source: IMF World Economic Outlook database; calculations by the author. Per capita growth computed where population data were retrieved.
Russia’s average growth of 1.43 percent per year over 2014 to 2025 is less than half the world average and below that of advanced economies. Among the commodity exporters and emerging economies in the table, only Mexico and Brazil grew more slowly. Russia’s per capita growth (19.0 percent cumulative) is slightly higher than its GDP growth because its population declined, but it is far below that of Poland (61.2 percent) or Turkey (55.0 percent), two economies with which Russia was broadly comparable in income per head in 2013.
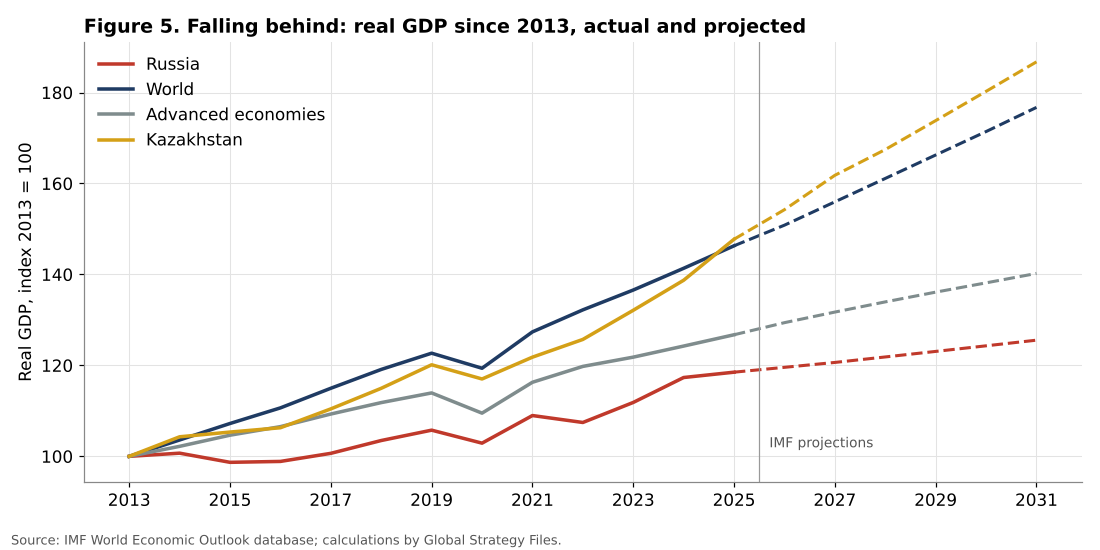
Figure 5 shows Russian real GDP relative to world GDP, both indexed to 100 in 2013. By 2025, Russia’s index stands at 118.5 while the world’s stands at 146.3: relative to world output, the Russian economy has lost 19 percent of its weight in twelve years. On the IMF projections to 2031, the ratio falls to 71, which means a further loss of about 10 points.
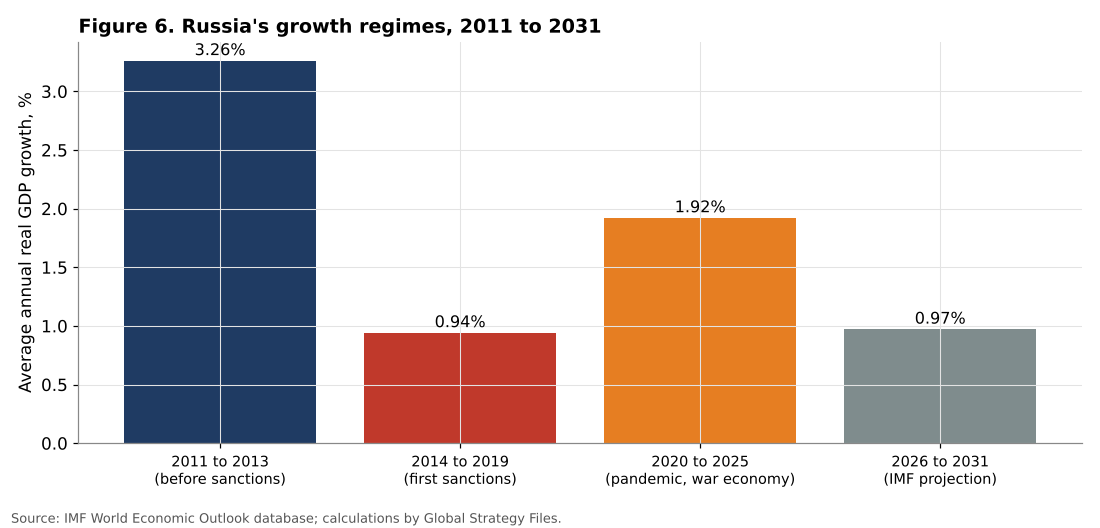
Breaking Russian growth into periods (Figure 6) clarifies the role of sanctions and policy. Average growth was 3.26 percent in 2011 to 2013, before the first sanctions. It fell to 0.94 percent in 2014 to 2019, a period combining sanctions, the oil price collapse and a tight macroeconomic policy. It rose to 1.92 percent in 2020 to 2025, despite the pandemic and the 2022 shock, thanks to the war economy and a large fiscal stimulus. The IMF projects 0.97 percent per year for 2026 to 2031, close to the 2014 to 2019 average. In other words, once the stimulus of the war economy fades, Russia is expected to return to the low-growth regime that followed the first sanctions.
6. Discussion
6.1 What import substitution achieved
The data show that import substitution, in its broad sense of replacing Western suppliers, has been remarkably successful in terms of availability. Within two years, 87 percent of the value of lost Western technology goods was replaced, mainly by China. Total imports in dollars returned to their pre-war level. Russian industry did not collapse for lack of machines.
The supply of vehicles illustrates both the success and its limits. Chinese brands filled the gap left by Western and Korean manufacturers almost immediately. But when the volume of imported Chinese cars reached 25 billion dollars, the government raised recycling fees to protect domestic assembly, and imports halved in 2025. Import substitution in this case meant substituting Chinese imports with Chinese-designed vehicles assembled in Russia, rather than developing Russian technology.
6.2 Why productivity suffers anyway
If the aggregate technological intensity of suppliers has not fallen much, why is Russian growth projected to remain weak? The analysis points to four mechanisms:
1. The cost of capital goods. Longer supply chains, transit margins and payment frictions raise the cost of imported equipment. As shown in the previous article in this series, investment prices rose about 7 points faster than consumer prices in the first half of 2026. A higher relative price of investment reduces the capital stock that a given investment budget buys, which lowers productivity growth (Eaton and Kortum, 2001). 2. The loss of frontier technology. Average research intensity hides the absence of the most advanced goods, which matter disproportionately for high-productivity sectors. 3. The loss of knowledge flows. Foreign direct investment, joint ventures, licences and services are major channels of technology diffusion (Keller, 2004). Their disappearance cannot be offset by imports of equipment alone. 4. Resource allocation. The war economy directs capital and labour towards defence production, which does not raise civilian productivity, while civilian sectors face high interest rates and labour shortages.
The Bank of Russia’s guidelines acknowledge this implicitly. They state that demographics limit labour supply and that growth must therefore come mainly from total factor productivity and fixed capital. They also note that sanctions keep transaction costs elevated. Independent estimates by researchers at the Gaidar Institute suggest that labour productivity growth of about 0.7 percent per year is a plausible medium-term pace, well below what would be needed for growth of 2 percent or more with a shrinking labour force.
6.3 The concentration risk
The dependence on China for about 80 percent of technology imports is a strategic vulnerability. China has both commercial and political reasons to supply Russia, but Chinese firms respond to the risk of secondary sanctions, as the decline of electronic equipment exports after 2023 suggests. A tightening of Western secondary sanctions, a change in Chinese policy, or a disruption of payment channels would affect Russian industry with little possibility of alternative sourcing. The Bank of Russia’s risk scenario, in which sanctions pressure intensifies, assumes a GDP contraction of 2.5 to 3.5 percent in 2026, which gives an idea of the potential magnitude of such a shock.
6.4 Policy implications
For Russian policymakers, the results suggest three priorities. First, the problem is less the availability of equipment than its cost and the absence of the services and knowledge that accompany it; policies should therefore focus on reducing transaction costs and building domestic engineering and maintenance capacity. Second, diversification of suppliers beyond China, towards India, Turkey and other emerging economies, would reduce concentration risk, although these countries have limited capacity in advanced technology. Third, productivity growth requires reallocating resources towards civilian sectors with high potential, which depends on the end of the war economy.
For sanctioning countries, the results show that export controls have not cut Russia off from technology goods in aggregate, but have raised costs, concentrated dependence on China and reduced access to frontier technology and services. The transit channel remains significant, although its growth has stopped. The effectiveness of sanctions in the medium term depends on enforcement in third countries and on China’s policy.
7. Scenarios for 2027 to 2031
Scenario A: stabilised substitution. Supply chains through China and transit hubs remain stable, transaction costs decline gradually, and the war economy winds down. Growth converges towards the IMF projection of about 1 percent per year, with productivity growth around 0.5 to 1 percent. Russia continues to lose weight in the world economy at a rate of about 2 percent per year relative to world output.
Scenario B: deeper technological integration with China. Chinese firms invest in Russian production, transfer technology and provide services. Productivity growth could approach the 1.5 to 2.5 percent potential growth range in the Bank of Russia’s baseline. This scenario requires Chinese firms to accept greater exposure to secondary sanctions, which has not been the pattern so far.
Scenario C: tighter enforcement. Western countries tighten secondary sanctions and enforcement in transit countries, and Chinese banks restrict payments further. Imports of technology goods fall, especially electronics, investment costs rise, and growth falls below 1 percent, with a risk of contraction as in the Bank of Russia’s risk scenario.
8. Conclusion
Has import substitution allowed Russia to escape the productivity cost of sanctions? The evidence suggests that it has allowed Russia to escape the supply cost, but not the productivity cost.
First, Russia has replaced Western suppliers with remarkable speed. The share of sanctioning economies in technology imports fell from 61.9 percent in 2021 to 16.0 percent in 2023, and about 87 percent of the lost value was replaced by other suppliers, mainly China, whose share now exceeds 80 percent.
Second, a transit channel through Kazakhstan, Kyrgyzstan and Armenia multiplied flows of machinery and electrical equipment by eleven, showing that part of Western technology still reaches Russia indirectly, at higher cost.
Third, the average technological intensity of supplier countries hardly changed, because China’s research intensity is now comparable to that of Europe. The productivity cost of sanctions therefore lies in specific frontier goods, services, knowledge flows, transaction costs and concentration risk rather than in the average quality of imports.
Fourth, Russian growth since 2014 has been less than half the world average, and the IMF projects about 1 percent per year until 2031. Russia’s weight in world output has fallen by 19 percent since 2013 and is projected to fall further.
Import substitution has preserved the functioning of the Russian economy, but it has not created the conditions for sustained productivity growth. In the medium term, the limits of replacing imported equipment are not physical but economic: higher costs, weaker knowledge flows and a narrower technological base. Without access to frontier technology and without the end of the war economy, Russia’s potential growth is likely to remain close to 1 percent per year.
Need this analysis for your organisation?
We prepare confidential briefings, executive talks and studies on countries, markets and policies, built on the same method as this article.
Request a briefingSupport independent analysis
Our studies are free to read and carry no advertising. If this one was useful, a small contribution helps us publish the next.
Support our workGo further: books by Global Strategy Files


Frequently asked questions
Has Russia replaced Western imports after sanctions?
Largely, yes in value terms. Non-sanctioning suppliers replaced about 87 percent of lost Western supply by 2023, and China’s share of Russia’s technology imports rose from 34.2 percent to more than 80 percent. Total imports reached 306 billion dollars in 2025, close to the 2021 level.
How do Western goods still reach Russia?
Part of Western technology reaches Russia through transit countries. Exports of machinery and electrical equipment to Russia from Kazakhstan, Kyrgyzstan and Armenia multiplied by 11.4 between 2021 and 2023, which shows that indirect channels operate, but at higher cost and with greater risk.
Have sanctions reduced Russian productivity?
Sanctions have not cut supply, but they weigh on productivity through frontier goods, services, maintenance and transaction costs. The average research intensity of suppliers fell only from 2.60 to 2.42 percent of GDP, yet Russian growth averaged just 1.43 percent a year from 2014 to 2025.
What is Russia’s medium-term growth outlook?
Russia’s medium-term growth outlook is weak. The IMF projects average growth of only 0.97 percent a year for 2026 to 2031. Russia’s weight in world output has already fallen by 19 percent since 2013 and is projected to lose another 10 points by 2031.
Methodological note
All calculations were performed by the author on the data listed in Section 4. Technology goods are the sum of Harmonized System chapters 84, 85, 87 and 90 in partner-reported exports to Russia. Shares and replacement ratios are computed on the eleven partners listed. The weighted research intensity uses each supplier’s share of technology goods as weights. Growth comparisons use IMF World Economic Outlook data, including projections for 2026 to 2031. Data are available from the author on request.
References
Bank of Russia. (2025). Monetary Policy Guidelines for 2026 to 2028.
Bank of Russia. (2026). Balance of payments of the Russian Federation, standard components, updated 30 September 2026.
Coe, D. T., and Helpman, E. (1995). International R&D spillovers. European Economic Review, 39(5), 859 to 887.
Eaton, J., and Kortum, S. (2001). Trade in capital goods. European Economic Review, 45(7), 1195 to 1235.
Felbermayr, G., Kirilakha, A., Syropoulos, C., Yalcin, E., and Yotov, Y. V. (2020). The global sanctions data base. European Economic Review, 129, 103561.
Gaidar Institute for Economic Policy. (2026). Kirill Chernovol laid out conditions for restoring productivity growth in Russia.
Hufbauer, G. C., Schott, J. J., Elliott, K. A., and Oegg, B. (2007). Economic Sanctions Reconsidered (3rd ed.). Peterson Institute for International Economics.
International Monetary Fund. (2026). World Economic Outlook database, accessed through the IMF DataMapper, October 2026.
Keller, W. (2004). International technology diffusion. Journal of Economic Literature, 42(3), 752 to 782.
United Nations. (2026). UN Comtrade database, partner-reported exports to the Russian Federation, accessed October 2026.
World Bank. (2026). World Development Indicators: research and development expenditure (% of GDP).
