China Debt and Infrastructure Renewal


Driss EFFINA, PhD Independent Researcher, Global Strategy Files Decoded, China series, 23 October 2026.
Longer maturity can relieve immediate payments while changing the future cash needed to preserve infrastructure. This preview presents actual Chinese debt arithmetic, dispersed route-age evidence, a funded Beijing procurement and the model conditions that support or reject a repayment-renewal collision.
Rollover and fiscal cash tell different stories
The first original empirical result is an exact decomposition rather than an estimated regression. In 2025, local bond principal due was RMB3.0254 trillion, of which refinancing bonds met RMB2.6187 trillion and fiscal/other resources met RMB0.4067 trillion. Their sum reproduces principal due. Adding RMB1.4843 trillion of interest gives gross principal-plus-interest cash service of RMB4.5097 trillion. Removing the refinanced principal leaves RMB1.8910 trillion of fiscal/other principal plus interest. Both quantities are useful, but they answer different questions. (MOF annual local-debt release, 2025)
Gross service records the cash passing to creditors. The narrower measure records the portion not covered by the reported principal rollover, subject to the source’s fiscal/other classification. It is not purely tax-funded expenditure: project income and other sources can contribute. Nor is it the entire fiscal burden of infrastructure, since it excludes operating subsidies, capital renewal, other government expenditure and liabilities outside the statutory bond perimeter. Calling all gross debt service a fiscal cost would confuse financing inflows with resources supplied from elsewhere. (State Council government-debt report, 2025) (MOF annual local-debt release, 2025)
Over 2019-2025, between roughly 86.1% and 89.8% of due principal was refinanced each year. Even with this high rollover share, fiscal/other principal plus interest rose from RMB0.8235 trillion to RMB1.8910 trillion, an increase of RMB1.0675 trillion. Interest rose from RMB0.6567 trillion to RMB1.4843 trillion. These descriptive increases demonstrate why a low current default rate or substantial refinancing volume does not by itself settle the question of recurring budget capacity. The complete annual observations and arithmetic are preserved. (MOF annual local-debt release, 2019) (China Fiscal Magazine / MOF, 2020) (MOF annual local-debt release, 2021) (MOF annual local-debt release, 2022) (MOF annual local-debt release, 2023) (MOF annual local-debt release, 2024) (MOF annual local-debt release, 2025)
The result does not show what the cash bill would have been without restructuring. Stock growth, recognition, coupons and maturity composition all change simultaneously. Identifying a swap’s causal saving would require a counterfactual and a matched obligation. The defensible finding is narrower: rollover greatly reduces the immediate own-resource principal call, while the retained measure of non-rollover debt cash still rises. That observed accounting fact motivates adding physical renewal to a service budget, without pre-judging whether a particular project’s revenues can cover it.

Older routes form a dispersed exposure
CAMET’s end-2024 evidence contradicts an assumption that all Chinese urban rail belongs to one construction cohort. Its report identifies 646.02 km on 19 lines aged at least 20 years, 897.35 km on 19 lines in the 15-20-year band, and 2,226.02 km on 60 lines in the 10-15-year band. Their sum is 3,769.39 km, or 30.9963% of the reported 12,160.77 km network. The two older bands together represent 1,543.37 km, or about 12.69%. These are calculated shares of reported exposure, not estimates of replacement cost. (CAMET 2024 statistical annual report)
The source’s interior age-boundary wording does not resolve every endpoint convention, so the original named bands are retained. The remainder is not assigned an exact age or an assumed commissioning year. A route is also a service geography, not a single homogeneous component. Vehicles can be reassigned, signalling can be renewed, and later extensions can have different vintages from the original opening. First opening dates do not identify the ages of the latest installed pumps, electrical systems or communications equipment.
The distinction changes the interpretation of a replacement hump. Older route exposure is a reason to collect component histories and inspect condition, but it is not a prediction that every older line needs a complete rebuild. A recently renewed signalling system on an old route can have a long remaining life, while fast-obsolescing equipment on a newer line can need earlier intervention. The report’s distribution gives an empirical guardrail against the deliberately synchronized age-10 model used below. That constructed model must never be multiplied by national route length and called a Chinese forecast.
The defensible inference is that a sizeable, dispersed set of services already operates on older corridors, making recurrent capital planning consequential. Whether it creates a debt-financing problem depends on the current component ages, intervention choices, prices, contract dates and funding. The first useful micro-dataset would record those variables together. A national age histogram, however carefully transcribed, cannot replace them. Its contribution is to constrain narratives and guide sampling: compare several age bands and record prior replacement, rather than select only an apparently dramatic old line.

Beijing provides a funded renewal counterexample
The Beijing Line 10 communications-and-signalling integration tender gives an estimated RMB1,039,544,078, or about RMB1.0395 billion, with 100% local-government investment. Its scope covers design, manufacturing, supply, dismantling coordination, testing, integration, safety assessment, training, spares and warranty. This establishes a real planned intervention and an explicit funding designation. It is a procurement estimate, not an awarded price, audited expenditure or annual disbursement calendar. The original tender correction, filed in November 2024, is retained for verification. (Beijing Line 10 official tender correction, 2024)
The funding statement is substantive counterevidence to an operator-level unfunded replacement narrative. It shows that a large intervention can have a designated public financing source. It does not prove that all payments were executed, nor that the municipality faces no competing demands. At operator level, a credible grant is an inflow; at consolidated municipal level, it becomes expenditure financed from that wider budget. Counting both the operator’s capital outlay and the municipal grant as two separate resource costs would double count the same intervention.
Shenyang provides a differently measured example. An issuer award disclosure records RMB238,150,895 for Line 1 CBTC localization over 2024-2027, covering existing and extension systems, integration, commissioning, training, spares and warranty. The supplier describes a 10-15-year renewal cycle; that commercial description is not a universal engineering standard. Unlike Beijing’s estimate, this is a disclosed award amount, but it still does not provide a complete multi-year payment series or a verified split between service preservation and technological improvement. (Shenyang Line 1 issuer award disclosure, 2024)
Neither case links the procurement to a documented extension of the original construction debt. A common city or metro system does not establish the same debtor or use of proceeds. An examined Beijing infrastructure issuer prospectus contains debt disclosures, but unmatched and time-sensitive securities are excluded from this article’s quantitative results. The appropriate conclusion is that renewal demand and financing arrangements are observable in selected public records, while the decisive debt-to-component link remains missing. The funded Beijing case must stand alongside the model’s unfunded illustration whenever policy implications are discussed.
Table 5. Named renewal procurement and funding status
| Case | Value / status | What remains unknown |
|---|---|---|
| Beijing Line 10 | RMB1.039544078bn estimated; 100% local-government investment | Award, actual payment dates, preservation share |
| Shenyang Line 1 | RMB0.238150895bn award; 2024-2027 scope | Annual disbursement, preservation versus upgrade |
| Both cases | Real component procurement evidence | No verified original/restructured debt-to-asset link |
Neither case is a national cost-per-kilometre calibration or a documented debt-swap collision. (Beijing Line 10 official tender correction, 2024) (Shenyang Line 1 issuer award disclosure, 2024)
A constructed alignment raises the bullet peak
The following experiment measures cash in currency units per 100 units of opening replacement cost, rather than RMB. It holds service quantity, quality, population and real replacement prices fixed. Opening principal is 40 units: the original five-year bullet at a 5% coupon is compared with a fifteen-year bullet at 2.5%. Components begin at age ten at end-2026, and the synchronized calendar is deliberately constructed. The main contract comparison assumes no subsequent refinancing.
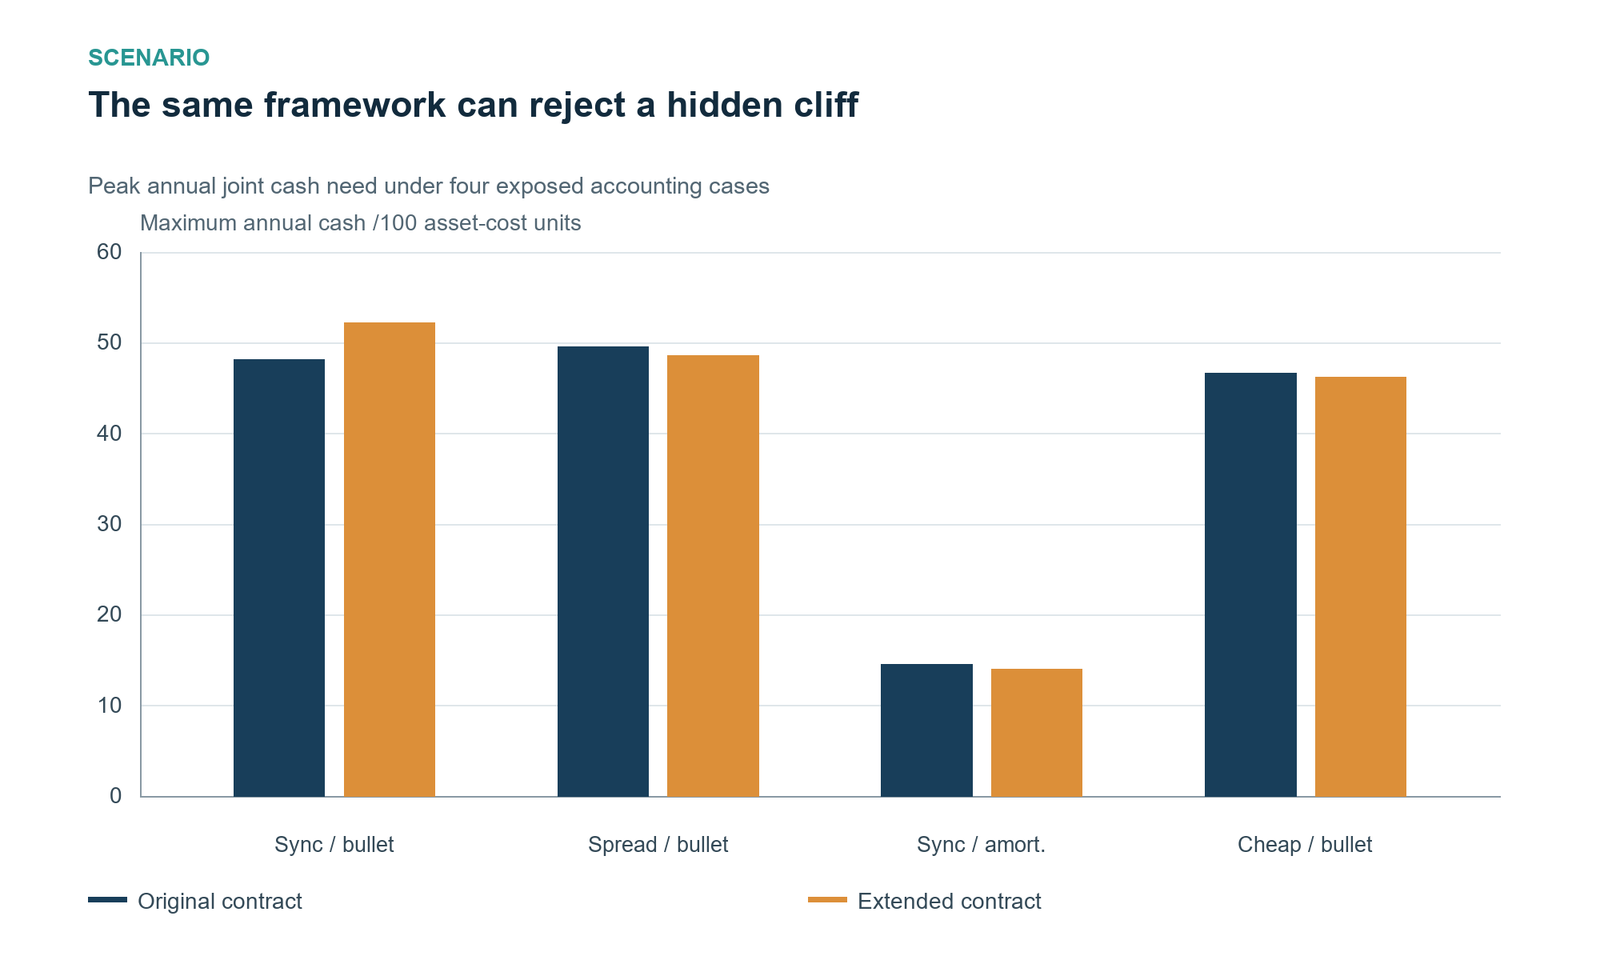
In the deliberately synchronized bullet experiment, extension moves the maximum annual requirement from 48.1000 units in 2031 to 52.2307 in 2041, an increase of 4.1307 units or 8.5877%. The arithmetic is exact within the stated assumptions. At the original maturity, fixed operating and maintenance cash is 4.5, renewal is 1.6, principal 40 and interest 2. Their sum is 48.1. At the extended maturity the corresponding quantities are 4.5, 6.73067, 40 and 1, summing to 52.23067.
The lower annual coupon saves one unit at the maturity date, but the deliberately aligned renewal requirement is 5.13067 units higher. That difference explains the net increase. Near-term relief is real within the experiment: the 2031 principal payment disappears from the extended contract. The finding is that relief at one date need not minimize the later maximum of the complete calendar. The model’s maximum rolling five-year mean rises from 15.3000 to 18.5453, so the central result is not solely a comparison of isolated annual chart spikes.
This is a constructed stress, not a discovered Chinese collision in 2041. Opening age ten, 25-year modes and a fifteen-year extension were selected to align. No national component cohort or matched swap instrument justifies exporting that date into a forecast. The observed CAMET route-age evidence is dispersed and refers to routes rather than equipment. A credible application would replace this constructed physical calendar with current component histories and the assumed contract with executed original and revised terms.
The result also does not yet show a financing shortfall. The complete cash peak can be covered by committed grants, recurring revenue or accumulated reserves, as the later funding calculation demonstrates. Calling a larger gross requirement insolvency would silently assume those resources away. The stress is useful because it identifies which missing observations matter: principal concentration, component synchronization, replacement prices and dated funding. The next pages deliberately change those assumptions and reject the central peak result in several economically interpretable cases.

Dispersed component ages remove the renewal hump
The stationary-age counterexample uses an explicit renewal-theory distribution: the probability of opening age a is S(a)/E[L]. It is not a naive uniform age spread. For a continuing fixed service with this equilibrium age composition, expected annual replacement equals component cost divided by expected life. Summing the four components gives 50/60 + 20/25 + 20/25 + 10/16 = 3.058333 units every year. The code verifies constancy to floating-point precision over the full generated horizon.
Under this age composition the original bullet’s complete peak is 49.5583, and the extended bullet’s is 48.5583, a reduction of one unit. Constant renewal means moving principal does not change the replacement amount at maturity. The lower annual coupon therefore lowers the peak directly. The same debt extension that raises the peak in the synchronized portfolio lowers it here, with opening replacement cost, service quantity and lifetime distributions otherwise unchanged. Vintage structure is a decisive condition, not a cosmetic sensitivity.
Neither opening portfolio is claimed to describe China nationally. CAMET’s observed route bands establish dispersion, but route age cannot reconstruct the stationary component density or current cost weights. They prevent a presumption of universal synchronization; they do not prove the equilibrium case. Field work should obtain the latest installation or major-replacement date for each significant component, record operational condition, and test what is unknown. If only route ages are available, a range of component-age allocations is more defensible than a point estimate disguised as observation.
The distinction also matters for aggregating cases. A few cities with highly concentrated original construction can show large local humps while a national portfolio smooths them, and the reverse can occur if budgets face correlated funding pressures. This model does not estimate those correlations. It shows a falsifier: sufficiently dispersed component vintages can eliminate the particular timing mechanism. A claim of a national cliff must survive that possibility with evidence. The empirical route histogram and the stationary calculation therefore constrain the conclusion as strongly as the deliberately aligned central example.
Three counterexamples bound the collision claim
The model’s main comparison is deliberately symmetric in evidentiary status. The synchronized bullet case raises the annual peak by 4.1307 units. Stationary ages lower it by 1.0000; synchronized equal-principal repayment lowers it by 0.5360; cheap renewal at 0.1 times central prices lowers it by 0.4869. These are four conditional accounting outcomes, not a central estimate with three confidence intervals. No probability is assigned to the scenarios, and no national population of projects is sampled.
A financing counterexample is separate again. Adequate committed funding and reserves can meet an unchanged gross peak, so a cash burden can remain high while its residual gap disappears. Actual funded procurement, such as Beijing’s, is relevant evidence for that possibility but does not establish a country-wide funding surplus. The analytical distinction is essential: asset age explains an intervention requirement, debt shape explains a creditor calendar, and resources determine whether either produces a shortfall. All three have to be measured before the article’s original question can receive a national numerical answer. (Beijing Line 10 official tender correction, 2024)
The result that survives every case is more modest and more operational. Ignoring renewal leaves a service budget incomplete whenever replacement is required, but the sign of extension’s effect on the maximum complete cash need is not determined by longer maturity alone. The model exposes the conditions responsible for that sign. Its sensitivity grids can be rerun with a real component register or a lender term sheet, making the framework usable when those records become available.
A future finding should therefore be framed as a tested proposition about a defined sample. For example, an observed extension raises a documented operator’s maximum unfunded cash need under a verified preservation plan; or it lowers the need across engineering bounds; or a dedicated transfer covers it. Each statement is falsifiable and useful. The current evidence supports a measurement framework, original descriptive results and a constructed possibility with clear rejection cases. It does not support a claim that China’s recent swaps have created a nationwide replacement cliff.
Continue reading
Get the complete 30-page research note
The English PDF contains 17 figures, 11 tables, the complete 2019-2025 debt cash series, component-renewal derivation, 650-contract sensitivity, price break-even, funding/reserve tests and clickable primary-source references.
29 USD, instant PDF download, secure card payment.
Buy the full noteOne-time purchase. Information cutoff: 23 October 2026. The model is a transparent conditional experiment; it does not estimate a national financing gap.
Need this analysis for your organisation?
We prepare confidential briefings, executive talks and studies on countries, markets and policies, built on the same method as this article.
Request a briefingSupport independent analysis
Our studies are free to read and carry no advertising. If this one was useful, a small contribution helps us publish the next.
Support our workGo further: books by Global Strategy Files

Books from Global Strategy Files
Go further on this topic
The Tariff GambleHow America’s trade war is reshaping power, prices and prosperity.24.99 USD, see the book Future-Proofing AmericaEconomic challenges and the road to reform.20 USD, see the book
 Kill KennedyWhat the 2025 declassified files reveal about the machinery of American power.20 USD, see the book