China Shrinking Cities and Utilities

Driss EFFINA, PhD Independent Researcher, Global Strategy Files Decoded, China series, 23 October 2026.
Lower sales, fewer active accounts and higher household bills are different measurements. This preview joins observed Chinese cost countercases with a service-preserving model that can support or reject a burden on remaining users and migrant families.
Twelve water-flow observations resist a simple decline story
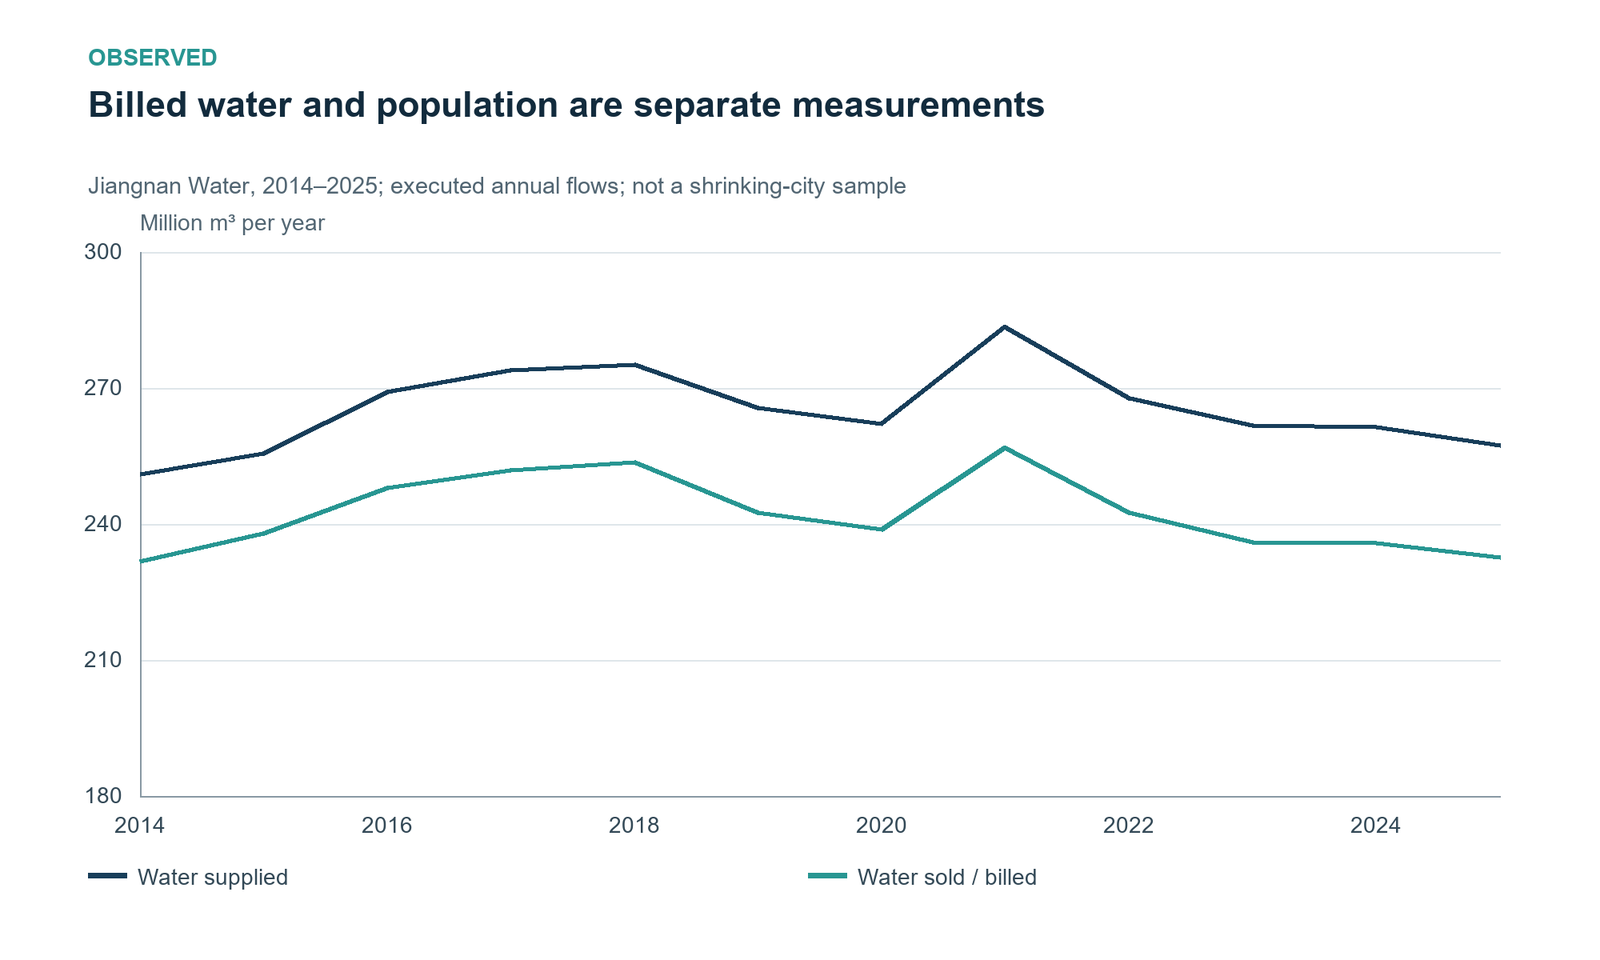
Jiangnan Water’s issuer disclosures provide twelve annual observations from 2014 through 2025. Billed water rises from 231.8239 million cubic metres in 2014 to 232.7367 million in 2025, a calculated endpoint increase of only 0.393747%. From its 2021 peak of 256.8154 million, however, it falls 9.375879%. The starting point changes the descriptive account. Neither comparison measures lost households or meters: the source series is reported water-sales volume, and the operator is an accounting case rather than a designated shrinking-city treatment sample. (Jiangnan 2015 annual report) (Jiangnan 2022 annual report) (Jiangnan 2025 annual report)
The intervening path is varied. Billed volume reaches 253.7379 million cubic metres in 2018, falls to 238.8620 million in 2020, rebounds in 2021 and then declines through 242.5469, 235.9742 and 235.9294 million in 2022-2024. Supplied volume is separately reported and remains above billed volume. The gap is not certified physical leakage: operational use, measurement timing and reporting definitions can also contribute. The article does not infer a leak rate or a household demand series by relabelling the difference. (Jiangnan 2018 social responsibility report) (Jiangnan 2020 annual report) (Jiangnan 2022 annual report) (Jiangnan 2023 annual report) (Jiangnan 2024 Q 4 operating disclosure)
Every row preserves its report and source vintage. The 2024 observation comes from an executed fourth-quarter operating disclosure, explicitly unaudited at release, and is consistent with the later rounded annual change. Actual volumes are distinguished from next-year operating plans. Where a shareholder narrative described a positive change inconsistent with reported 2023 levels, the calculation uses the annual-report levels and recomputes the direction. Issuer-authored disclosures reproduced on financial portals retain their host status instead of being misdescribed as original-host documents. (Jiangnan 2023 annual report) (Jiangnan 2024 Q 4 operating disclosure)
The long series establishes demand and production context without holding assets or customers constant. Installation activity, business scope and capital additions can change during twelve years. A causal scale estimate would require those changes and input prices to be controlled or modelled. The descriptive series is useful precisely because it constrains a universal narrative: a near-flat long endpoint, a decline from a selected peak and later cost changes can all coexist. None alone reveals the number of active accounts that must finance a particular service footprint.
Falling volume can accompany falling unit cost
The 2023 cost comparison initially supports the proposed pressure mechanism. Jiangnan’s billed volume falls 2.7099% from 2022, while disclosed water-supply accounting cost rises 6.5324%. Cost per billed cubic metre increases 9.4997%, from RMB1.410015 to RMB1.543963. The numerator is the reported water-supply cost category, separated from unrelated installation and service segments. It is an accrual measure, not the entire operator cash requirement, and does not identify a fixed-cost elasticity. (Jiangnan 2023 annual report)
The 2025 comparison supplies a prominent counterexample. Billed volume falls 1.3532% from 2024, but supply accounting cost falls more, by 2.5327%. Cost per billed cubic metre declines 1.1956%, from RMB1.416589 to RMB1.399653. A shrinking volume denominator therefore does not guarantee a rising ratio. Its upward arithmetic contribution can be outweighed by a declining numerator. Reporting only the earlier adverse year would turn a selected observation into a structural rule that the retained later evidence rejects. (Jiangnan 2025 annual report)
The comparison also separates cost per billed unit from cost per supplied unit. For 2025 the latter is RMB1.265376, because supplied water exceeds billed water. The two ratios answer different accounting questions. Neither is marginal cost or a household bill. A tariff may cover other obligations, use different customer classes and contain multiple components; an accounting category can include noncash charges. Comparing a regulated price with one ratio without reconciling those boundaries would manufacture a funding gap.
The appropriate conclusion is conditional. Lower billed volume puts pressure on a ratio when other costs are unchanged, but actual costs need not remain unchanged. Wages, energy, maintenance, asset accounting, input prices and operational decisions can all move. The next page decomposes the observed ratio exactly, then the model states which costs it holds fixed. This order matters: empirical arithmetic identifies what changed in the retained reports, while the constructed model explains a mechanism under assumptions. Neither converts the other into an identified causal effect of urban population loss.

An implemented tariff differs from an actual annual bill
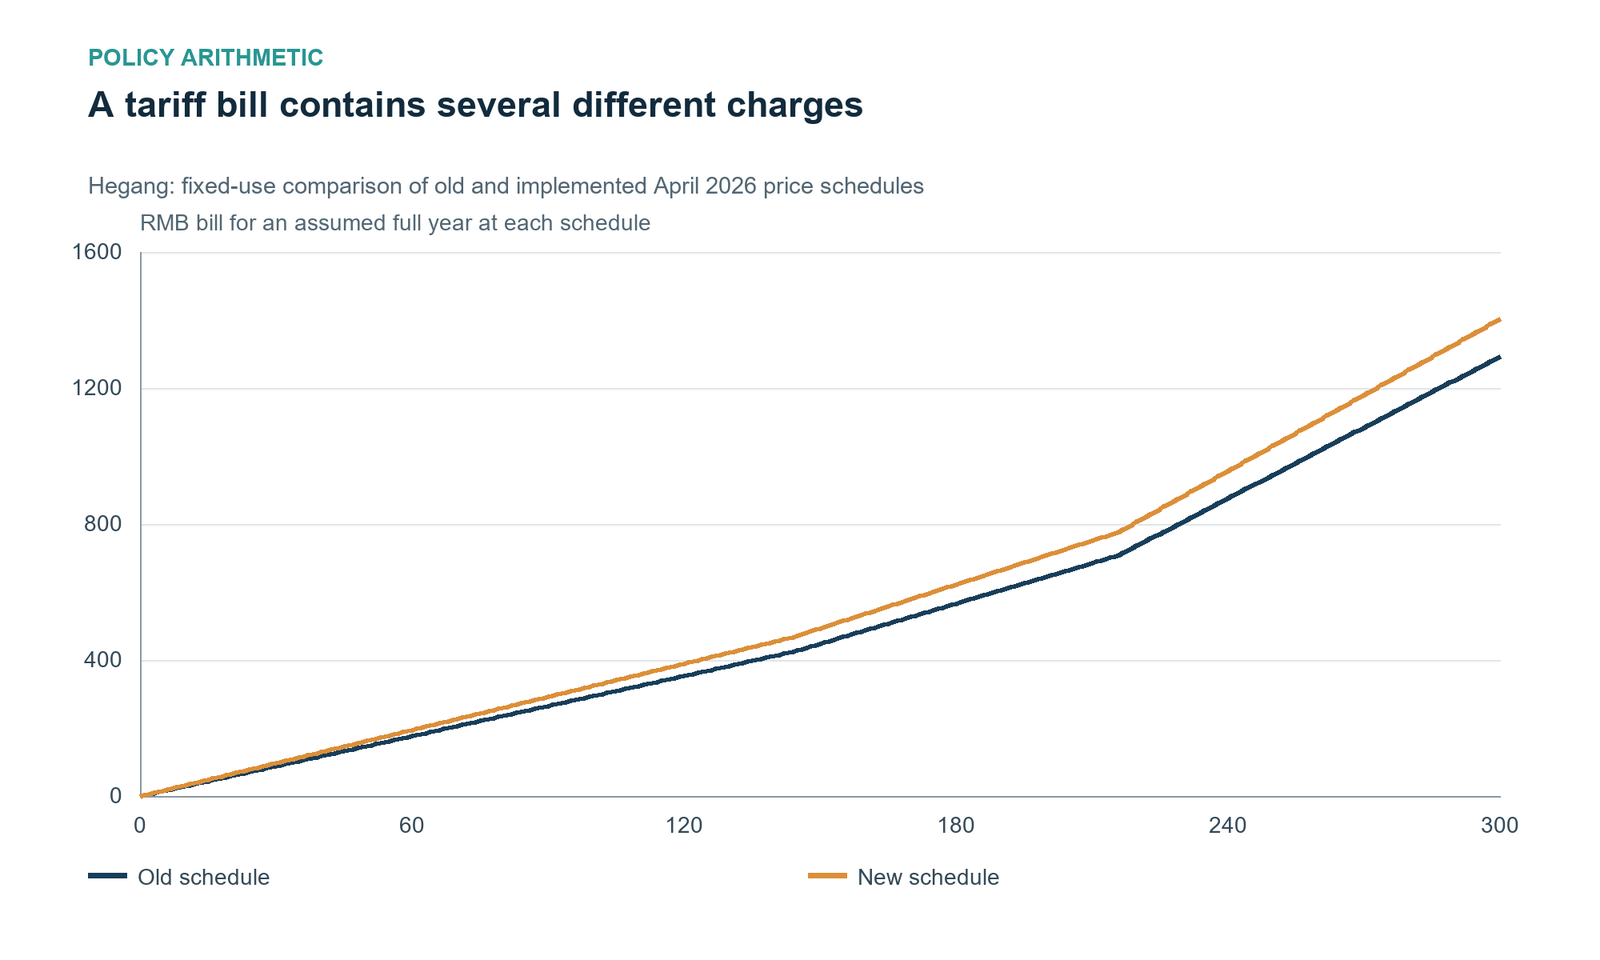
Hegang’s official explanation dated 7 April 2026 states that the revised water tariff took effect on 1 April. Annual progressive base-water blocks cover the first 144 cubic metres, the next 72, and use above 216. Old versus new base rates are RMB1.80/2.10, RMB2.80/3.15 and RMB5.80/6.30 per cubic metre. The separately described resource component is RMB0.20, while the normal residential sewage charge of RMB0.95 remains unchanged. The bill calculation adds those components once. (Hegang implemented water tariff explanation) (Hegang Sanli tariff public-notice system)
At fixed annual use of 96 cubic metres, applying each steady schedule for a whole year gives RMB283.20 before and RMB312.00 after, an increase of RMB28.80 or 10.1695%. At 144 cubic metres, the corresponding bills are RMB424.80 and RMB468.00. These are hypothetical schedule comparisons, not actual 2026 expenditure. The April implementation date, actual consumption, meter cycles and eligibility would be needed to reconstruct a real calendar-year bill.
Progressive blocks apply only to incremental units. At 240 cubic metres, the new base charge is 144 times 2.10 plus 72 times 3.15 plus 24 times 6.30, followed by the separately applicable components on total use. Repricing every cubic metre at the highest reached rate would overstate the bill. The new low-income base concession is reported at RMB1.00 per cubic metre, but the old concession and relevant sewage exemption were not verified, so the article does not invent a complete concession comparison. (Hegang implemented water tariff explanation)
The official explanation discusses input and operating costs, old pipes, wages and raw-water price changes. It does not identify how much of the tariff change was caused by resident decline. The implemented schedule is strong evidence about policy timing and arithmetic, while the census supplies separate population context. Keeping them separate allows a useful current result without a causal claim the records cannot sustain. It also demonstrates why a household bill requires consumption and eligibility as well as a headline unit price.
Equal total water use can produce opposite bills
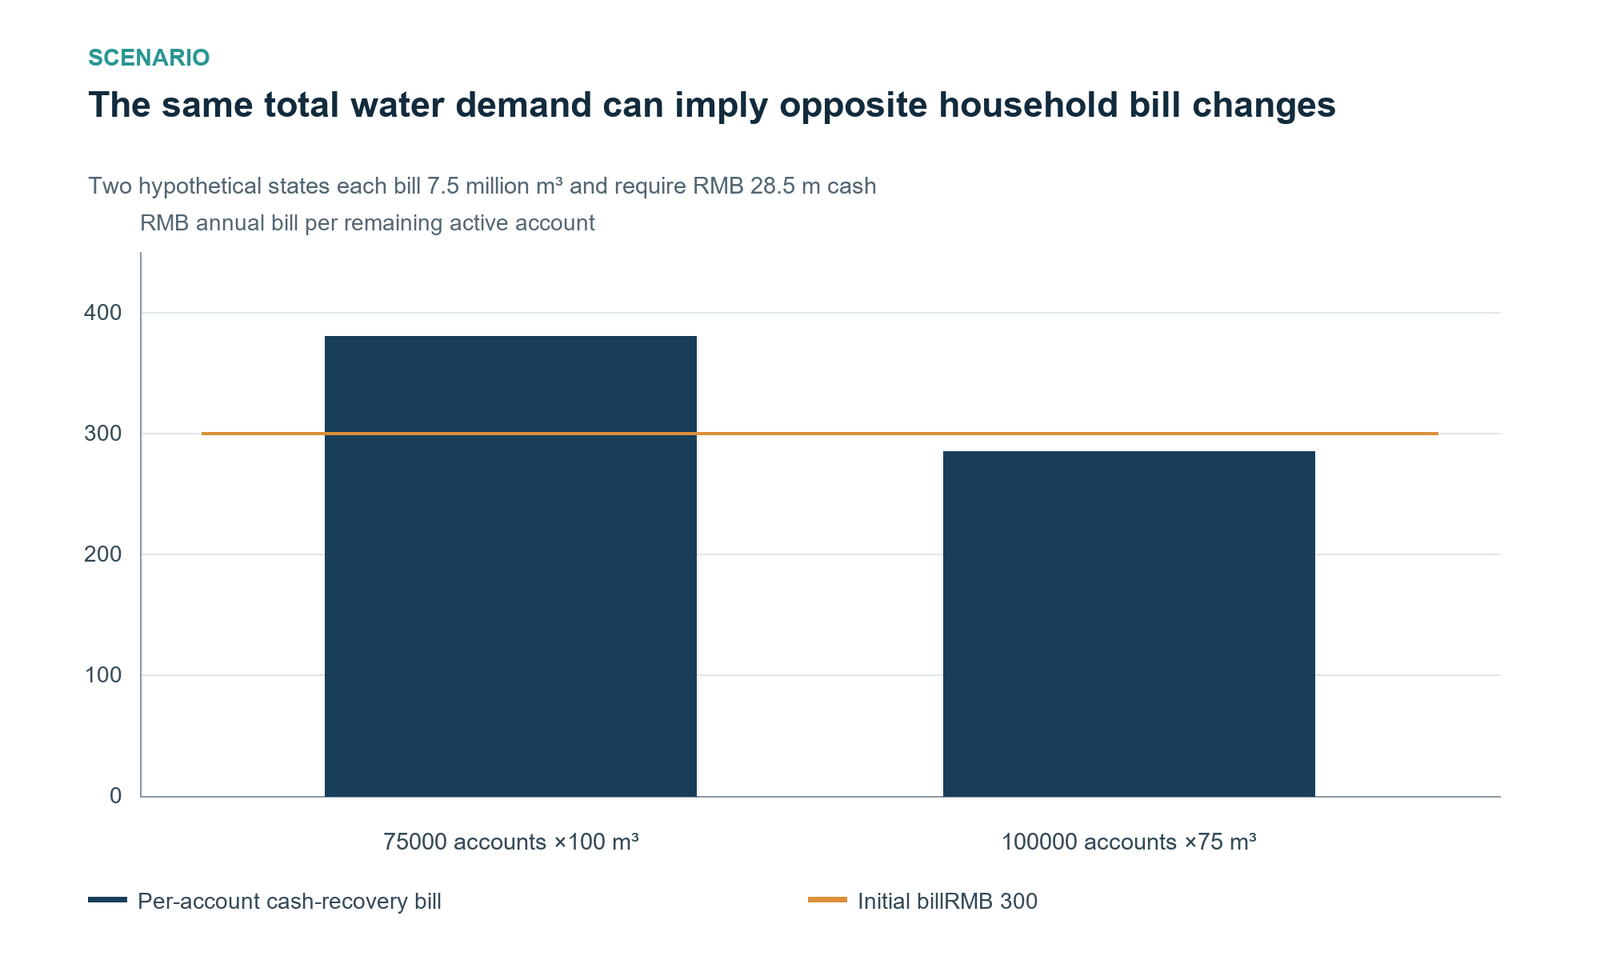
The decisive prototype comparison holds aggregate billed volume, resources, cash need and recovery price identical. In one case, active accounts fall 25% to 75,000, with use fixed at 100 cubic metres each. In another, accounts remain 100,000 but use per account falls to 75 cubic metres. Both sell 7.5 million cubic metres, require RMB23.5 million of resources and RMB28.5 million of cash, and recover at RMB3.80 per cubic metre. The annual bills nevertheless differ sharply.
With fewer accounts, each remaining account pays RMB380, up RMB80 or 26.6667% from baseline. With unchanged accounts and less use, the bill is RMB285, down RMB15 or 5%. A higher unit tariff and lower aggregate volume therefore do not establish a larger household bill. The household denominator and consumption quantity are necessary observations. This is a constructed accounting counterexample, not a forecast of actual demand or a claim that lower consumption has no welfare consequences.
The result explains why public water-volume records cannot resolve the original migration-incidence question. A resident’s departure can close a meter, leave relatives using the same account, reduce use in an occupied dwelling or change nonresidential demand. These paths have different bill consequences under the same aggregate sales decline. The retained Chinese cases do not identify which path occurred. The model consequently refuses to label a fall in billed volume an observed active-account shock.
The prototype’s all-residential normalization is also explicit. Real operators serve industrial and commercial customers, apply blocks and may charge fixed fees. A uniform recovery price simplifies the accounting, not the tariff policy problem. The useful finding is a falsifier to inference from volume alone. Any empirical claim about remaining households must reconstruct account counts and actual bills, while allowing a zero or negative annual-bill result. The model can raise a unit price in both cases and still reject the asserted household burden in one.
Tariffs, budgets and relatives divide one residual
Let x be the fraction of the prototype’s RMB6 million residual funded by higher tariffs. Remaining consumers pay x times that amount and public transfers finance the remainder. At x=1, each remaining account’s bill rises RMB80. With 10,000 linked families and migrant relatives paying half of each linked account’s increment, migrants contribute RMB0.4 million, linked origin households RMB0.4 million and other origin households RMB5.2 million. Those three amounts sum to six million.
Migrant support is carved out of the origin bill, not added on top as another cost. At x=0.5, consumer increments and municipal funding are each RMB3 million. At x=0, origin bills remain at the baseline schedule while the transfer requires six million from another source. The account does not automatically assign municipal funding back to the same remaining households; ultimate incidence depends on taxes, transfers and displaced budget uses that are unobserved in this prototype.
The number of linked families is independent of lost accounts. A migrant can leave parents in an active origin dwelling, whereas a closed account may leave no origin bill to share. Inferring a remittance count directly from account closure would confuse those cases. The selected fifty-percent sharing fraction is an exposed assumption, not a measured family norm or an estimated response. Actual payer changes require linked origin and destination financial records.
A transfer changes financing incidence while preserving the underlying service work. It can shield vulnerable consumers, but the funder’s cost remains in the wider account. Neither a municipal grant nor a remittance is a second physical resource cost. This simple identity is the main contribution of the incidence calculation: it prevents a claim that the remaining user, migrant and taxpayer each bear the same entire bill. It also permits a zero migrant increment when relatives do not share the added payment or funded shielding absorbs it.
An added family payment need not erase migration gains
Define a migrant family’s private gain G net of ordinary destination costs and baseline origin obligations, but before the additional origin utility contribution under the compared funding regime. If relatives pay share alpha of the origin account’s incremental bill delta B, the remaining gain is G-alpha times delta B. Only the increment belongs in this adjustment. Subtracting the full origin bill again would double count an ordinary expense; if G already includes the changed transfer, deducting it once more would repeat the same payment.
At the central RMB80 bill increase and 50% sharing, the added migrant contribution is RMB40 annually. Against an illustrative RMB12,000 private gain, this is 0.333333%, leaving RMB11,960. The model therefore does not establish that utility upkeep materially overturns migration’s benefits. At an assumed gain of RMB500 and full sharing, the same increment absorbs 16%, leaving RMB420. These examples show sensitivity to the gain and payer fraction, neither of which is observed here.
The full thirty-five-cell family grid spans gains from RMB250 to RMB24,000 and sharing fractions from zero to one. It is a conditional bound calculation, not a distribution of migrant gains or a remittance response estimate. Within this particular utility-cost scenario, full tariff finance allocates the entire residual to consumers; funded shielding or zero relative sharing makes the private migrant increment smaller or zero. A credible materiality claim needs actual payments and a correctly defined gain denominator.
Family transfers can also adjust along several margins. Parents can absorb the added bill, relatives can redistribute other support, or the municipality can fund it. A utility account linked to someone outside the city does not show that its price caused additional remittances. Destination labour shocks directly affect migrant earnings and transfer capacity, so they cannot automatically instrument this channel. The accounting contribution is to define an incremental private-gain adjustment without double counting, while leaving its prevalence and causal magnitude to secure linked evidence.
Table 6. Only the incremental family payment is deducted
| Illustration | Added migrant payment | Remaining private gain |
|---|---|---|
| Gain 12,000; share 50% | RMB 40 /year | RMB 11,960;0.333333% absorbed |
| Gain 500; share 100% | RMB 80 /year | RMB 420;16% absorbed |
| No relative sharing | Zero | No added private-migrant utility payment |
| Funded full shielding | Zero consumer increment | Funder remains in wider account |
All gains and shares are assumptions. Do not subtract the full baseline bill or a transfer already included in measured net gains.
Measure accounts and funders before naming a burden
The retained Chinese evidence rejects a simple chain from fewer residents to higher household water bills. No declining active-account panel is established. Jiangnan’s falling 2025 volume and unit cost, Qiqihar’s growing sales and the same-volume model contrast all show why separate numerators and denominators matter. The prototype raises the bill to RMB380 when accounts fall, yet lowers it to RMB285 when unchanged accounts use less. Proportional resource adjustment removes the fixed-upkeep channel; common legacy debt can still leave a distinct RMB316.67 cash bill against RMB250 of resources.
The family conclusion is equally bounded. In the central illustration, a migrant’s added RMB40 payment absorbs only 0.333333% of an assumed RMB12,000 private gain, leaving RMB11,960. Public shielding or zero sharing makes it smaller, while low gains can make it more significant. Actual records must decide. A sound research programme can find a material burden, a safely avoidable network cost or a convincing zero; its task is to trace a defined service and its payments once, rather than let demographic context or a unit tariff stand in for measured household incidence.
Continue reading
Get the complete 30-page research note
The English PDF includes 16 figures, 12 tables, twelve annual flow observations, exact cost and revenue decompositions, implemented tariff arithmetic, topology, transition-cost, demand and family-payment sensitivities.
29 USD, instant PDF download, secure card payment.
Buy the full noteOne-time purchase. Evidence cutoff: 23 October 2026. No declining active-account panel, national financing gap or causal migrant burden is estimated.
Need this analysis for your organisation?
We prepare confidential briefings, executive talks and studies on countries, markets and policies, built on the same method as this article.
Request a briefingSupport independent analysis
Our studies are free to read and carry no advertising. If this one was useful, a small contribution helps us publish the next.
Support our workGo further: books by Global Strategy Files

Books from Global Strategy Files
Go further on this topic
The Tariff GambleHow America’s trade war is reshaping power, prices and prosperity.24.99 USD, see the book Future-Proofing AmericaEconomic challenges and the road to reform.20 USD, see the book
 Kill KennedyWhat the 2025 declassified files reveal about the machinery of American power.20 USD, see the book