China Overseas Contracts and Domestic Liquidity

Driss EFFINA, PhD Independent Researcher, Global Strategy Files Decoded, China series, 24 October 2026.
Actual guarantee payments are observable, but their incremental independent overseas component is not identified in this pilot. This preview states that evidence boundary and the complete synthetic unit, trigger, funding and recovery setup before presenting any conditional tail result.
Real payments do not identify the foreign component
The three-issuer pilot identifies no positive amount of incremental outward obligations to independent overseas counterparties. It does verify real customer guarantee payments and substantial accounting overlap. The missing foreign identification is not an estimate of zero actual exposure, zero foreign calls or zero economic importance. Public categories combine customers whose geography and ownership cannot be matched to the relevant promise. The defensible result is therefore a measurement boundary: the selected disclosures do not support the claimed foreign-contract total, while they do support a reproducible account of what is paid, recognized, authorized and still outstanding. (Zoomlion 2025 annual report, cash/stock/carrying schedules) (Sany Heavy Industry 2026 interim report, CAS) (XCMG 2025 annual report, components and associate status)
This distinction changes the answer to whether overseas contracts cause domestic investment cuts. A guarantee or purchase promise can create a dated cash obligation without an equity link. Yet the channel is incremental only if the promise is enforceable, active, directed outward from the relevant Chinese obligor, tied to an independent foreign beneficiary and absent from the specified baseline. A subsequent funding constraint also requires insufficient available cash or credit at the payment date. None of those conditions follows merely from overseas sales, foreign-currency denomination or an off-balance-sheet label. Many relevant commitments are already disclosed and have recognized accounting amounts.
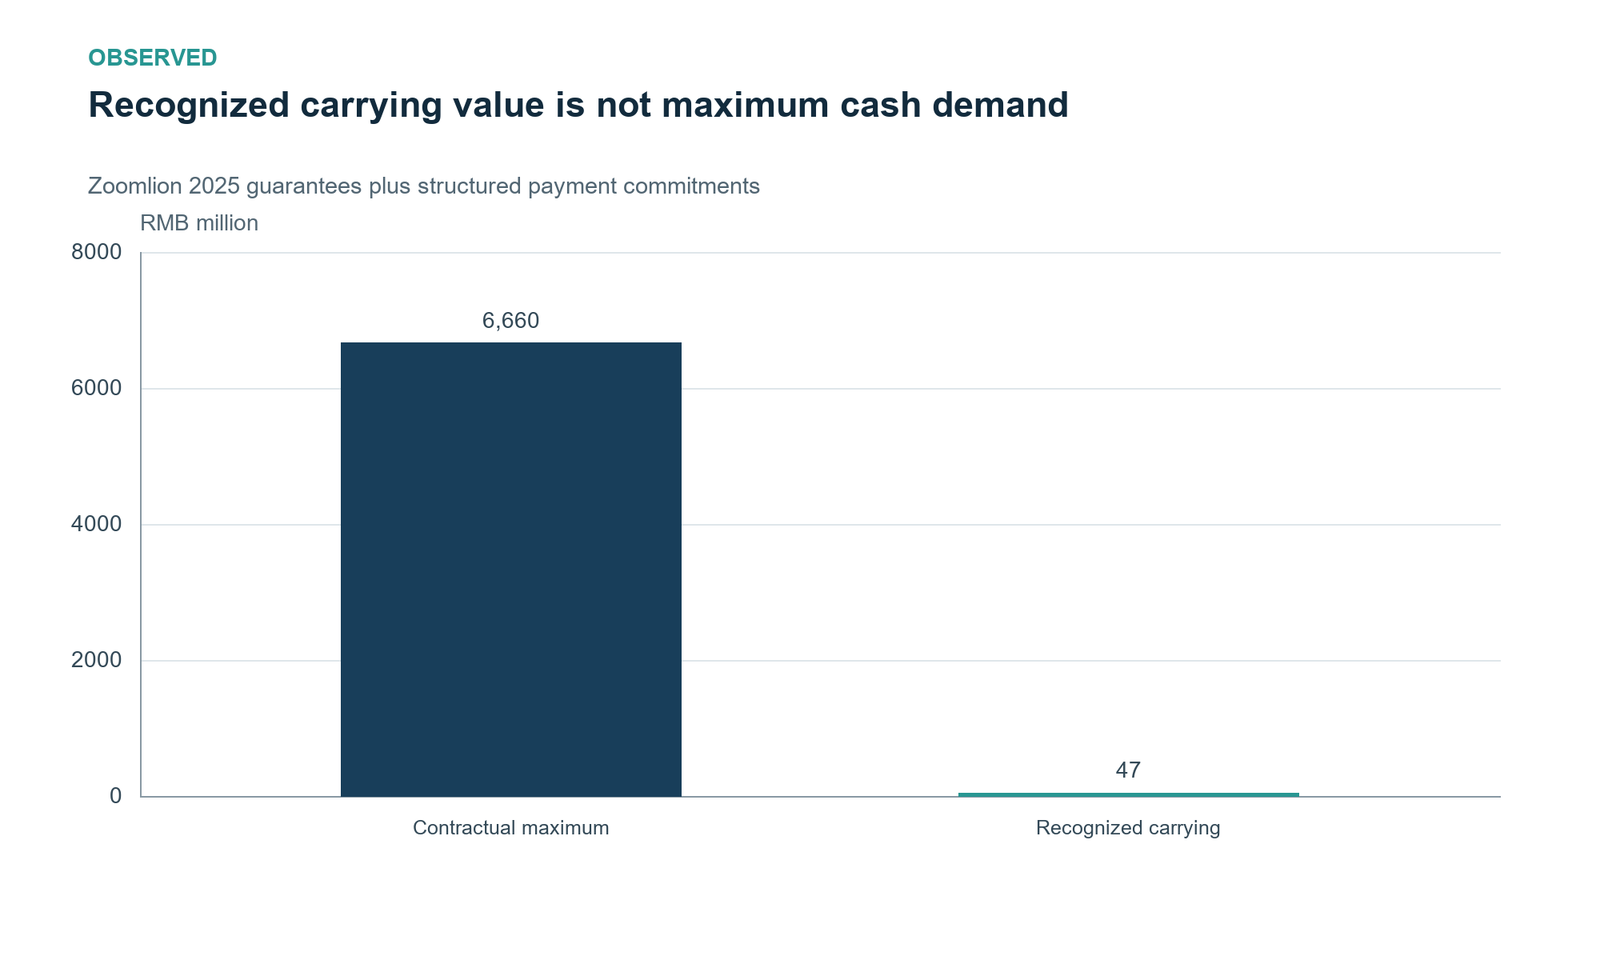
The empirical pilot covers Sany Heavy Industry, Zoomlion and XCMG, using selected annual reports and actual 2026 half-year disclosures. Zoomlion reports RMB 131 million in bank-plus-third-party-lease payments during 2025, and RMB 33 million in January-June 2026 against RMB 72 million in the comparable half-year. These are all-geography cash observations. A separate 2025 schedule contains RMB 6,660 million contractual maximum cash and RMB 47 million recognized carrying value. Adding those two measures would manufacture a second promise; interpreting the carrying amount as emergency cash would manufacture a resource. (Zoomlion 2025 annual report, cash/stock/carrying schedules) (Zoomlion 2026 interim report, actual January-June)
Six stock observations show exposure categories changing
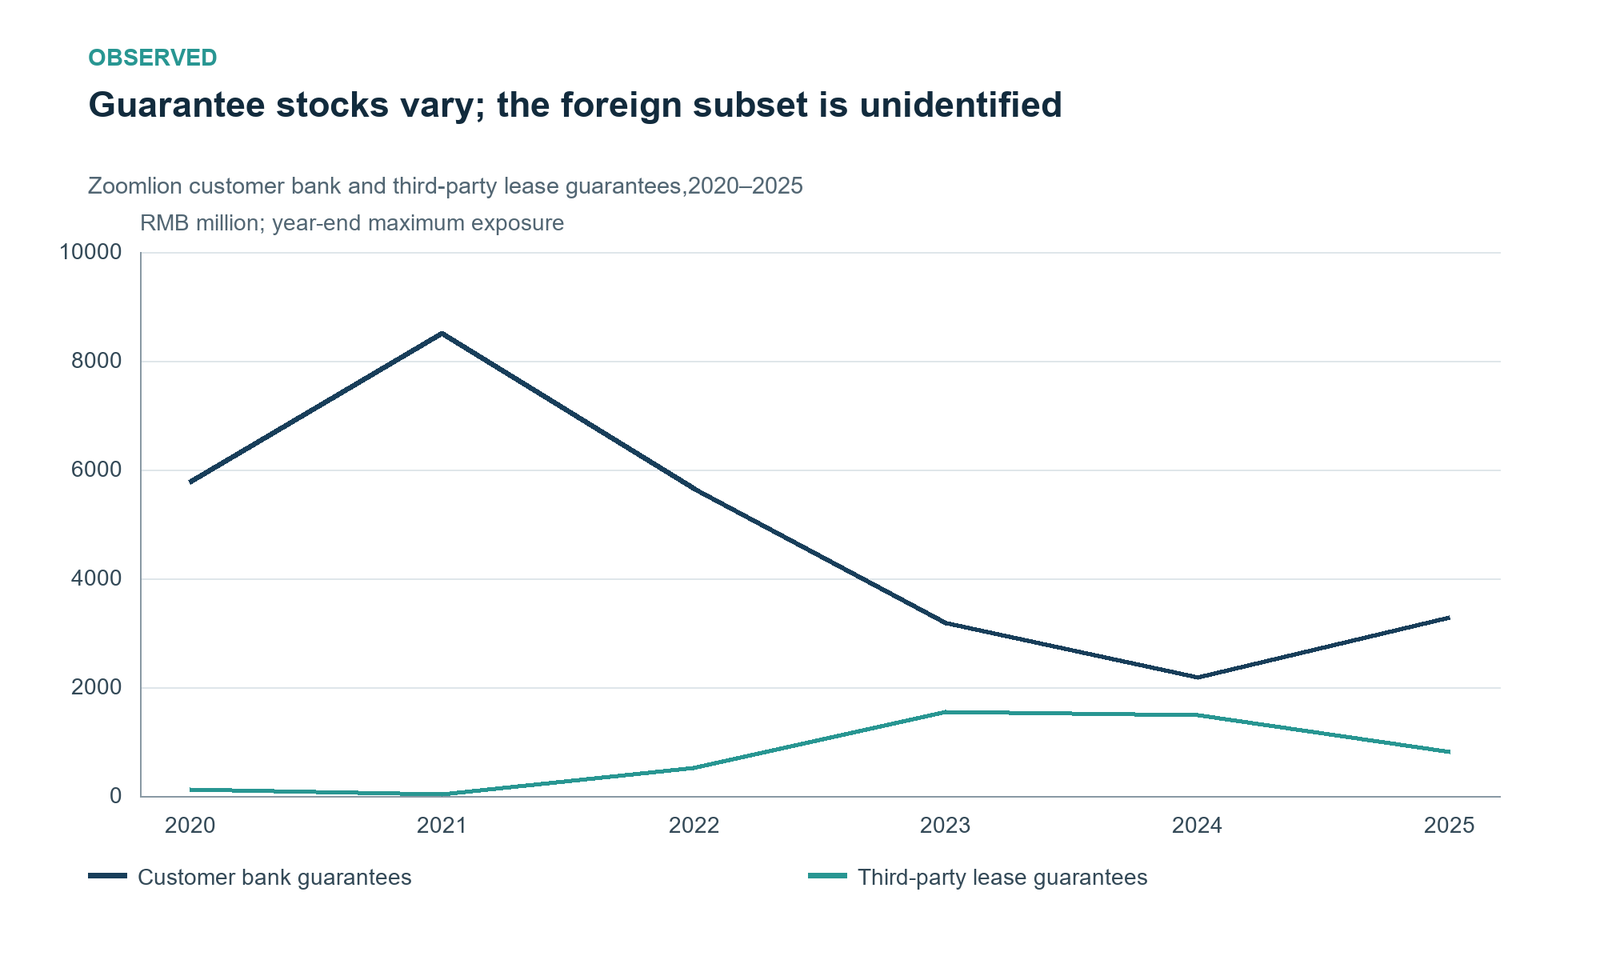
Zoomlion’s matched bank and third-party lease categories provide six annual observations from 2020 through 2025. The bank maximum exposure is RMB 5,770 million in 2020, 8,505 in 2021, 5,649 in 2022, 3,188 in 2023, 2,180 in 2024 and 3,282 in 2025. Third-party lease maxima over the same dates are 130, 43, 529, 1,558, 1,498 and 822 million. Figure 1 preserves those categories as year-end stocks. It does not call them the company’s entire possible guarantee perimeter or locate their foreign component. Cargo-backed guarantees and structured underlying-asset payment commitments are separate disclosures. (Zoomlion 2021 annual report, 2020-2021 observations) (Zoomlion 2023 annual report, original 82m lease-payment observation) (Zoomlion 2025 annual report, cash/stock/carrying schedules)
A maximum exposure is a contractual stock at a date. It says neither how many customers defaulted during the year nor how much cash the issuer actually paid. A change can reflect originations, repayments, expiries, sales of financed machines, amendments and category boundaries. Without a matched facility register, the net movement cannot be decomposed reliably into those flows. The rise of the bank category in 2025 alongside a decline in the lease category therefore establishes a composition change within the reported amounts, not a measured migration of risk from one country or financing instrument to another.
Recognition and maximum cash answer different questions
Zoomlion’s 2025 liquidity table places RMB 47 million carrying value beside RMB 6,660 million contractual undiscounted maximum cash for guarantees and payment commitments. The latter reconciles as 3,282 million bank guarantees,822 million third-party lease guarantees and 2,556 million structured plans. Figure 3 compares different measures of this disclosed schedule; it is not a decomposition of a 6,707 million liability. The carrying amount is neither an additional nominal promise nor cash already available to meet the maximum. Its numerical distance from the maximum is not an estimated trigger probability. (Zoomlion 2025 annual report, cash/stock/carrying schedules)
The 2024 comparator makes the same accounting discipline concrete. Its 5,904 million contractual maximum comprises 2,180 bank,1,498 lease,2 cargo-backed and 2,224 structured-plan commitments, beside 50 million carrying value. The recognized amount follows the disclosed guarantee accounting policy, including the relevant higher-of-recognized-amount-and-expected-credit-loss treatment. Recognition and immediate legal payment demand have different measurement objectives. A provision can record risk while leaving a large contingent cash requirement if a valid claim arrives; it does not function as a reserve of usable bank balances. (Zoomlion 2025 annual report, cash/stock/carrying schedules)
This also limits the language of hidden risk. The commitments appear in the financial statements, so the article cannot infer that accounting, creditors or regulators necessarily overlook them. A useful extension to an ownership map would show exactly which disclosed contracts the baseline excludes and why that omission matters for a dated funding calculation. It would not add a liquidity schedule to the same guarantees a second time. Structured payment undertakings also require attention to their underlying receivable pools and retained financing risks; they are not automatically independent distributor promises simply because a schedule classifies them as commitments.
A synthetic ledger separates the mechanism from issuer amounts
The experiment uses cash units per 100 eligible synthetic commitment units, not RMB, dollars or an observed sector denominator. It is not assigned to Sany, Zoomlion or XCMG and is never scaled by their disclosed maxima. A raw list totals 200 units; explicit filters remove a duplicate, subsidiaries, already-called principal, domestic relationships and unknown foreign linkage. The remaining seven unique facilities total 100 and link abstract issuers A, B and C to six assumed independent foreign trigger nodes. Five facilities are guarantees; the inventory-buyback and minimum-purchase examples are synthetic mechanisms, not contracts verified in the pilot.
The horizon is 24 months, with one constructed foreign event at month 3. A common regime has assumed probability 0.15. Conditional node trigger probability is 0.05 in the normal regime and 0.50 in stress, yielding an unconditional 0.1175 for each node. All 2×2^6=128 states are enumerated exactly. Central enforceability and call fractions are one, expiry is month 12, and payment occurs one month after a qualifying trigger. A call accrued at expiry can be paid after expiry; a new event beyond the active window cannot create that claim under the declared convention.
Each performed call produces assumed gross collateral/disposal recovery of 60% six months later and workout resource use of 2% at that recovery date. Opening usable cash is 8, 7 and 6 for A/B/C, with a 2-unit floor each. Each issuer receives operating cash 1 monthly, owes mandatory service 0.2 and plans new investment cash 0.8. It has an assumed undrawn committed line 8, reduced to 4 in stress, charging 4% annual interest on opening monthly balances. The contractual cash PV uses a 5% annual discount rate; committed-line interest is reported separately. None of these rates, balances or probabilities is fitted to the public disclosures.
The funding order is explicit before any tail result: use available committed credit to preserve the buffer and current plan; reduce only that month’s investment funding capacity up to 0.8; then diagnose any remaining additional required bridge. Surplus repays the bridge before the committed line. The bridge is not offered financing and carries no invented market rate. A positive-bridge payment/recovery calendar is conditional on obtaining new funding and fully performing the obligations. Without it, this accounting engine does not predict payment, default or recovery. Table 5 fixes the normalization and timing so later numerical tails cannot masquerade as measured Chinese outcomes.
Table 5. Synthetic cash experiment: inputs declared before outcomes
| Input block | Central assumption | Scope |
|---|---|---|
| Unit and portfolio | 100 cash units; 7 facilities, 6 trigger nodes, 3 issuers | All synthetic; not RMB or calibrated |
| Trigger law | Stress probability 0.15; node probability 0.05 normal / 0.50 stress | 128 exact states; conditional independence |
| Contract dates/recovery | Trigger month 3; expiry 12; pay lag 1; recover 60% after 6 months; workout 2% | Full performance conditional on any new funding |
| Cash and line capacity | Opening cash A/B/C: 8/7/6; floor 2 each; line 8 each, halved in stress | Lines are usable capacity assumptions |
| Monthly budget | Operating cash 1; mandatory service 0.2; planned investment 0.8 each | 24 months; line interest 4% annually |
| Priority and valuation | Use cash/line, reduce current investment, then diagnostic bridge; PV rate 5% | Bridge not promised; no invented bridge interest |
Every parameter is illustrative. Net-contract PV excludes credit-line interest. The full cash law and matched comparisons are explained in the text.
The event law keeps expected calls fixed
Let Z denote the common foreign regime, with probability 0.15 of stress. Conditional on normal Z, each of the six nodes triggers independently with probability 0.05; conditional on stress, its probability is 0.50. The unconditional marginal is therefore 0.85×0.05+0.15×0.50=0.1175. Each regime-node configuration has its explicit product probability, and the 128 states sum to one within floating-point precision. These are one-event assumptions over the stated horizon, not observed annual default hazards, Chinese customer frequencies or statistical confidence statements.
Expected gross calls follow directly: the exposure weights sum to 100, so the mean is 100×0.1175=11.75 units. The independent comparison uses the same marginal 0.1175 for every node. Correlation changes joint outcomes and higher moments while leaving this expected contractual cash unchanged. For distinct nodes, covariance equals the variance of the conditional probability; the resulting pairwise trigger correlation is approximately 0.248990. The common regime is therefore a transparent distributional choice, not a coefficient fitted to the annual issuer payments.
The main funding comparison changes more than a single unqualified correlation label. Stress Z also halves the available credit limits. In the correlated version, high trigger risk and lower usable funding occur together. In the independent version, node triggers use their fixed marginal independently of Z, although the credit-regime probability remains the same. This breaks the link between customer events and credit capacity. A separate pure-correlation experiment removes the credit haircut in both versions, allowing dependence to be examined without that additional funding linkage. Table 6 keeps the comparisons distinct.
There is no claim that every actual foreign financial shock has this law. A different common-regime probability, sector mix, event date, concentration pattern or funding response would change the tails. Exact enumeration removes Monte Carlo sampling noise; it does not remove model uncertainty. A real probability calibration would require contract-level trigger and survival histories, consistent definitions and treatment of expired, renewed and censored promises. The public disclosure pilot supplies none of that matched record. The scenario is valuable because a reader can see precisely which joint assumptions generate the following results.
Dependence raises the gross-call tail at the same mean
Both event laws generate expected gross calls of 11.75 units, but their upper tails differ. The correlated law has a 95th percentile of 60 and an upper 5% expected shortfall of 74.561693. With independent node triggers at the same marginals, those values are 40 and 49.325968. Figure 9 displays the exact discrete distribution. The comparison demonstrates concentration of simultaneous demand under the declared law; it does not estimate a real industry’s call quantile or attach a sampling confidence band to an unobserved contract portfolio.
The quantile definitions matter in a small finite distribution. The 95 th percentile is the smallest outcome whose cumulative probability reaches 0.95. Expected shortfall is the mean of the upper 5% probability mass, using a fractional amount of the boundary state’s weight when needed. It is not the average of every state whose numerical outcome is at least the quantile, because that set can contain more than 5% mass. Independent checks verify the weighting and analytical moments. Numerical exactness concerns the assumed distribution, not the truth of its economic inputs.
A fixed mean does not make the tails interchangeable for a cash-constrained obligor. A line sized for moderate demands can be adequate often while failing during a cluster. Conversely, correlated triggers can place more probability on very quiet states as well as bad joint states. The next funding results must therefore examine severity and frequency separately. The mere word correlation does not establish that all averages, every event frequency or all corporate investment responses move in the same direction. Here it identifies a declared joint law whose full distribution is available for inspection.

Zero cases prevent a necessary investment-cut story
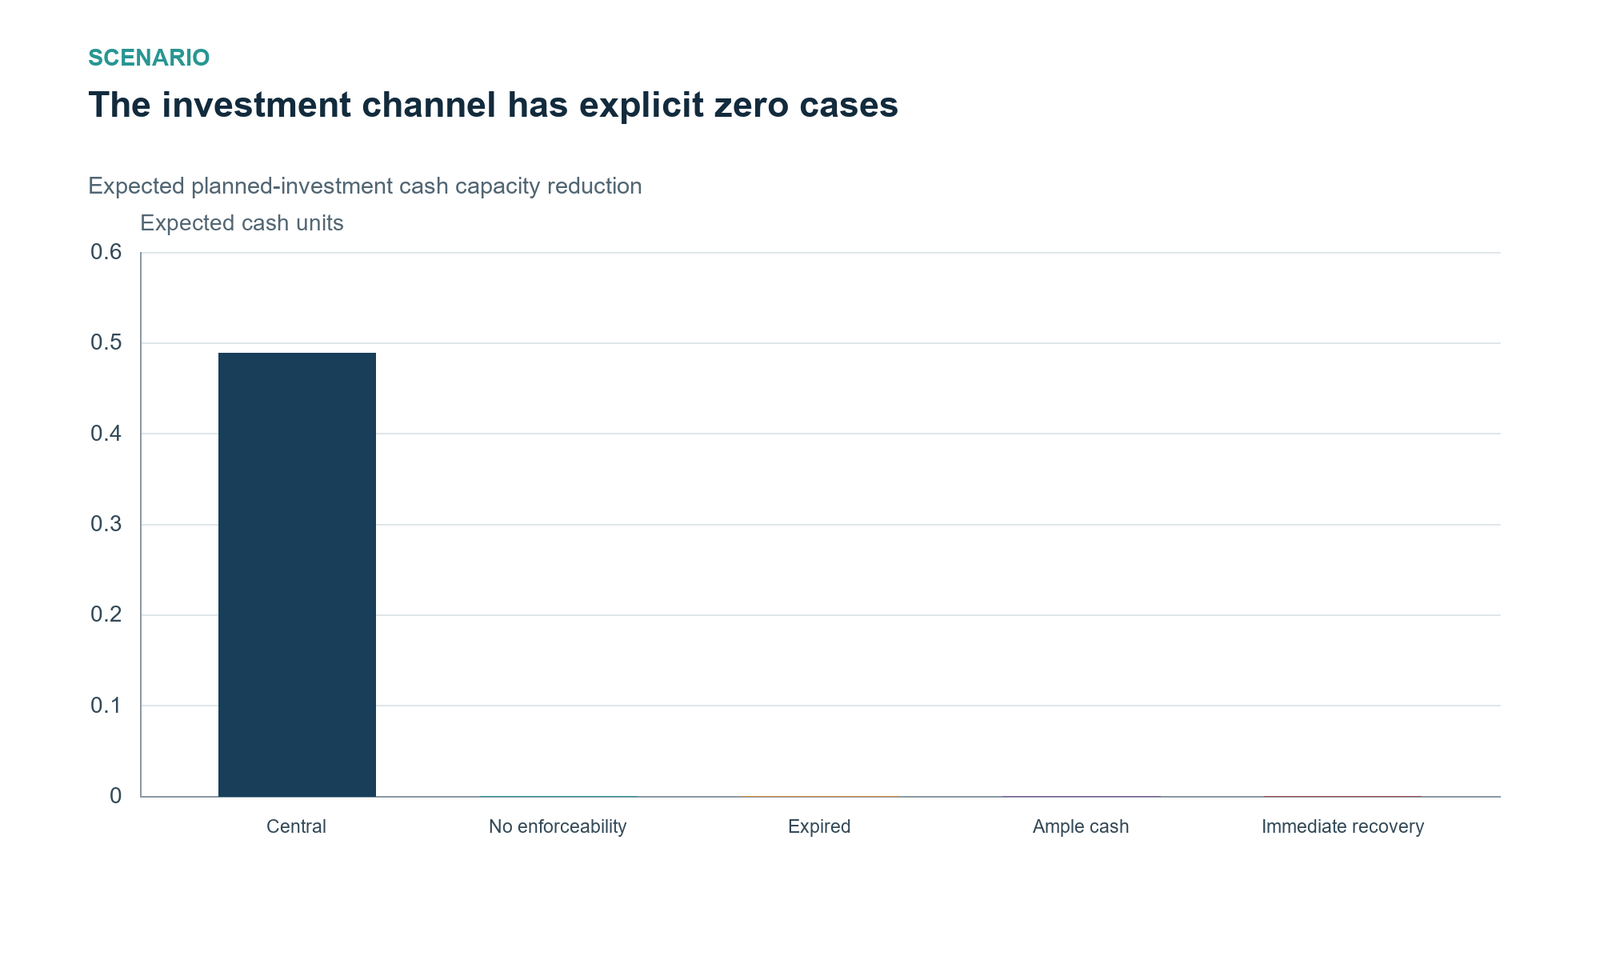
Figure 14 compares central assumptions with explicit disconfirmations. No enforceable incremental promises or promises that expire before the new trigger produce zero gross calls and zero investment funding pressure in the engine. With ample usable cash at every issuer, expected calls remain 11.75 and expected net firm contractual cash remains 4.935, but the model’s investment-capacity reduction and additional bridge are zero. Contract risk can therefore remain economically relevant without forcing the selected domestic budget response.
Immediate full collateral recovery also eliminates that pressure under the chosen balances, while leaving expected workout resource use of 0.235 units. This does not make workout cost disappear or establish that real machinery can be sold without delay. At the other extreme, the no-committed-credit case has required-bridge p 95 of 42.6 units and expected peak need 8.076365, greater than the central funding requirement. These are declared resource experiments. Their probabilities, collateral quality and finance availability are not observed frequencies, and the results are not individualized advice about a firm’s appropriate buffer or line.
A further accounting zero lies outside a claim of no actual risk: if the stated baseline map already captures the unique contractual obligations, adding another contract layer can contribute zero incremental exposure even when calls occur. That rejects the proposed addition, not the existence of ordinary sales or debt risk. Likewise, an associate, domestic beneficiary or opposite-direction recovery claim does not become an independent foreign outward obligation because the general mechanism is plausible. The public pilot’s exclusions and the synthetic zero cases serve complementary purposes: one disciplines measurement, while the other disciplines the conditional causal story.
Continue reading
Get the complete 30-page research note
The English PDF contains 15 scientific figures, 10 tables, the three-issuer accounting pilot, its unresolved source discrepancy, a fully exposed 128-state cash network, matched correlation comparisons and explicit zero-pressure cases.
29 USD, instant PDF download, secure card payment.
Buy the full noteOne-time PDF-only purchase. Information cutoff: 24 October 2026. Missing foreign identification is not zero exposure; a required bridge is not financing obtained. No national exposure or causal investment effect is estimated.
Need this analysis for your organisation?
We prepare confidential briefings, executive talks and studies on countries, markets and policies, built on the same method as this article.
Request a briefingSupport independent analysis
Our studies are free to read and carry no advertising. If this one was useful, a small contribution helps us publish the next.
Support our workGo further: books by Global Strategy Files

Books from Global Strategy Files
Go further on this topic
The Tariff GambleHow America’s trade war is reshaping power, prices and prosperity.24.99 USD, see the book Future-Proofing AmericaEconomic challenges and the road to reform.20 USD, see the book
 Kill KennedyWhat the 2025 declassified files reveal about the machinery of American power.20 USD, see the book