The Missing Buyer: Pension Funds, Term Premia and the Repricing of Britain’s Long Debt

Download PDF
Executive Summary
On 1 October 2026 the yield on Britain’s 30-year government bond crossed 6 per cent for the first time since early 1998. On 5 November the Bank of England raised Bank Rate to 4 per cent, its first increase since August 2023. Public commentary has read the two events as one story: an energy shock from the war between the United States and Iran, a new government with a fragile fiscal position, and bond investors demanding to be paid for the risk. This paper argues that this reading is incomplete, and on the most important point mistaken. The repricing of the long end of the gilt curve is not mainly a fiscal story and not mainly an inflation story. It is a story about who buys long-dated British debt, and about a buyer that has quietly left the market.
The paper rebuilds the British nominal yield curve month by month from 1997 to October 2026 using the Bank of England’s own zero-coupon estimates, and separates each long yield into two parts: the average short rate that investors expect over the life of the bond, and the term premium, the extra return they demand for holding duration risk. It then asks what moved the term premium, using a regression framework in which the data themselves are allowed to choose the dates at which the structure of the market changed. Five findings stand out.
- The 25-year term premium reached 3.18 percentage points in September 2026, its highest level since August 1997. Investors’ expectations of future short rates have barely moved: the expected average short rate over 25 years is about 2.9 per cent, close to its level in 2007. Almost the entire rise in the 25-year yield since December 2021, from 1.2 to 6.0 per cent, is premium, not expected policy.
- A search over every possible pair of dates identifies two structural breaks in the long-end term premium, without any prior assumption: November 2014 and August 2022. Between those dates, the term premium sat about 1.6 percentage points below what fundamentals would predict. This was the era of maximum liability-driven investment (LDI) by defined benefit pension schemes. The second break falls one month before the LDI crisis of September 2022. After it, the hedging discount disappears completely.
- Of the 4.2 percentage point rise in the 25-year term premium between December 2021 and September 2026, about 1.8 points are explained by the Bank of England’s quantitative tightening, 1.2 points by the rise in the US term premium, and 1.4 points by the end of the pension hedging regime. The public debt ratio, which barely changed over the period, explains almost nothing. Fiscal headlines move yields on the day, but they do not explain the level.
- The micro-structure of the market confirms the change of buyer. Before September 2022, the 30-year yield typically rose ahead of long gilt auctions and fell back afterwards, the classic pattern of a temporary concession absorbed by patient buyers. Since then the post-auction reversal has vanished: yields keep rising after supply is placed. Price-sensitive buyers now set the clearing price, and they keep it.
- The repricing has a fiscal cost that is only beginning to show. The average coupon on Britain’s conventional gilts is 3.1 per cent, against a market yield of 5.2 per cent on the same bonds. Refinancing the conventional gilts that mature between 2027 and 2036 at 5 per cent would add about 12.7 billion pounds a year to debt interest by 2030 and 22.6 billion pounds by 2036, before any new borrowing.
The policy conclusion is uncomfortable for every actor. The Bank of England’s September 2026 decision to stop selling long gilts into the market was correct and was worth about 16 basis points on the 30-year yield on the day, but the model implies that quantitative tightening has already done most of its damage. The Treasury cannot borrow its way out of the term premium by shortening issuance without accepting a large increase in the tail risk of its interest bill: each 5 percentage points of issuance moved from the long to the short end saves about 1.7 billion pounds a year in expectation by year ten, but raises the 95th percentile of the interest bill by about 5 billion pounds. Britain’s long end now needs a new natural buyer, and none is in sight.
1. Six Per Cent: A Historic Threshold
For most of the period between the financial crisis and the pandemic, the long end of the British gilt curve was the cheapest place in the developed world for a government to borrow long. In August 2016, after the referendum and the Bank of England’s second wave of asset purchases, the 25-year zero-coupon gilt yield fell to 1.37 per cent. In July 2020 it touched 0.68 per cent. A government able to lock in such rates for a generation had, on paper, one of the most comfortable debt profiles in the world: an average maturity close to 15 years, far longer than in the United States, Germany or France.
That comfort has been reversed with unusual speed. Figure 1 places the recent move in historical context. The 25-year yield rose from 1.2 per cent in December 2021 to 6.0 per cent in September 2026. The 30-year zero-coupon yield, which the Bank of England has published since 2016, reached 6.0 per cent in September 2026, a level not seen in the 30-year market rate since 1998. The move has not been confined to Britain: US 30-year Treasury yields also rose sharply. But the British move has been larger, and since 2023 British long yields have traded persistently above their US equivalents, a reversal of the relationship that held for most of the previous decade.
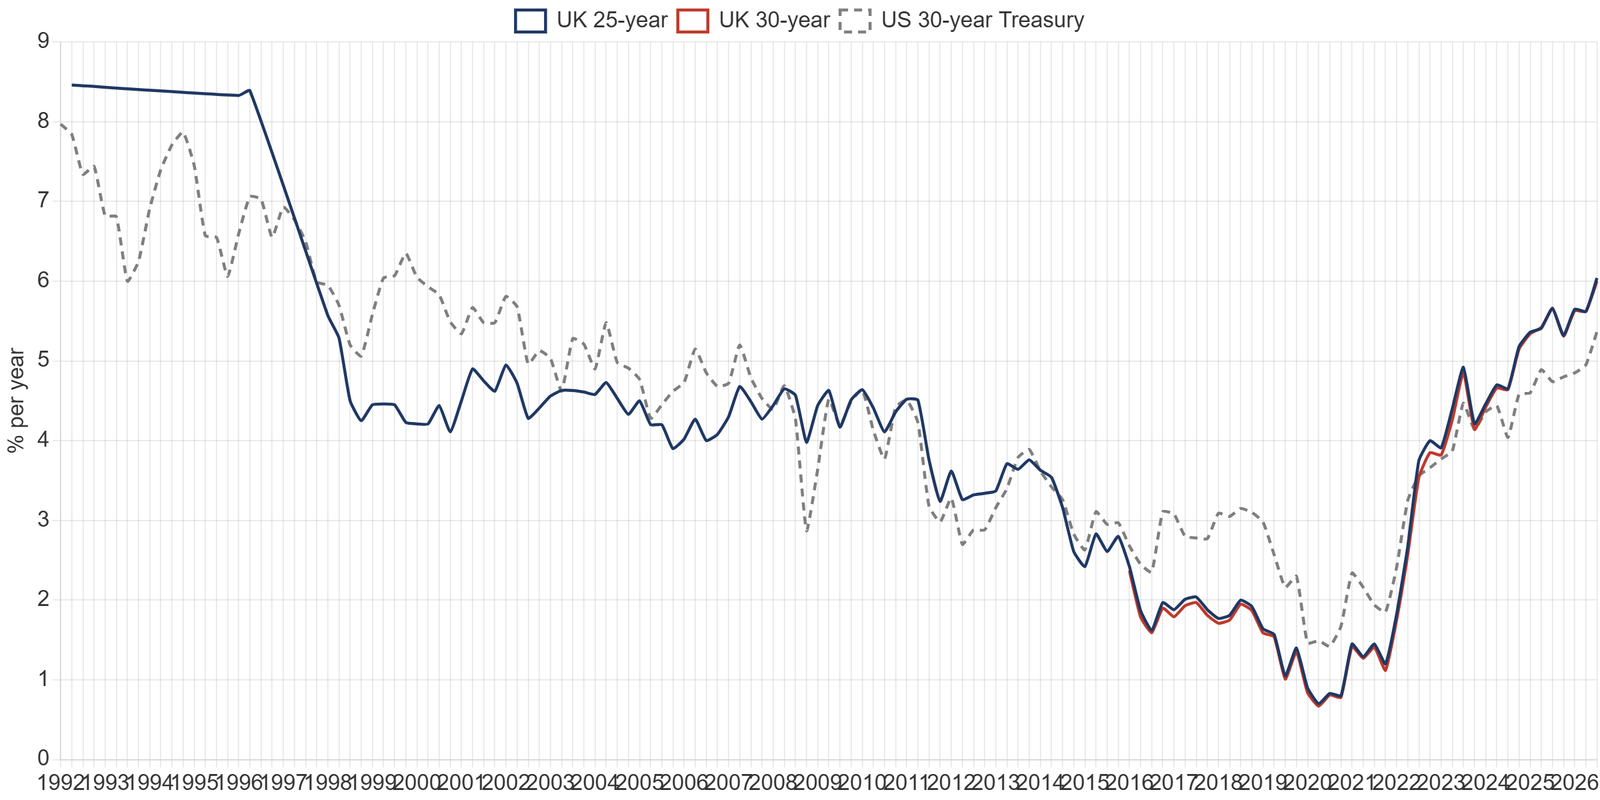
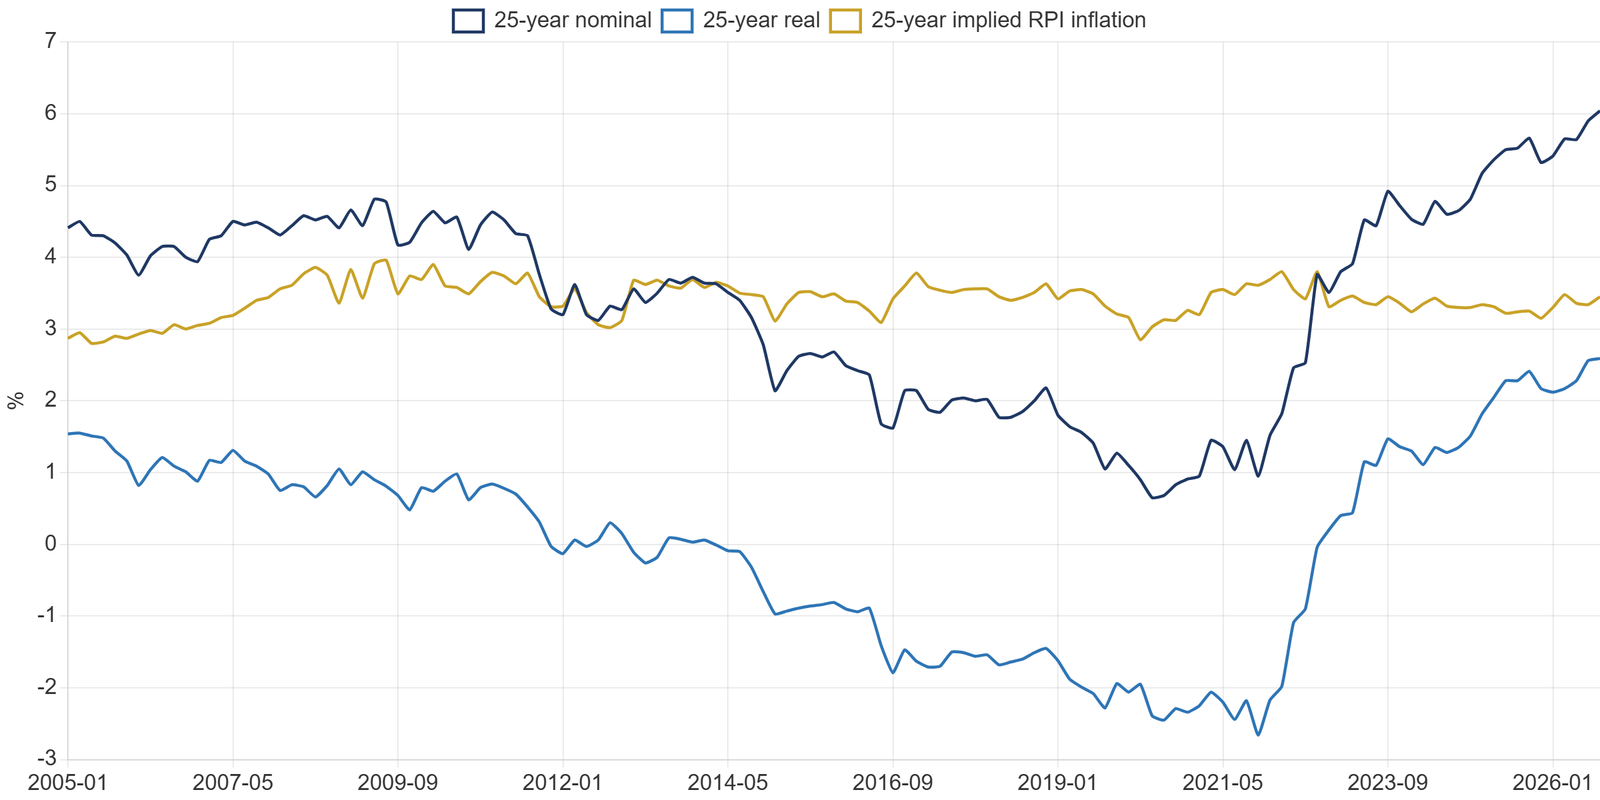
Three features of the 2026 episode make it distinctive. First, it has happened while the short end of the curve has moved much less. The 2-year yield stood at 4.7 per cent in October 2026, only modestly above Bank Rate. The curve between 10 and 30 years has steepened to levels last seen in the late 1990s. Second, the rise has occurred almost entirely in real yields, not in inflation compensation, despite an energy shock that pushed consumer price inflation from 2.9 per cent in July to 3.5 per cent in September 2026 (Figure 4). Third, the move has survived a sequence of fiscal events that, taken together, should have reassured investors: the Burnham government kept Labour’s fiscal rules, the first Healey Budget of 28 October 2026 kept about 15 billion pounds of headroom, and the public sector net debt ratio has been broadly stable at around 94 per cent of GDP since 2021.
These three facts point in the same direction. If the problem were mainly inflation risk, inflation compensation would have risen. If it were mainly fiscal, the move would track the debt ratio and the headroom, and would respond strongly to Budgets. If it were mainly monetary, the short end would lead. None of these patterns holds. What remains is the price of duration itself, and therefore the question of who is willing to hold it.
1.1 Data and approach
The analysis uses only official data published up to 6 November 2026 (Table 1). The core input is the Bank of England’s fitted nominal, real and implied inflation zero-coupon curves at month-end, from which yields at 1, 2, 3, 5, 7, 10, 15, 20, 25 and 30 years are extracted. Because the Bank of England’s estimated curve did not extend to 30 years before 2016, the long-run models use the 25-year maturity as the benchmark for the long end; the 30-year rate is used wherever the period allows. Daily curves from January 2016 support the event studies. The Debt Management Office’s complete issuance history, covering every auction, syndication and switch since 1981, and its list of gilts in issue on 6 November 2026 supply the information on supply and on the structure of the debt.
Table 1. Data used in this paper
| Series | Source | Frequency and span |
|---|---|---|
| Nominal, real and implied inflation zero-coupon curves | Bank of England | Monthly 1970 to Oct 2026; daily 2016 to 30 Oct 2026 |
| Bank Rate, SONIA, sterling effective exchange rate | Bank of England database | Monthly 1990 to Oct 2026 |
| Gilt issuance history (all operations) | UK Debt Management Office, report D2.1E | Event level, 1981 to 4 Nov 2026 |
| Gilts in issue (amounts, coupons, maturities) | UK Debt Management Office, report D1A | As at 6 Nov 2026 |
| APF gilt holdings | Bank of England market notices and APF reports | Announcement anchors, interpolated monthly |
| CPI, core CPI, public sector net debt and borrowing, nominal GDP | Office for National Statistics | Monthly and quarterly, to Sep 2026 |
| US Treasury yields, US 10-year term premium (Kim-Wright), euro area and Japanese 10-year yields | Federal Reserve Board and FRED (OECD data) | Monthly, 1990 to Oct 2026 |
Note: all calculations by the author. Zero-coupon yields are continuously compounded and differ slightly from the par yields quoted in market commentary.
2. Who Holds Britain’s Debt
The gilt market was, for most of its modern history, an unusually domestic and unusually captive market. In 1998-99, according to the Office for Budget Responsibility, insurance companies and pension funds held about two thirds of all gilts. Defined benefit pension schemes had liabilities stretching 40 or 50 years into the future, and long gilts, conventional and index-linked, were the natural asset to match them. Regulation reinforced the habit: the minimum funding requirement introduced in 1997 and the move to market-based accounting standards for pensions pushed schemes to hold assets that behaved like their liabilities. The result was a deep pool of buyers whose demand for long gilts was almost insensitive to price. When yields fell, liabilities rose, and schemes bought more duration, not less.
That structure has been dismantled in three steps. The first was the long decline of private defined benefit provision. Most schemes closed to new members in the 2000s and to future accrual in the 2010s. A closed scheme is a shrinking scheme: it pays out more than it receives, its liabilities shorten every year, and its natural end-point is a transfer to an insurer through a buy-out. The second step was the Bank of England’s quantitative easing, which between 2009 and 2021 accumulated 875 billion pounds of gilts. At its peak, the Asset Purchase Facility held about a third of the conventional gilt market. The central bank became, in effect, the price-insensitive buyer of last resort, while pension schemes, freed of the need to buy physical gilts, increasingly used leverage through repo and swaps to hedge their liabilities. The third step was the LDI crisis of September 2022, which exposed that leverage, forced schemes to sell long gilts into a falling market and led regulators to require much larger collateral buffers. Leveraged hedging has not returned on its former scale.
The ownership data published by the Debt Management Office show the outcome. At the end of September 2025, overseas investors were the largest holder group, with 33.4 per cent of the market by value, followed by insurance companies and pension funds with 21.1 per cent and the Bank of England’s Asset Purchase Facility with 18.5 per cent. The domestic pension and insurance sector, which held two thirds of the market at the turn of the century, now holds about one fifth. The Debt Management Office has drawn the logical conclusion: its 2026-27 financing remit planned only 9.1 per cent of issuance in long conventional gilts and 9.3 per cent in index-linked gilts, a reduction of 4.3 percentage points in the long conventional share compared with the previous year, explicitly because of falling demand from pension schemes.
The investors who have replaced the pension funds are of a different kind. Overseas investors include central banks and long-term insurers in Asia, but a growing share consists of hedge funds and asset managers trading relative value across markets and currencies. Monetary financial institutions hold gilts for liquidity, mostly at the short end. These buyers are price-sensitive: they will buy long gilts, but only at a price that compensates them for the risk they take, measured against alternatives in other currencies. In May 2026 Catherine Mann of the Monetary Policy Committee warned that the shift from traditional holders to price-elastic international investors could embed a persistent risk premium in gilts and amplify volatility if confidence were shaken. The rest of this paper measures how large that premium has become.
3. Decomposing the Curve
A long-term interest rate can be written as the sum of two components. The first is the average of the short-term interest rates that investors expect over the life of the bond. The second is the term premium, the additional compensation investors require for locking in money for a long period, with the risk that rates or inflation move against them. The first component reflects monetary policy expectations. The second reflects the balance between the supply of duration and the appetite to hold it.
The two components cannot be observed directly. This paper estimates them using the affine term structure model of Adrian, Crump and Moench (2013), which is the method used by the Federal Reserve Bank of New York for its published US term premium. The model extracts five common factors from the cross-section of yields between 6 months and 25 years, estimates their joint dynamics as a vector autoregression, and infers the market prices of risk from regressions of bond excess returns on those factors. The estimated model then produces, for each month, the yield that would prevail if investors were risk-neutral; the term premium is the gap between the fitted yield and that risk-neutral yield. The technical details are set out in the appendix. The model fits the curve closely: the root mean squared pricing error is under 2 basis points at maturities from 5 to 20 years and 3.2 basis points at 25 years (Table A1).
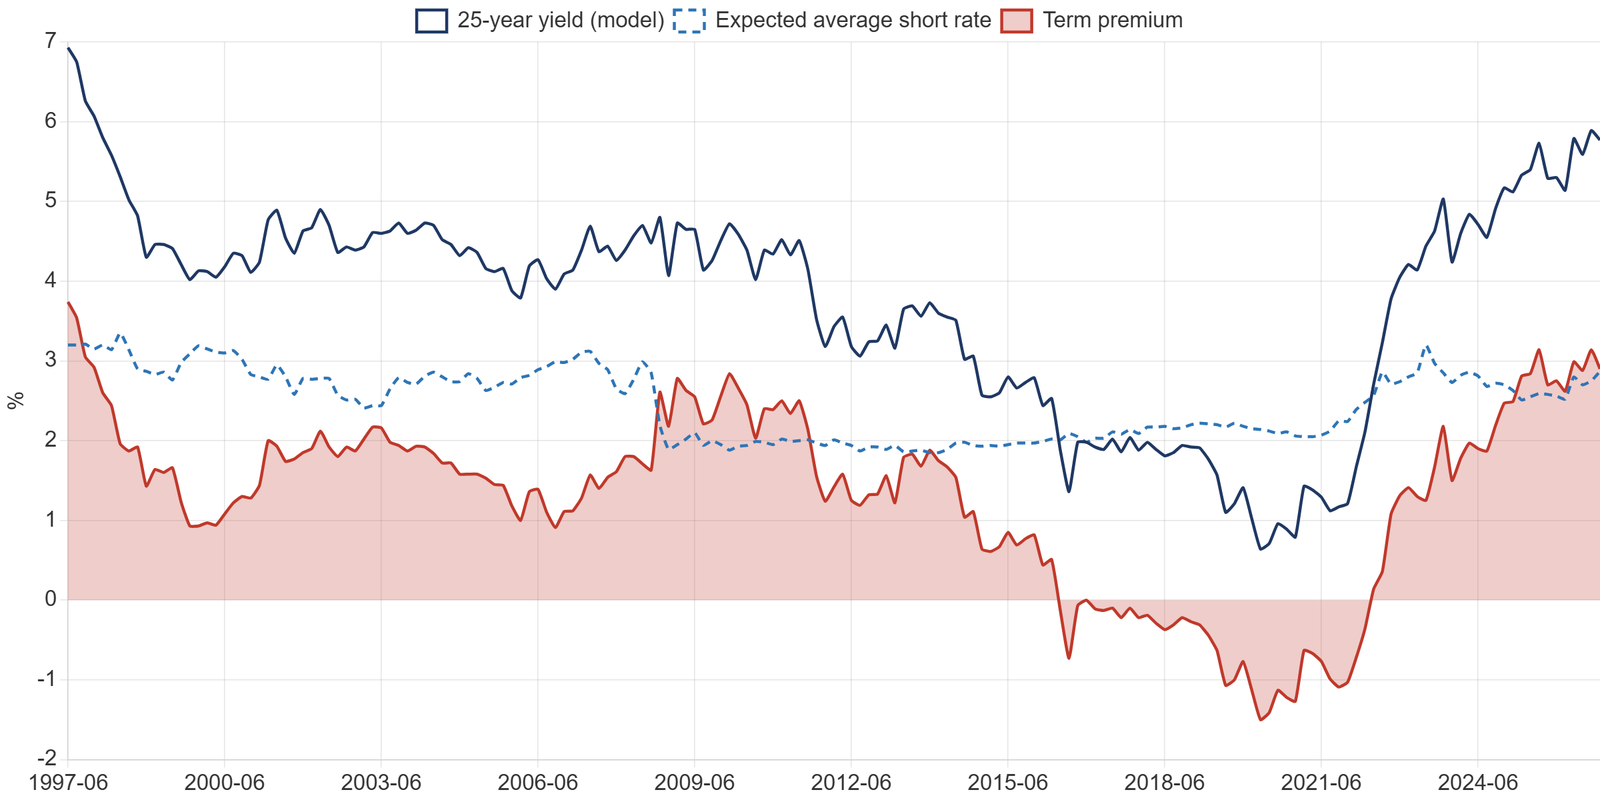
Figure 2 shows the result for the 25-year maturity. The striking feature is how little of the recent rise is attributable to expected policy rates. The risk-neutral 25-year yield, the market’s implied average short rate over the next quarter century, was 2.9 per cent in October 2026. In the first half of 2007, before the financial crisis, it was a little above 3 per cent. Investors today do not expect British interest rates to be higher on average over the long run than they expected before 2008. What has changed is the premium: 3.18 percentage points in September 2026 and 2.90 points in October, against minus 1.03 points in December 2021. The 25-year term premium is at its highest level since August 1997, the first months of Bank of England independence.
The result is robust to the specification of the model (Table A1). With three, four, five or six factors, and with the sample starting in 2003 rather than 1997, the September 2026 term premium lies between 3.1 and 3.4 percentage points, and the increase since December 2021 between 3.8 and 4.2 points.
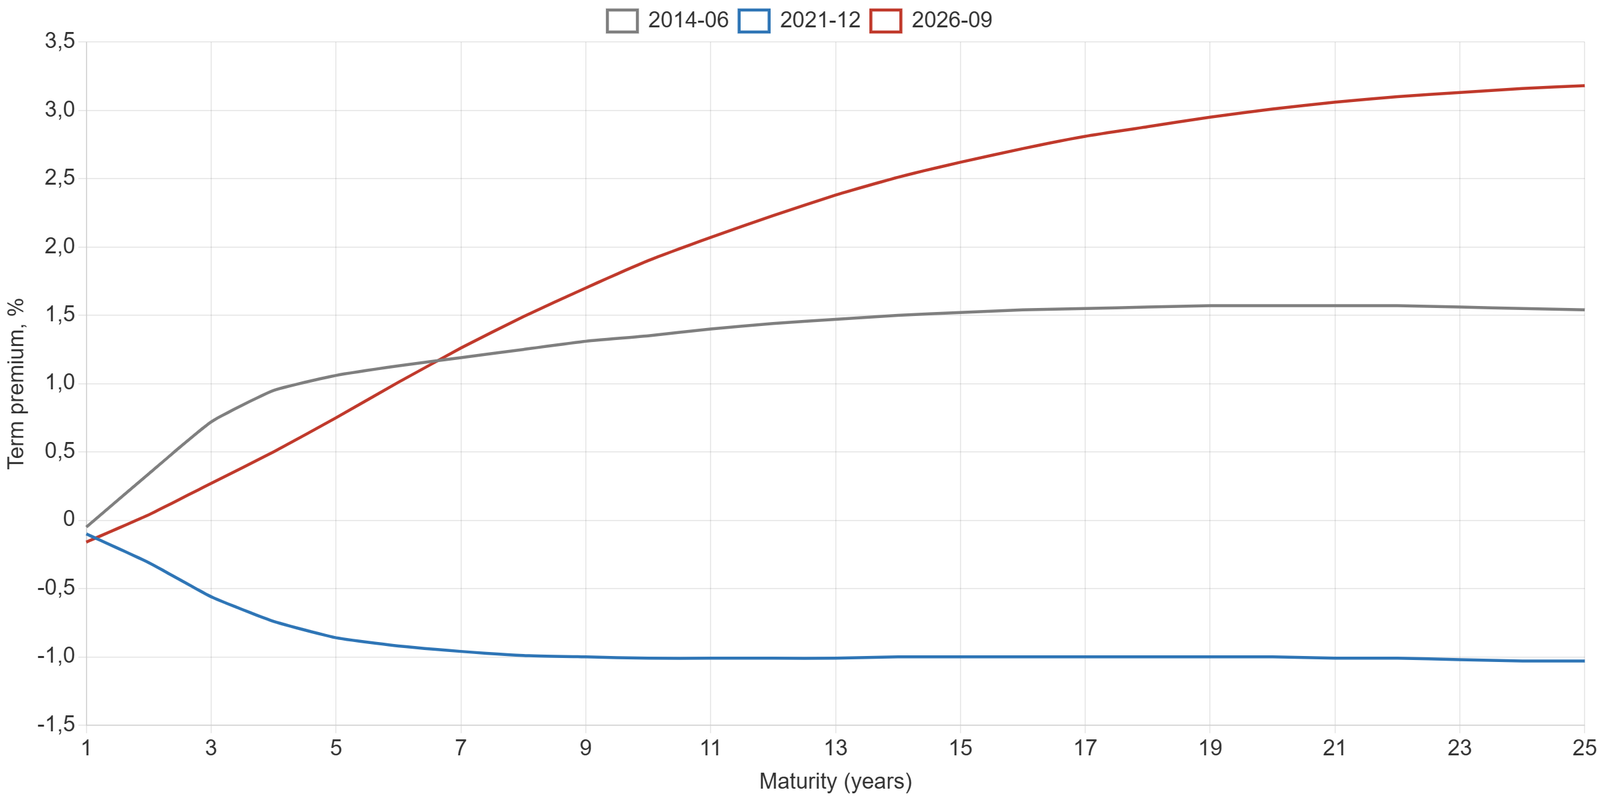
Figure 3 shows the term premium across maturities at three dates. In June 2014, before the pension hedging boom, the premium rose gently from zero at short maturities to about 1.5 points at 25 years. In December 2021 it was negative at almost every maturity beyond five years, a configuration in which investors were effectively paying the government for the privilege of lending to it for 20 years. By September 2026 the curve of term premia had become steep and high, rising from close to zero at three years to 1.9 points at 10 years and more than 3 points at 25 years. The premium is concentrated where the pension buyer used to be.
A complementary decomposition comes from the market itself. Index-linked gilts allow the nominal yield to be split into a real yield and inflation compensation. Figure 4 shows that between December 2021 and September 2026 the 25-year real yield rose from minus 2.35 per cent to plus 2.59 per cent, a rise of almost 5 percentage points, while 25-year implied RPI inflation edged down from 3.55 to 3.45 per cent. The repricing of the long end is a repricing of real duration risk, not of inflation risk. This matters for the interpretation of the 2026 energy shock: the war has raised short-term inflation and forced the Bank of England’s hand, but the long end of the market does not believe it has changed Britain’s long-run inflation outlook.
4. The Term Premium and the Missing Buyer
Why did the term premium rise by more than 4 percentage points in less than five years? The candidate explanations fall into four groups. The first is the Bank of England’s own balance sheet: quantitative easing absorbed duration and lowered term premia; quantitative tightening returns duration to the market. The second is global: British yields move with US yields, and the US term premium itself rose from below zero in 2021 to about 1 percentage point in 2026. The third is fiscal: higher debt and larger deficits require investors to hold more gilts. The fourth is the structure of demand: the disappearance of price-insensitive domestic buyers, which cannot be measured directly with a monthly series but should leave a visible trace in the relationship between the premium and its other determinants.
4.1 A model of the long-end term premium
The paper estimates a regression of the 25-year term premium on five observable drivers, using monthly data from January 2003 to October 2026: the Bank of England’s gilt holdings as a share of nominal GDP; gross issuance of long gilts (with more than 15 years to maturity at issue) over the previous twelve months as a share of GDP, calculated from the Debt Management Office’s operation-level records; the US 10-year term premium estimated by Kim and Wright at the Federal Reserve Board; public sector net debt as a share of GDP; and the realised volatility of the 10-year gilt yield. Standard errors are corrected for autocorrelation and heteroskedasticity.
The structure of demand enters through structural breaks. Rather than imposing a date, the paper searches over every possible pair of break dates, with at least 10 per cent of the sample in each regime, and retains the pair that best fits the data. A single-break search, using the Quandt likelihood ratio statistic (Figure 5), is also reported.

The data speak clearly. The single-break test peaks in the second half of 2014, with a downward shift of about 1.5 percentage points. The two-break search selects November 2014 and August 2022. Neither date was imposed; both have a direct interpretation. The second half of 2014 marks the point at which UK defined benefit schemes’ hedging programmes accelerated sharply: falling gilt yields had driven deficits to record levels, regulators and consultants pushed schemes to hedge interest rate and inflation risk, and the volume of liabilities hedged through LDI roughly doubled over the following years, much of it with leverage. August 2022 is the last month before the LDI crisis. The data, in other words, have found the rise and fall of leveraged pension hedging on their own.
Table 2. What drives the long-end term premium? Regression estimates, Jan 2003 to Oct 2026
| Explanatory variable | 25-year term premium | 10-year term premium | Slope (25y minus 10y) |
|---|---|---|---|
| Bank of England gilt holdings (% of GDP) | -0.090 (8.7) | -0.074 (7.3) | -0.016 (3.3) |
| Long gilt issuance, 12 months (% of GDP) | 0.055 (1.3) | 0.105 (2.7) | -0.050 (1.9) |
| US 10-year term premium (pp) | 1.193 (7.8) | 1.489 (11.6) | -0.296 (2.2) |
| Public sector net debt (% of GDP) | 0.052 (9.1) | 0.043 (8.7) | 0.009 (2.6) |
| Realised volatility of 10-year yield | 0.255 (1.7) | 0.248 (1.8) | 0.007 (0.1) |
| Regime Nov 2014 to Aug 2022 | -1.591 (7.3) | -1.238 (7.4) | -0.353 (2.2) |
| Regime Sep 2022 to Oct 2026 | -0.191 (0.9) | -0.759 (4.5) | 0.568 (3.1) |
| R-squared | 0.934 | 0.925 | 0.769 |
Note: absolute HAC z-statistics (12 lags) in parentheses. Regime coefficients are measured relative to January 2003 to October 2014. Break dates are chosen by minimising the sum of squared residuals over all admissible pairs.
Table 2 reports the estimates. Every observable driver has the expected sign. Each percentage point of GDP held by the Bank of England lowers the 25-year term premium by about 9 basis points, an effect consistent with the large literature on quantitative easing. A rise of one point in the US term premium raises the British 25-year premium by about 1.2 points, a sign of how tightly the gilt market is now bound to global duration pricing. Higher debt raises the premium, but modestly: about 5 basis points per point of GDP.
The two regime coefficients carry the central result. Between November 2014 and August 2022, the 25-year term premium was 1.59 points lower than fundamentals would predict, a discount that is large, precisely estimated and stable across specifications. After August 2022 the discount vanishes: the post-crisis regime is statistically indistinguishable from the period before 2014. The pension hedging boom did not merely depress the term premium; it suspended the normal pricing of long British duration for eight years. Its end has returned the market to its pre-2014 norm, at a time when the other drivers were also moving against the long end.
The slope regression adds a further nuance. The long-end slope of term premia, the extra premium on 25 years over 10 years, is 57 basis points higher after August 2022 than before 2014, even after controlling for all other drivers. The 10-year premium, by contrast, is lower than its pre-2014 norm. The market has not simply returned to its old structure. It now charges a specific premium for the longest maturities, exactly the segment the departed pension buyer used to absorb.

4.2 Accounting for the rise since 2021
The estimated model can be used to allocate the change in the term premium between December 2021 and September 2026 to its drivers (Table 3, Figure 7). The fitted change, 4.24 percentage points, almost exactly matches the actual change of 4.21 points.
Table 3. Contributions to the change in the 25-year term premium
| Driver | Dec 2021 to Sep 2026 | Dec 2019 to Sep 2026 |
|---|---|---|
| Quantitative tightening (Bank of England holdings fall from 36.0 to 15.5% of GDP) | +1.82 | +0.32 |
| US term premium spillover | +1.23 | +1.38 |
| End of the pension hedging regime | +1.40 | +1.40 |
| Public sector net debt ratio | -0.09 | +0.52 |
| Long gilt issuance | -0.15 | -0.04 |
| Realised volatility | +0.04 | +0.06 |
| Fitted change | +4.24 | +3.64 |
| Actual change | +4.21 | +3.95 |
Note: percentage points. Contributions are coefficient times change in driver, from the 25-year equation in Table 2.
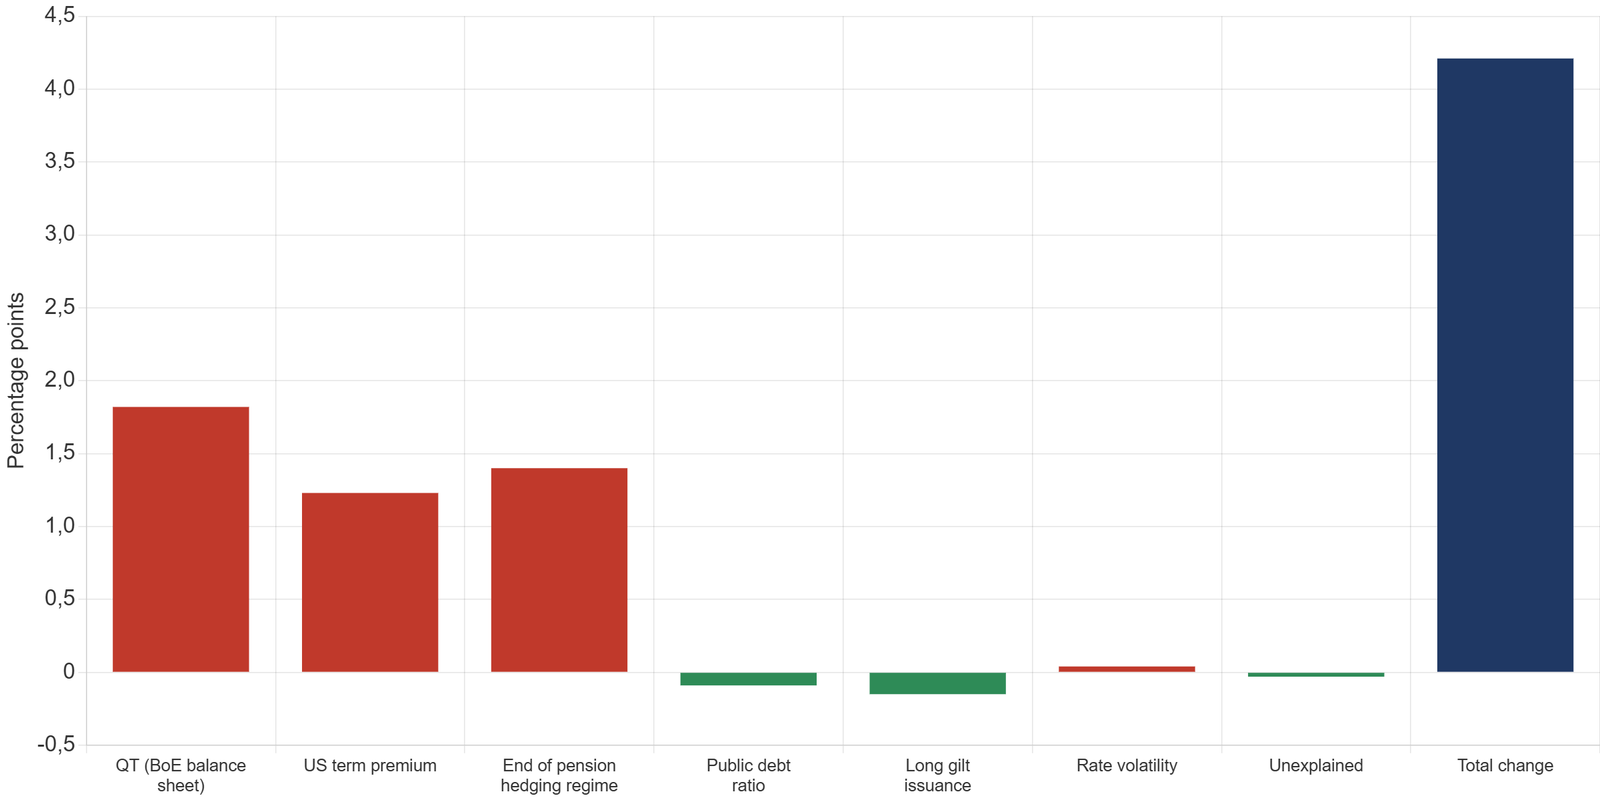
Three conclusions follow. First, the Bank of England’s balance sheet reduction is the largest single contributor, about 1.8 points. This does not mean that quantitative tightening was a mistake: the purpose of reversing asset purchases was precisely to withdraw the support they had provided. But it does mean that the decision taken in 2022 to sell gilts actively, unique among major central banks, has been one of the main determinants of the British government’s borrowing costs. Second, global forces account for more than a quarter of the move: about 1.2 points come from the rise in the US term premium. Third, the end of the pension hedging regime accounts for 1.4 points, a third of the total. Together, the domestic loss of a natural buyer and the withdrawal of the central bank as buyer of last resort explain three quarters of the rise.
The public debt ratio, by contrast, explains essentially nothing of the change since 2021, because the ratio barely moved: 95.8 per cent of GDP in December 2021 and 94.0 per cent in September 2026. Over the longer period from December 2019, which includes the pandemic increase in debt, the debt ratio contributes about half a point. Fiscal policy has mattered for the level of the premium over the past two decades, but it is not what changed after 2021. This is the finding most at odds with the public narrative of 2025 and 2026, which has attributed every move in the long end to the Chancellor’s choices.
5. Breaks, Auctions and International Comparisons
5.1 What moves the long end on the day
If the level of the term premium is set by the structure of demand, why do fiscal events seem to move gilts so much? Daily data help to separate the immediate reaction from the underlying level. Table 4 and Figure 8 report the one-day change in the 2-year and 30-year zero-coupon yields around eight events since 2022.
Table 4. One-day yield changes around eight events (basis points)
| Event | Date | 2-year | 10-year | 30-year | 30y minus 10y | 30-year, 3 days | 30-year, z-score |
|---|---|---|---|---|---|---|---|
| Mini-budget (Truss and Kwarteng) | 23 Sep 2022 | +45.3 | +29.1 | +22.4 | -6.7 | +112.8 | 3.8 |
| Bank of England long-gilt intervention | 28 Sep 2022 | -25.1 | -38.2 | -112.8 | -74.6 | -130.9 | -19.2 |
| Reeves drops income tax rise | 14 Nov 2025 | +7.9 | +13.1 | +17.2 | +4.1 | +15.1 | 2.9 |
| Reeves Budget | 26 Nov 2025 | -3.1 | -6.0 | -10.8 | -4.8 | -14.4 | -1.8 |
| US strike on Iran, first trading day | 2 Mar 2026 | +10.4 | +6.1 | +5.5 | -0.5 | +12.8 | 0.9 |
| Healey appointed Chancellor | 20 Jul 2026 | +5.7 | +8.0 | +8.8 | +0.8 | +7.5 | 1.5 |
| Bank of England QT overhaul | 17 Sep 2026 | -1.2 | -8.0 | -15.9 | -7.9 | -21.2 | -2.7 |
| Healey Budget | 28 Oct 2026 | +3.2 | +0.3 | -1.6 | -1.9 | -2.0 | -0.3 |
Note: changes in Bank of England zero-coupon yields from previous business day. The z-score divides the one-day change in the 30-year yield by its standard deviation over 2016 to 2026 (5.9 basis points). The 3-day change runs from the day before the event to two days after.
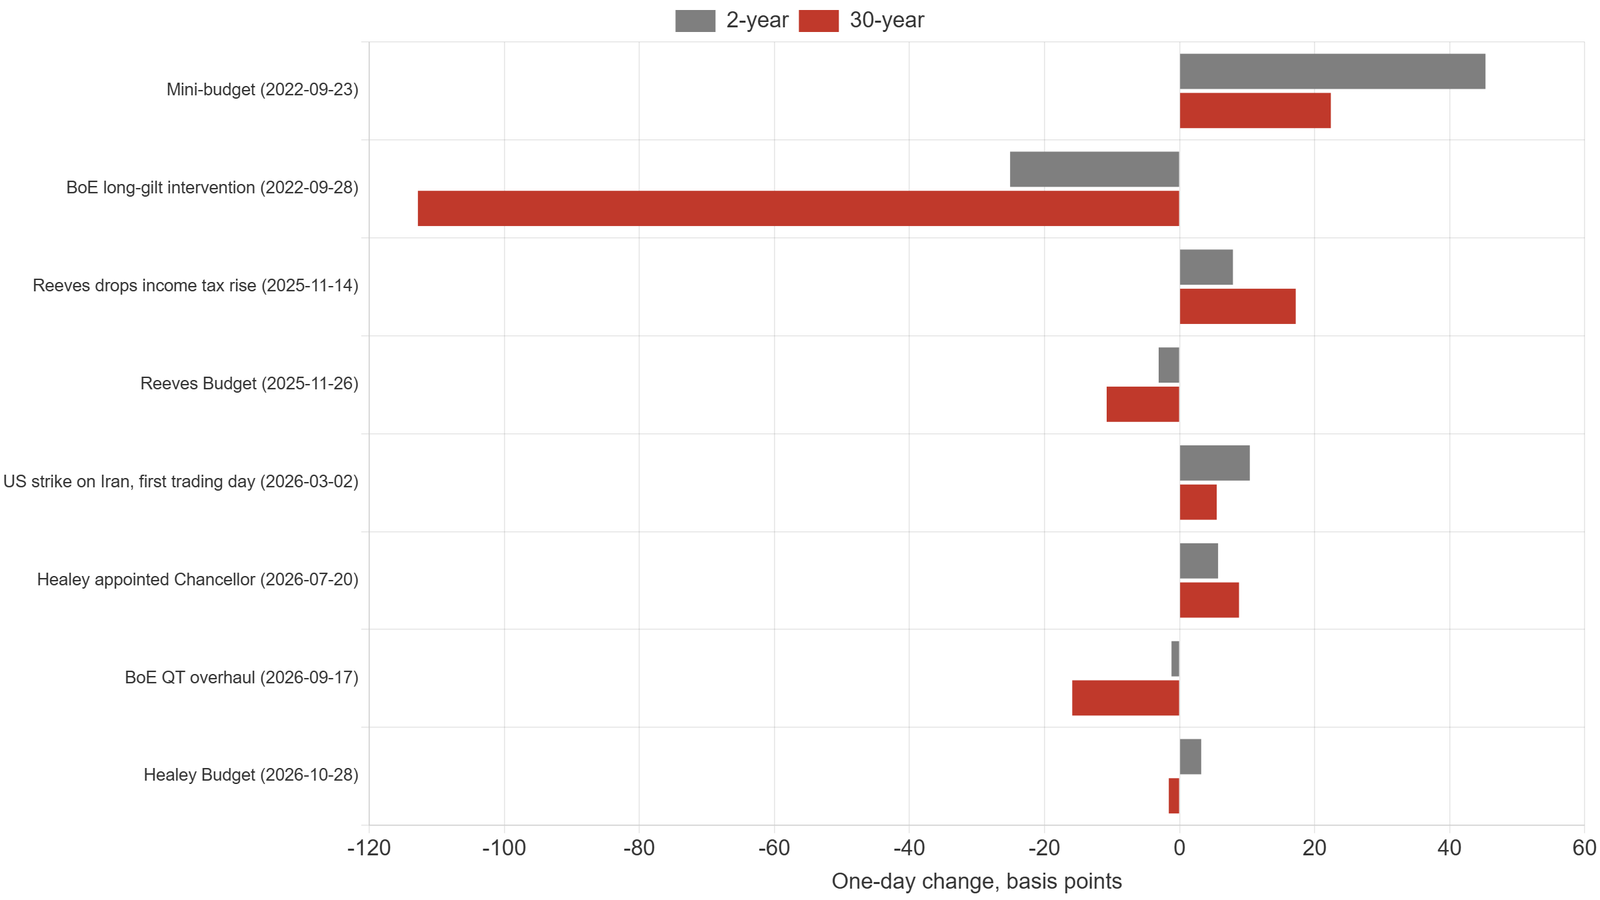
The pattern is instructive. The largest long-end moves are associated not with fiscal decisions but with changes in who buys and sells long gilts. On 28 September 2022 the Bank of England’s announcement that it would buy long gilts to stop the LDI spiral lowered the 30-year yield by 113 basis points in a day, more than 19 standard deviations, while the 2-year yield fell by a quarter of that. On 17 September 2026, when the Bank announced that it would stop selling long gilts into the market, keep 120 billion pounds of the longest gilts to back the banknote issue and route its remaining sales of gilts maturing between 2035 and 2049 to the Debt Management Office rather than to private investors, the 30-year yield fell by 16 basis points and the 2-year yield by 1 basis point. A pure change in the composition of supply, with no change in policy rates and no fiscal news, produced a move of 2.7 standard deviations, concentrated at the long end.
Fiscal events matter, but on a smaller scale and with a different signature. The reports on 14 November 2025 that Rachel Reeves had dropped a planned income tax rise raised long yields by 17 basis points, an expression of doubt about fiscal credibility. Healey’s appointment in July 2026 added about 9 basis points. His first Budget left long yields essentially unchanged. The Iran shock, the dominant macroeconomic event of 2026, moved the short end more than the long end, as one would expect from a shock that changes the path of Bank Rate but not the long-run demand for duration.
5.2 The auction test
A second test uses the behaviour of yields around gilt auctions. When a large amount of long-dated supply is sold on a known date, dealers and investors typically demand a temporary concession: yields rise in the days before the operation and fall back afterwards, once patient buyers have absorbed the new stock. The size and persistence of this pattern reveals who the marginal buyer is. If the market is dominated by investors with a structural need for duration, the concession should be small and should reverse. If it is dominated by price-sensitive investors with alternatives, the concession should persist, because the new supply has to be absorbed at a permanently higher yield.
The paper identifies all 207 long conventional gilt auctions and syndications between January 2016 and October 2026 in the Debt Management Office’s records, and measures the change in the 30-year zero-coupon yield from four days before each operation to two days after.

Table 5. The 30-year yield around long gilt operations (average change, basis points)
| Window | 2016 to Aug 2022 | Sep 2022 to Oct 2026 | Difference (t-statistic) |
|---|---|---|---|
| Three days before (t-4 to t-1) | +1.29 | -0.42 | -0.9 (0.7) |
| Operation day | +0.15 | +0.56 | +0.9 (0.8) |
| Two days after (t to t+2) | -0.38 | +0.57 | +1.8 (1.6) |
| Curve slope 30y-10y, two days after | -0.40 | +0.35 | +1.2 (2.2) |
| Number of operations | 130 | 77 |
Note: differences and t-statistics from regressions of each window on a post-August 2022 dummy and operation size, with heteroskedasticity-robust standard errors.
The results are statistically modest, as daily event studies often are, but the pattern is consistent with the regime evidence. Before September 2022, the 30-year yield rose by about 1.3 basis points in the three days before a long operation and partly reversed afterwards. Since September 2022, the pre-auction concession has disappeared and has been replaced by a post-auction drift upwards: yields keep rising after the new supply has been placed, and the 30-10 slope steepens by about 0.35 basis points over the following two days rather than flattening. The difference in post-auction slope behaviour is significant at the 5 per cent level. In the old market, patient buyers took the supply off dealers’ hands and the price recovered. In the new market, nobody is waiting on the other side.
5.3 Britain against its peers

International comparison confirms that the British long end carries a specific premium. Between 2015 and 2021 the UK 30-year yield was typically 0.5 to 1.5 points below its US equivalent. Since 2023 the gap has closed and turned positive: in September 2026 the UK 30-year zero-coupon yield stood about 0.6 points above the US 30-year Treasury. At the 10-year maturity, the UK now yields more than every other G7 economy covered in the data, including Italy, whose debt ratio is about 40 points of GDP higher. A fiscal explanation cannot account for a premium over Italy. A structural explanation, a market that lost its domestic anchor faster than any other, can.
Rolling regressions over 72-month windows show that the sensitivity of the British term premium to the US term premium has itself been unstable, peaking above 3 in the window ending in December 2024. Without a large domestic buyer, gilts trade more and more as a high-beta version of global duration. When global term premia rise, the British premium rises faster.
6. Refinancing Risk for the State
The term premium is not an abstraction for the Treasury. It is the price at which the state must refinance its existing debt and finance its new deficits. The British debt profile has two features that delay the impact of higher yields, and one that will eventually amplify it.
The delaying features are the long average maturity of the gilt stock and the low coupons inherited from the era of cheap money. On 6 November 2026, the stock of gilts in issue amounted to 2,933 billion pounds including the inflation uplift on index-linked gilts, with an average remaining maturity of 13.3 years. The weighted average coupon on the 2,216 billion pounds of conventional gilts was 3.1 per cent, and 785 billion pounds, 35 per cent of conventional nominal value, carried coupons below 2 per cent. The market yield on the same bonds, taking each gilt’s maturity on the October 2026 zero-coupon curve, averaged 5.2 per cent. The gap of about 2 percentage points between what the state pays and what it would pay today is the measure of the repricing still to come.
Table 6. The repricing clock: conventional gilts maturing 2027 to 2036
| Year | Maturing (GBP bn) | Average coupon (%) | Extra annual interest if refinanced at 5% (GBP bn) | Cumulative extra (GBP bn per year) |
|---|---|---|---|---|
| 2027 | 145.5 | 3.23 | 2.6 | 2.6 |
| 2028 | 184.2 | 3.03 | 3.6 | 6.2 |
| 2029 | 158.3 | 2.41 | 4.1 | 10.3 |
| 2030 | 143.4 | 3.33 | 2.4 | 12.7 |
| 2031 | 119.4 | 2.67 | 2.8 | 15.5 |
| 2032 | 98.2 | 3.09 | 1.9 | 17.4 |
| 2033 | 104.6 | 2.60 | 2.5 | 19.9 |
| 2034 | 108.5 | 4.45 | 0.6 | 20.5 |
| 2035 | 118.2 | 3.42 | 1.9 | 22.3 |
| 2036 | 74.9 | 4.60 | 0.3 | 22.6 |
Source: Debt Management Office gilts in issue at 6 November 2026; author’s calculations. Excludes index-linked gilts, Treasury bills and new borrowing.

Table 6 shows how quickly the gap closes. Between 2027 and 2030, 631 billion pounds of conventional gilts mature, with an average coupon of about 3 per cent. Refinancing them at 5 per cent, close to the current 10-year rate, would add 12.7 billion pounds a year to debt interest by 2030. By 2036 the cumulative addition reaches 22.6 billion pounds a year, roughly the size of the fiscal headroom against the government’s rules multiplied by one and a half. These figures exclude new borrowing, which in 2026-27 is forecast at about 115 billion pounds, and the index-linked stock, whose cost already rises with inflation.
The amplifying feature is the APF loss. When the Bank of England sells or redeems gilts that it bought at higher prices, the losses are indemnified by the Treasury. Rising long yields increase those losses for every gilt sold before maturity. The Bank’s September 2026 decision to hold 342 billion pounds of its remaining 488 billion pounds to maturity, and to transfer the rest to the Debt Management Office rather than to the market, reduces the realised loss but does not change the economic cost to the public sector as a whole.
6.1 Scenarios to the end of 2027
The regression model can be used to trace the term premium under alternative assumptions for its drivers to the end of 2027 (Table 7). Changes are measured against the model’s fitted value for October 2026, 3.35 points. It is worth noting that the actual 25-year term premium in October, 2.90 points, was about 45 basis points below that fitted value: after the Bank’s September decision and an uneventful Budget, the market has already priced some relief.
Table 7. The 25-year term premium at the end of 2027: four scenarios
| Scenario | Bank of England holdings (% of GDP) | US term premium (pp) | Term premium end-2027 (pp) | Change from Oct 2026 fit (pp) |
|---|---|---|---|---|
| A. Plan as announced: sales routed to the DMO | 14.0 | 0.96 | 3.57 | +0.22 |
| B. Market sales resume at 46 billion pounds a year | 13.0 | 0.96 | 3.65 | +0.31 |
| C. Benign: US term premium normalises to 0.4 | 14.0 | 0.40 | 2.87 | -0.47 |
| D. Adverse: US premium 1.6, volatility rises | 13.0 | 1.60 | 4.59 | +1.24 |
Note: all scenarios assume nominal GDP of 3.3 trillion pounds at end-2027, debt at 95 to 97 per cent of GDP and the post-2022 demand regime. Standard error of the regression: 0.31 points.
The scenarios carry two messages. Domestic choices now have a limited effect at the margin: whether the Bank sells its remaining long gilts to the market or to the government changes the end-2027 premium by less than 10 basis points, because most of the balance sheet effect has already happened. The dominant risk is external. A further rise in the US term premium to 1.6 points, combined with higher volatility, would add more than a percentage point to the British long-end premium, taking the 25-year yield well above 6.5 per cent if expected short rates were unchanged. Without its own natural buyer, Britain imports global duration risk with leverage.
7. What the Debt Management Office Can and Cannot Do
The obvious response to an expensive long end is to stop issuing there. The Debt Management Office has already moved in this direction, and it has a clear economic rationale. The term structure of term premia in Figure 3 implies that, in October 2026, the premium on a 3-year gilt was about 0.2 points while that on a 25-year gilt was about 2.9 points. In expectation, financing with short gilts and rolling them over is roughly 2.7 points a year cheaper than locking in long money, if the model’s estimate of expected rates is correct.
But the saving is not free. Short debt must be refinanced often, and its cost follows the path of interest rates. To measure the trade-off, the paper simulates ten years of conventional issuance of 300 billion pounds a year under different maturity mixes, holding medium-dated issuance at 30 per cent and varying the split between 25-year and 3-year gilts. The 3-year yield follows 20,000 block-bootstrapped paths built from its own monthly history since 1997, with the historical trend removed so that the simulation does not assume rates will fall. The output is the distribution of the annual interest cost of the new debt in year ten.
Table 8. The cost-risk frontier for gilt issuance (interest on ten years of new issuance, year ten, GBP bn)
| Long share of issuance | Expected cost | 95th percentile | 5th percentile | Standard deviation |
|---|---|---|---|---|
| 5% | 147.0 | 237.9 | 62.2 | 53.1 |
| 10% | 148.7 | 232.6 | 70.4 | 49.0 |
| 15% | 150.4 | 227.3 | 78.6 | 44.9 |
| 20% | 152.1 | 222.0 | 86.8 | 40.9 |
| 25% | 153.8 | 216.7 | 95.0 | 36.8 |
| 30% | 155.5 | 211.4 | 103.3 | 32.7 |
| 35% | 157.2 | 206.1 | 111.5 | 28.6 |
| 40% | 158.9 | 200.8 | 119.7 | 24.5 |
Note: medium-dated issuance fixed at 30 per cent; short issuance is the remainder. Long gilts priced at the October 2026 25-year yield (5.79 per cent), medium at the 10-year yield (5.28 per cent).

Table 8 and Figure 12 show the frontier. Moving from 40 per cent to 5 per cent long issuance lowers the expected interest bill in year ten from 159 to 147 billion pounds, a saving of about 1.7 billion pounds for each 5 points of issuance shifted. But it raises the 95th percentile of the bill from 201 to 238 billion pounds: each 5 points shifted adds about 5 billion pounds to the tail. The government saves in expectation by taking interest rate risk onto its own balance sheet, and that risk is roughly three times larger than the saving.
This trade-off defines the real choice facing the Treasury. Shortening issuance is a way of refusing to pay the term premium. It makes sense if the premium is temporary, a product of transitional factors such as quantitative tightening and the aftermath of the LDI crisis. It is dangerous if the premium is structural, because the state would then accumulate refinancing risk in order to avoid a price that will not fall. The evidence in this paper suggests that the premium is largely structural. The pension hedging regime that kept it artificially low has ended for good, as schemes move to buy-out and as regulators keep leverage in check. Quantitative tightening has done most of its work. What remains is the pricing of long British duration by investors who have alternatives.
Three implications follow, and none of them is a simple recommendation. First, the priority is to rebuild a domestic base of duration demand rather than to avoid issuing duration. The most promising source is the defined contribution pension system and the consolidated public sector schemes, which will hold growing assets over the coming decades but currently hold few gilts. Any policy that encourages them to hold long gilts at the margin, whether through default fund design or through new instruments, would reduce the premium more durably than any change in issuance. Second, index-linked issuance deserves reconsideration. Real yields have risen by almost 5 points since 2021, while implied inflation has fallen; the state now pays a high real price for index-linked debt, which also exposes it to the inflation shocks of the kind seen in 2026. Third, the coordination between the Bank of England and the Debt Management Office established in September 2026, through which the Bank’s long gilts will be absorbed by the government rather than sold to the market, should be understood for what it is: an admission that the market can no longer absorb long duration at an acceptable price without help. It buys time, but it does not create a buyer.
Conclusion
The 30-year gilt yield at 6 per cent is not, at heart, a verdict on the Burnham government or on Healey’s Budget. It is the price of long British duration in a market that has lost two of its three historical anchors in less than five years: the central bank as buyer of last resort, and the leveraged pension fund as buyer of necessity. Using only official data, this paper has shown that the long-end term premium is at its highest level since 1997, that its rise owes little to the public debt ratio and almost nothing to inflation compensation, and that the data identify, without prompting, the beginning and the end of the pension hedging era as the two decisive breaks in its behaviour.
The implication for the coming years is sobering. The premium that Britain pays on long money is now set by global, price-sensitive investors who compare gilts with Treasuries, Bunds and JGBs every day. It will rise when the global price of duration rises, and it will not return to the levels of the 2010s unless a new domestic buyer emerges. Monetary policy cannot provide one without abandoning quantitative tightening. Fiscal discipline is necessary but not sufficient. The question that matters for Britain’s borrowing costs over the next decade is no longer how much the state borrows, but who will lend to it for thirty years, and at what price.
Methodological Appendix
A1. Term structure model
Let y(t,n) denote the continuously compounded zero-coupon yield at month t for maturity n months. Yields for all maturities from 1 to 300 months are obtained by monotone cubic (PCHIP) interpolation of the Bank of England fitted curve at 1, 2, 3, 5, 7, 10, 15, 20 and 25 years, with the one-month rate proxied by Bank Rate. Five pricing factors X(t) are the first five principal components of yields at 6-month intervals from 6 to 300 months, which together explain 99.99 per cent of the variance. Their dynamics follow X(t+1) = mu + Phi X(t) + v(t+1), with covariance Sigma; the largest eigenvalue of Phi is 0.978.
Log excess returns on bonds of maturity n, rx(t+1,n-1) = log P(t+1,n-1) – log P(t,n) – r(t), are computed for 16 maturities between 12 and 300 months and regressed on a constant, the factor innovations v(t+1) and the lagged factors X(t). Following Adrian, Crump and Moench (2013), the market prices of risk lambda0 and lambda1 are recovered from the cross-section of these regression coefficients, and the short rate is regressed on the factors to obtain delta0 and delta1. Bond prices satisfy the affine recursions A(n+1) = A(n) + B(n)'(mu – lambda0) + 0.5(B(n)’ Sigma B(n) + s2) – delta0 and B(n+1)’ = B(n)'(Phi – lambda1) – delta1′. Setting lambda0 = 0 and lambda1 = 0 yields the risk-neutral curve; the term premium is the difference between fitted and risk-neutral yields.
Table A1. Fit and robustness of the term structure model
| Specification | TP25 Jun 2014 | TP25 Dec 2021 | TP25 Sep 2026 | Change Dec 2021 to Sep 2026 | Pricing error at 25 years (bp) |
|---|---|---|---|---|---|
| 3 factors, 1997 to 2026 | 2.11 | -0.51 | 3.43 | +3.94 | 7.9 |
| 4 factors, 1997 to 2026 | 1.87 | -0.58 | 3.23 | +3.81 | 4.0 |
| 5 factors, 1997 to 2026 (baseline) | 1.54 | -1.03 | 3.18 | +4.21 | 3.2 |
| 6 factors, 1997 to 2026 | 1.44 | -1.03 | 3.08 | +4.11 | 1.7 |
| 5 factors, 2003 to 2026 | 1.56 | -1.15 | 3.29 | +4.44 |
Note: term premium in percentage points. Baseline root mean squared pricing errors: 11.1 bp at 1 year, 1.8 bp at 5 and 10 years, 1.9 bp at 15 and 20 years.
A2. Driver regressions and break tests
The baseline equation is TP25(t) = a + b1 APF(t) + b2 LONG(t) + b3 USTP(t) + b4 DEBT(t) + b5 VOL(t) + c1 D1(t) + c2 D2(t) + e(t), where APF is the Bank of England’s gilt holdings in purchase-proceeds terms as a share of annualised nominal GDP, constructed from announced purchase and sale programmes and anchored to published holdings (875 billion pounds at end-2021, 558 billion pounds at September 2025, 524.9 billion pounds at end-April 2026 and 488 billion pounds at September 2026); LONG is gross issuance over twelve months of gilts with more than 15 years to maturity at the operation date, from the DMO D2.1E records; USTP is the Kim-Wright US 10-year term premium; DEBT is public sector net debt excluding public sector banks; VOL is the annualised standard deviation of monthly changes in the 10-year gilt yield over twelve months. D1 and D2 are regime dummies. The break dates (T1, T2) minimise the residual sum of squares over all pairs with at least 10 per cent of the sample in each segment. The single-break statistic in Figure 5 is the F statistic for an intercept shift at each date, with 15 per cent trimming. Standard errors use the Newey-West correction with 12 lags. In levels without regime dummies, the same five drivers explain 76 per cent of the variance; the mean residual is minus 0.56 points between July 2016 and August 2022 and plus 0.40 to 0.45 points after September 2022.
A3. Auction and event studies
Long operations are DMO outright auctions and syndications of conventional gilts with more than 15 years to maturity on the operation date, January 2016 to October 2026 (207 operations with complete data). Yield changes use the Bank of England daily 30-year and 10-year zero-coupon yields. Windows are measured in business days relative to the operation date. Regressions of each window on a dummy for operations after August 2022 and on operation size (nominal, billion pounds) use heteroskedasticity-robust standard errors.
A4. Frontier simulation
Annual conventional gross issuance is 300 billion pounds for ten years. Long issuance is priced at the October 2026 25-year zero-coupon yield and medium issuance at the 10-year yield; both are held to the horizon. Short issuance consists of 3-year gilts that are refinanced every three years at the simulated 3-year yield. The 3-year yield path is built from 12-month blocks of historical monthly changes, June 1997 to October 2026, demeaned to remove the historical downward trend, starting from the October 2026 level of 4.77 per cent. The frontier reports moments of the interest cost in year ten across 20,000 simulations. The exercise is deliberately simple: it ignores the interaction between issuance choices and the term premium itself, which would reinforce the conclusions if long issuance raises the long-end premium, as Table 2 suggests at the 10-year maturity.
A5. Limitations
Term premia are model-based estimates, not observed prices; different models produce different levels, although the direction and approximate size of the 2021 to 2026 change is robust across the specifications tested here. The Bank of England holdings series is interpolated between published anchors. The regression model is a reduced form: the drivers are not exogenous, and the regime dummies capture all changes in the structure of demand, not only pension hedging. The interpretation of the break dates relies on their coincidence with documented events. The auction results are statistically weak taken alone and are presented as corroborating rather than decisive evidence.
References
Adrian, T., Crump, R. K. and Moench, E. (2013), Pricing the term structure with linear regressions, Journal of Financial Economics, 110(1), 110-138.
Andrews, D. W. K. (1993), Tests for parameter instability and structural change with unknown change point, Econometrica, 61(4), 821-856.
Bai, J. and Perron, P. (2003), Computation and analysis of multiple structural change models, Journal of Applied Econometrics, 18(1), 1-22.
Bank of England (2026), Asset Purchase Facility: Gilt Sales, Market Notice, 17 September 2026.
Bank of England (2026), Monetary Policy Summary, November 2026.
Bank of England, Yield curve data: nominal, real and implied inflation zero-coupon curves, accessed November 2026.
Diebold, F. X. and Li, C. (2006), Forecasting the term structure of government bond yields, Journal of Econometrics, 130(2), 337-364.
Greenwood, R. and Vayanos, D. (2014), Bond supply and excess bond returns, Review of Financial Studies, 27(3), 663-713.
HM Treasury and UK Debt Management Office (2026), Debt Management Report 2026-27, March 2026.
Kim, D. H. and Wright, J. H. (2005), An arbitrage-free three-factor term structure model and the recent behavior of long-term yields and distant-horizon forward rates, Federal Reserve Board Finance and Economics Discussion Series 2005-33.
Office for Budget Responsibility (2026), Economic and fiscal outlook, October 2026.
Office for National Statistics (2026), Public sector finances and Consumer price inflation, September 2026 releases.
UK Debt Management Office, Gilt issuance history (D2.1E) and Gilts in issue (D1A), accessed 6 November 2026.
Vayanos, D. and Vila, J.-L. (2021), A preferred-habitat model of the term structure of interest rates, Econometrica, 89(1), 77-112.
Driss EFFINA, PhD
Independent Researcher, Global Strategy Files
The opening pages of our four country reports: United States, United Kingdom, Japan and China. A free PDF, sent to your inbox.
You will also receive occasional analysis from Global Strategy Files. Unsubscribe in one click, at any time.