Pricing the Way Back: A Quantitative Audit of Britain’s European Options


Download PDF
Executive Summary
Since 2024 the British government has pursued a reset of relations with the European Union, including negotiations on an agreement covering sanitary and phytosanitary (SPS) checks. Opinion polls show growing support for a closer relationship, and the economic shocks of 2026 have reopened the debate. This paper asks a simple question: how much is each option worth? It answers with three tools: a synthetic control estimate of the total GDP effect of leaving the EU, a difference-in-differences analysis of trade with the EU and the rest of the world, and a calibration that maps each option onto the trade frictions it would remove.
- The GDP gap is large and still growing. A synthetic UK built from 17 advanced economies to match British GDP from 2005 to mid-2016 diverges from actual GDP after the referendum. By the second quarter of 2026 the UK was 8.1 per cent below the synthetic UK in the central specification, with a range of 6.5 to 11.3 per cent across donor pools.
- The divergence is unusual. In a placebo test in which each of the 17 donors is treated in turn, the UK shows the largest ratio of post-2016 to pre-2016 fit error, a ranking that would occur by chance with a probability of about 1 in 18.
- Most of the gap opened after 2021. The gap was between 0.5 and 2 per cent at the end of 2019 and has widened almost every year since the Trade and Cooperation Agreement took effect, by about 5.6 to 9.3 points.
- Imports from the EU took the clearest hit. Relative to imports from the rest of the world, imports from the EU fell by about 17 per cent after 2021, after controlling for trends. The relative decline of exports to the EU is large in raw terms, about 15 per cent, but it largely continues a pre-existing trend.
- The available options recover little. An SPS agreement would recover about 0.4 per cent of GDP in the long run, a customs union about 1.4 per cent and both together about 1.7 per cent. A single market arrangement would recover about 5.5 per cent and full membership about 7.6 per cent, before net budget contributions of roughly 0.3 to 0.4 per cent of GDP.
These numbers carry large uncertainty, and the synthetic control captures every difference between Britain and its comparators after 2016, not only Brexit. But the ranking of options is robust: the value of any arrangement depends on how far it reduces non-tariff barriers to goods and services, and only arrangements that include the single market do so at scale.
1. The Question Returns
The United Kingdom left the European Union in January 2020 and its single market and customs union at the end of that year. Since January 2021 trade has been governed by the Trade and Cooperation Agreement, which removed tariffs on goods meeting rules of origin but introduced customs declarations, regulatory checks and the loss of mutual recognition for services. Successive governments have rejected rejoining the single market or a customs union. The government elected in 2024 sought instead a reset: an SPS agreement for agrifood trade, cooperation on energy and security, and youth mobility.
This paper does not take a position on whether Britain should seek a closer relationship. Its aim is to give each option a price, using data up to the second quarter of 2026, so that the choices can be compared on a common basis.
Table 1. Data used in this paper
| Series | Source | Span |
|---|---|---|
| UK real GDP | ONS, ABMI | Quarterly, 2005 to 2026 Q2 |
| Real GDP of 13 European economies | Eurostat chain-linked volumes via FRED | Quarterly, 2005 to 2026 Q2 |
| Real GDP of the United States, Canada, Japan, Australia | National sources via FRED | Quarterly, 2005 to 2026 Q2 |
| UK exports and imports of goods and services, EU and non-EU, volumes | ONS, P5VC, P5VD, P5VF, P5VG | Quarterly, 1997 to 2026 Q2 |
| UK exports of services and goods to the EU, current prices | ONS, L854, L855, L87S | Quarterly |
Note: the 17 donors are Germany, France, Italy, Spain, the Netherlands, Belgium, Austria, Sweden, Denmark, Finland, Portugal, Norway, Switzerland, the United States, Canada, Japan and Australia.
2. The Synthetic Britain
2.1 Method
The synthetic control method builds a counterfactual for the UK as a weighted average of other countries, with weights chosen so that the weighted average tracks UK GDP as closely as possible before the referendum. The paper uses the log of real GDP, indexed to the second quarter of 2016, over 2005 to mid-2016. Weights are non-negative and sum to one. After the referendum, the difference between actual and synthetic GDP estimates the combined effect of everything that happened to Britain and not to the comparators, of which Brexit is the most obvious candidate.

2.2 Results
Table 2. Synthetic control estimates
| Donor pool | Main weights | Pre-2016 fit error (pp) | Gap, 2019 Q4 | Gap, 2022 Q4 | Gap, 2024 Q4 | Gap, 2026 Q2 |
|---|---|---|---|---|---|---|
| All 17 donors | United States 0.64, Denmark 0.31, Sweden 0.06 | 0.67 | -2.0 | -4.8 | -9.3 | -11.3 |
| Excluding the United States (central) | Denmark 0.51, Sweden 0.26, Australia 0.18, Japan 0.05 | 0.94 | -0.5 | -2.3 | -5.6 | -8.1 |
| European donors only | Sweden 0.49, Denmark 0.33, Norway 0.18 | 1.02 | -0.9 | -1.8 | -4.4 | -6.5 |
Note: gap = UK minus synthetic UK, in log points (approximately per cent of GDP). Pre-2016 fit error is the root mean squared error over 2005 Q1 to 2016 Q2.
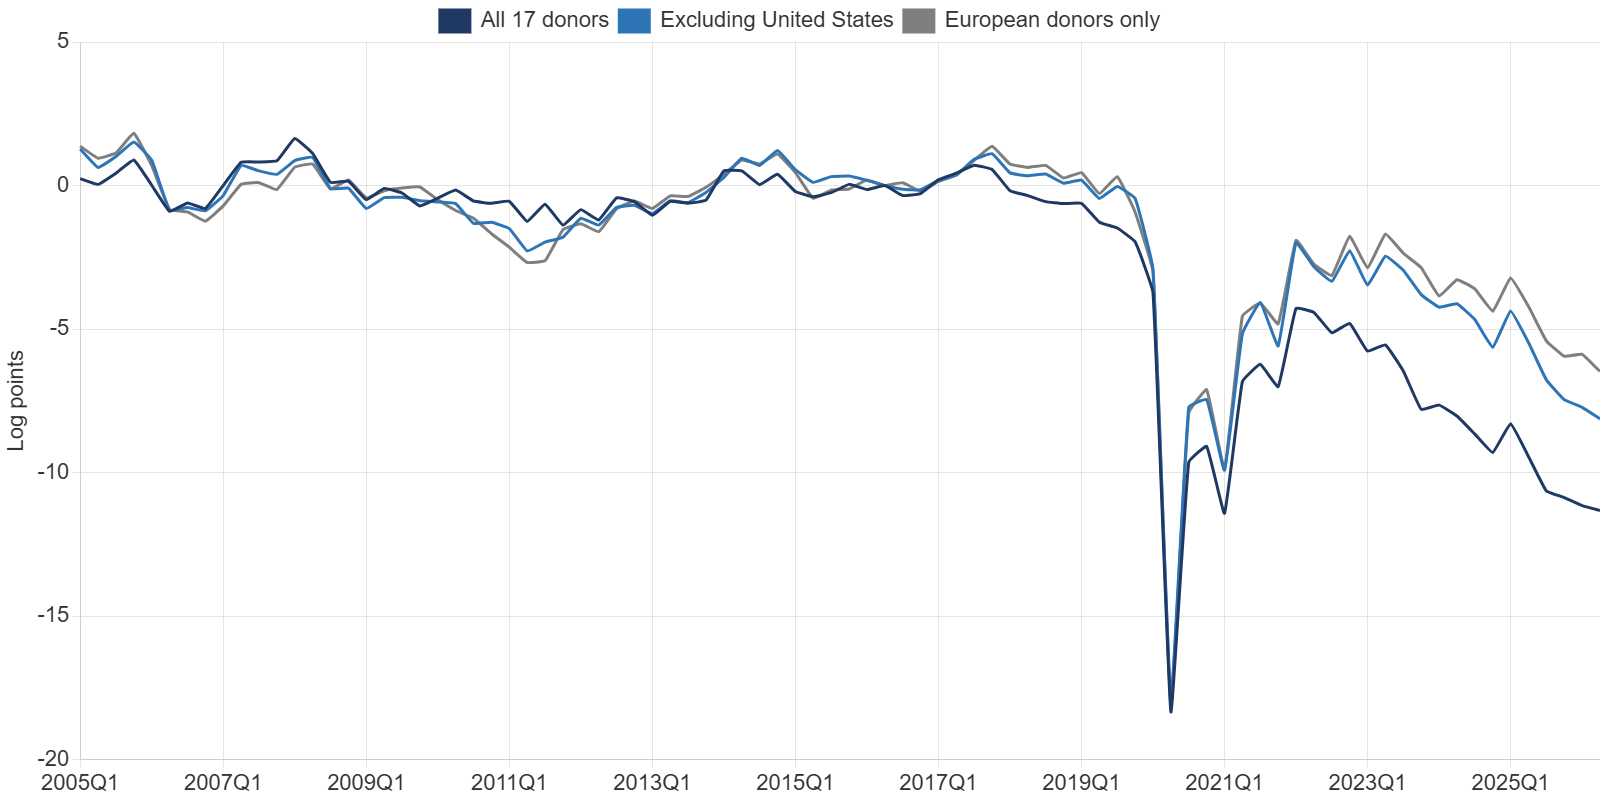
All three specifications tell the same story. The synthetic UK tracks actual GDP closely before 2016, with fit errors below one percentage point. After the referendum a modest gap opens, between 0.5 and 2 per cent by the end of 2019, consistent with weaker investment during the years of uncertainty. The pandemic years are noisy. From 2021 the gap widens steadily, and by mid-2026 it reaches 6.5 to 11.3 per cent. The specification that includes the United States gives the largest gap, because the American economy grew unusually fast after 2020; the European-only specification gives the smallest. The central estimate, excluding the United States, is 8.1 per cent. Crucially, in no specification does the gap show signs of closing.
2.3 Is the gap unusual?

A natural objection is that synthetic controls can produce large gaps for any country. The placebo test addresses it: each of the 17 donors is treated in turn as if it had left the EU in 2016, with the remaining countries as donors. The UK has the highest ratio of post-2016 to pre-2016 fit error among the 18 countries, at 10.6, ahead of Germany (9.5), whose industrial model has suffered from the energy shock and Chinese competition. The probability of the UK ranking first by chance is 1 in 18, or about 0.06.
3. The Trade Channel
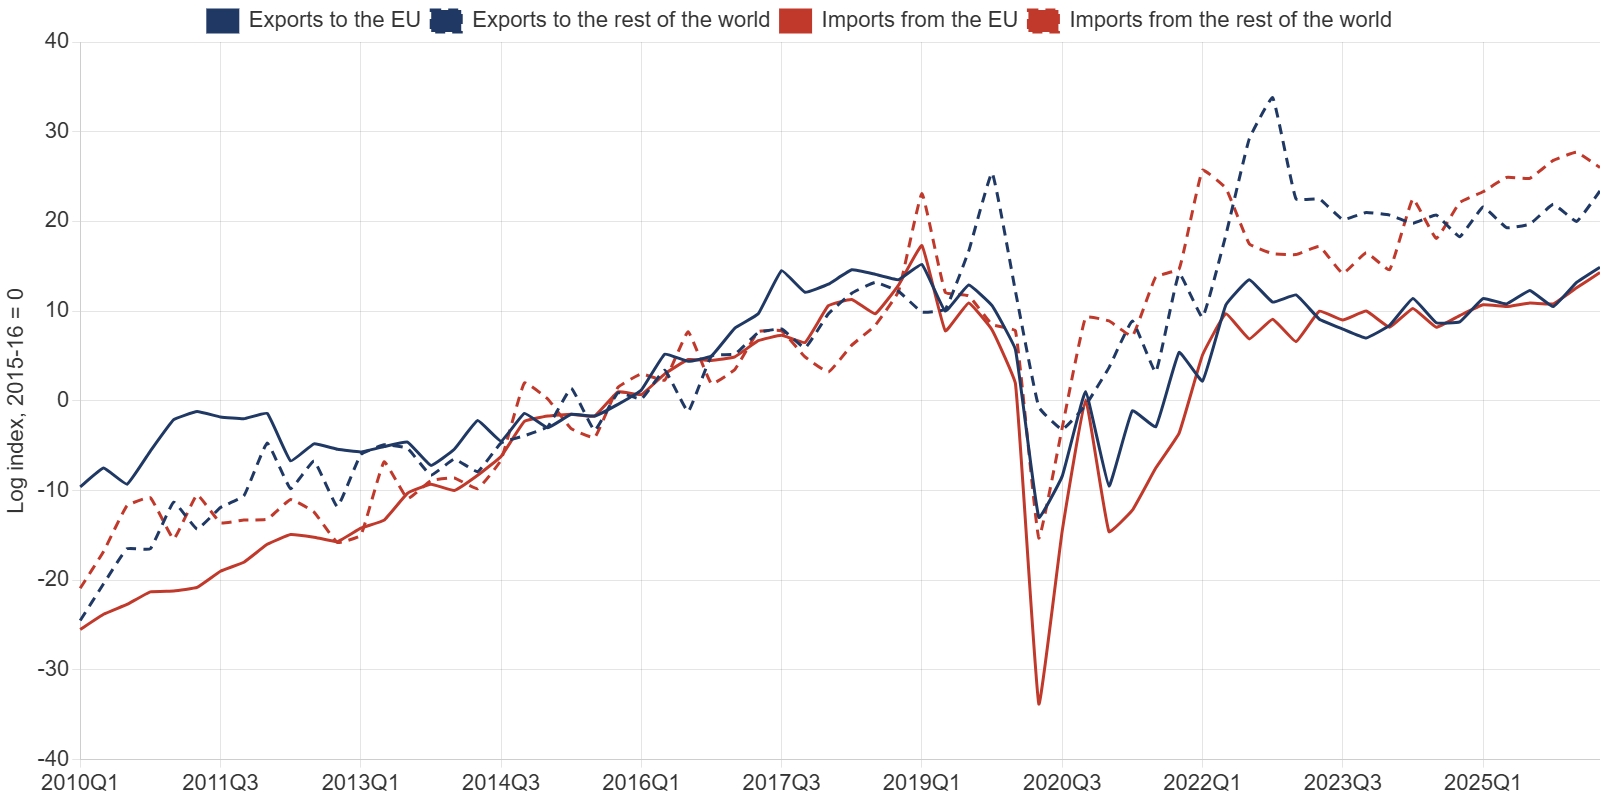
If Brexit reduced GDP, trade with the EU is the most direct channel. Figure 4 shows UK exports and imports of goods and services, in volume terms, with the EU and with the rest of the world. In the second quarter of 2026 exports to the EU were about 15 log points above their 2015-16 level, against 23 for exports to the rest of the world; imports from the EU were 14 log points higher, against 26 for imports from elsewhere.
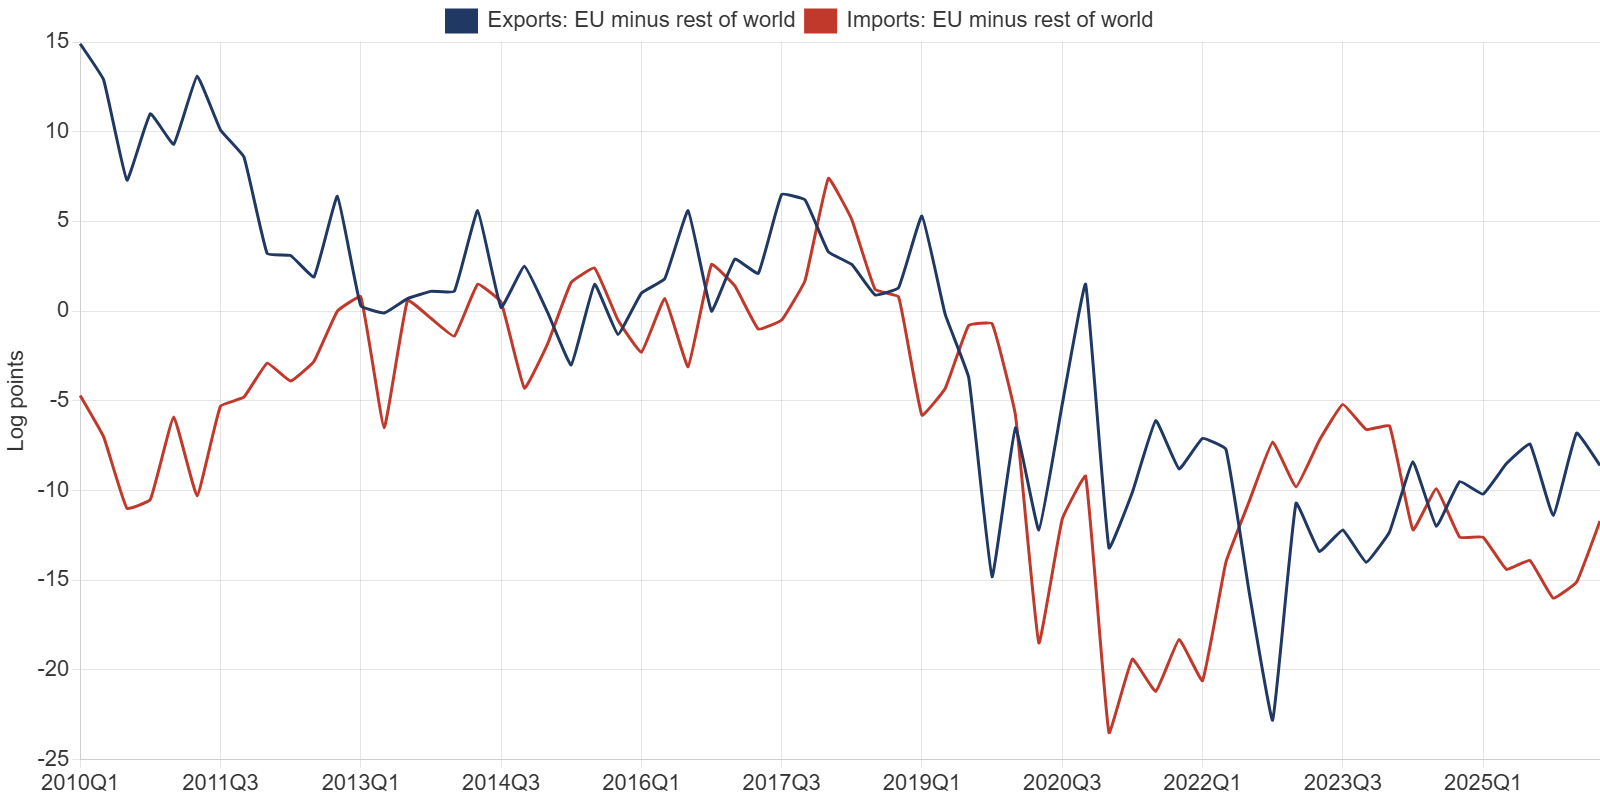
Table 3. Difference-in-differences: trade with the EU relative to the rest of the world (log points)
| Specification | Referendum to 2020 | Since 2021 (TCA) | Pre-existing trend per year |
|---|---|---|---|
| Exports, no trend | -4.6 (2.9) | -15.1 (2.0) | |
| Exports, with linear trend | +3.5 (2.5) | +0.4 (4.3) | -1.5 (0.4) |
| Imports, no trend | +0.7 (2.6) | -10.1 (2.4) | |
| Imports, with linear trend | -2.7 (3.3) | -16.7 (5.7) | +0.6 (0.5) |
Note: quarterly data, 2010 Q1 to 2026 Q2; HAC standard errors in parentheses. Coefficients measure the change in the EU minus non-EU log difference relative to 2010 to mid-2016.
The difference-in-differences estimates in Table 3 separate the two flows. For imports the result is clear: after 2021, imports from the EU fell by about 10 to 17 per cent relative to imports from the rest of the world, depending on whether a trend is allowed, with the larger estimate statistically significant. For exports the raw decline is about 15 per cent, but exports to the EU were already losing share to faster-growing markets before the referendum, at about 1.5 per cent a year; once that trend is allowed for, the TCA effect on exports cannot be distinguished from zero. The burden of the new frictions appears to have fallen most on EU suppliers to Britain and on British firms that depend on EU inputs, whose costs rose.
Services tell a different story. The share of UK services exports going to the EU has stayed between 34 and 38 per cent since 2015, and services exports to the EU have grown strongly in cash terms. The loss of passporting and mutual recognition has not prevented growth in services trade, though it may have limited it.
4. Pricing the Options
To price the options, the paper maps each one onto the frictions it would remove. The relevant loss is the part of the GDP gap that opened after 2021, when the TCA took effect: 7.6 per cent of GDP in the central specification, with a range of 5.6 to 9.3 per cent. Goods and services account for roughly equal shares of UK exports to the EU, 51 and 49 per cent in mid-2026. Each option is assumed to remove a share of the goods and services frictions, based on what it covers. These shares are judgments, stated openly so that readers can substitute their own.
Table 4. Assumed share of post-2021 frictions removed by each option
| Option | Goods frictions removed | Services frictions removed | Main content |
|---|---|---|---|
| SPS and veterinary agreement | 10% | 0% | Removes most checks on agrifood trade |
| Customs union | 35% | 0% | Removes customs declarations and rules of origin; common external tariff |
| Customs union plus SPS | 45% | 0% | Combination of the two |
| Single market, EEA-type | 85% | 60% | Regulatory alignment, mutual recognition, free movement |
| Full membership | 100% | 100% | Full participation, with budget contribution |
Note: author’s judgments. Agrifood and regulatory checks are the main goods frictions not removed by a customs union.
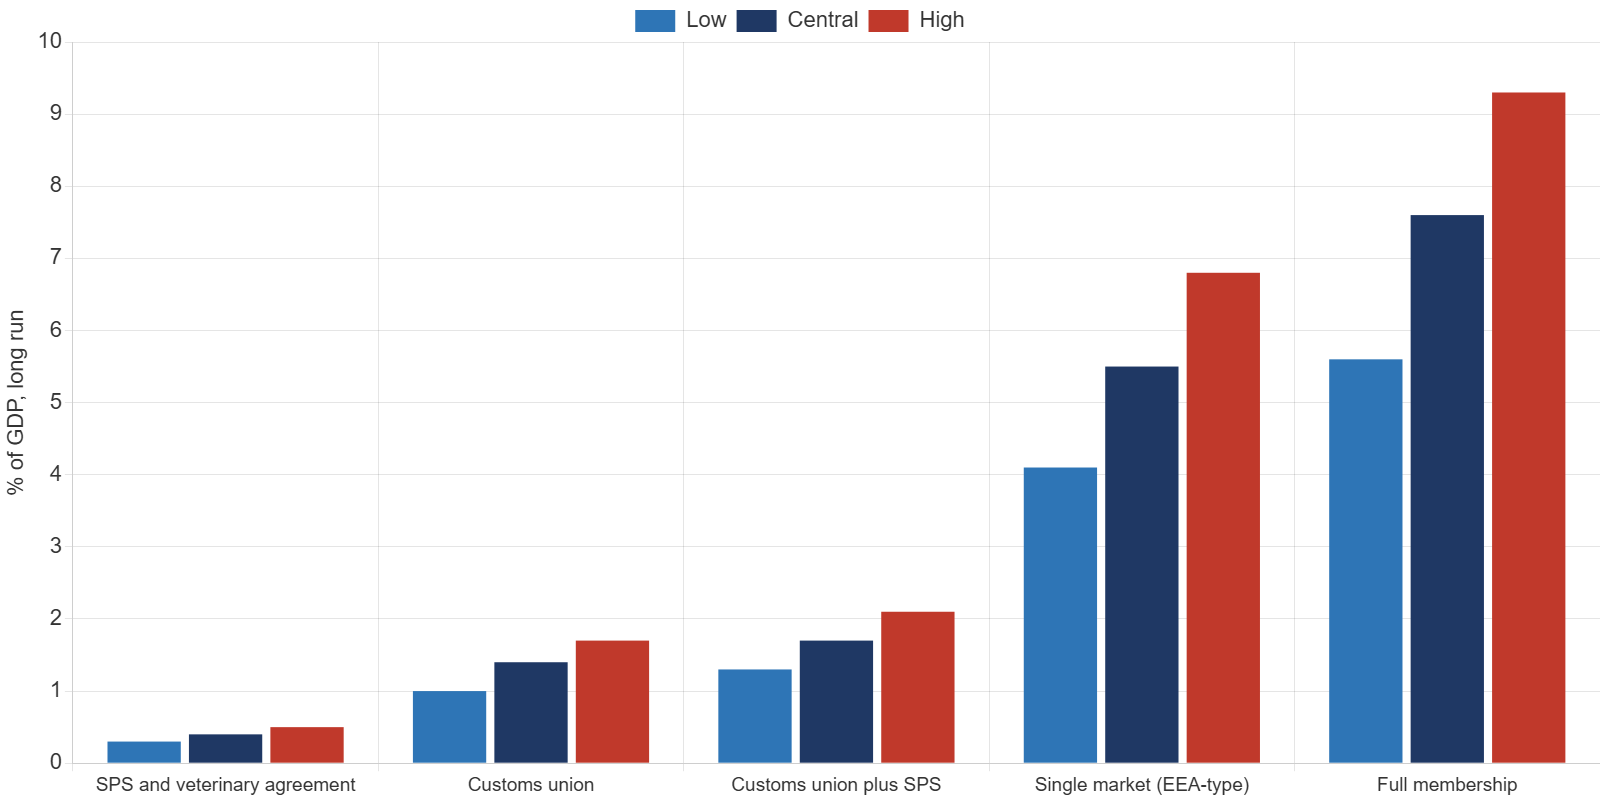
Table 5. Long-run value of each option
| Option | % of GDP, central (range) | GBP bn a year at 2025 GDP | Extra tax revenue, GBP bn a year |
|---|---|---|---|
| SPS and veterinary agreement | 0.4 (0.3 to 0.5) | 12 | 4 |
| Customs union | 1.4 (1.0 to 1.7) | 41 | 15 |
| Customs union plus SPS | 1.7 (1.3 to 2.1) | 53 | 20 |
| Single market, EEA-type | 5.5 (4.1 to 6.8) | 168 | 62 |
| Full membership | 7.6 (5.6 to 9.3) | 231 | 85 |
Note: value = share of frictions removed x post-2021 GDP gap; 1 per cent of GDP is about 30 billion pounds at 2025 prices; tax take 37 per cent. Full membership and single market arrangements would involve budget contributions of very roughly 0.3 to 0.4 per cent of GDP.
The results show a steep gradient. The SPS agreement under negotiation would recover about 0.4 per cent of GDP, worth about 12 billion pounds a year at today’s prices once fully effective. A customs union would recover about 1.4 per cent; combined with an SPS agreement, about 1.7 per cent. Only arrangements that include the single market recover most of the loss: an EEA-type arrangement about 5.5 per cent, and full membership about 7.6 per cent before budget contributions. The options that the current government is willing to consider are worth less than a quarter of the estimated loss.
Two caveats are essential. First, these are long-run values; trade relationships take years to rebuild, and the benefits would arrive gradually. Second, the calibration assumes that the post-2021 GDP gap reflects the TCA’s trade frictions. Part of it may reflect other factors, including differences in energy exposure, labour supply and productivity, in which case all values should be scaled down proportionally. The ranking of options would not change.
5. The Interaction With the 2026 Shocks
The energy shock of 2026 adds a further dimension. The third paper in this series showed that British households pay European gas prices with a long delay through the price cap. Closer integration with the EU’s electricity market, including participation in market coupling and the linking of carbon markets, would not change the gas price but could reduce the cost of trading electricity across interconnectors. These benefits are real but are not captured in the trade-based calibration above, and they are available without single market membership.
The fiscal position also matters. The second paper in this series showed that investors demand a high term premium on long-dated gilts. A credible long-term increase in GDP of several per cent would improve the debt outlook and could lower that premium, while a modest SPS agreement would make little difference.
6. Conclusions
Ten years after the referendum, the evidence points to a large and still widening gap between British GDP and what comparable economies achieved: about 8 per cent in the central estimate, opening mainly after 2021. Trade data show that the new frictions fell most visibly on imports from the EU. The options now on the table, an SPS agreement and perhaps a customs union, would recover between 0.4 and 1.7 per cent of GDP. Single market participation would recover most of the loss but would require accepting the free movement and regulatory obligations that Britain rejected in 2016. The price of the way back is therefore not only economic but political: the economic gains are concentrated in the options that are politically hardest.
Methodological Appendix
A1. Synthetic control
Outcome: 100 x log of real GDP, indexed to 2016 Q2. Pre-treatment period: 2005 Q1 to 2016 Q2 (46 quarters). Weights w minimise the sum of squared differences between the UK and the weighted donors over the pre-treatment period, subject to w greater than or equal to zero and summing to one (SLSQP optimisation). Placebo tests apply the same procedure to each donor, using the other donors (excluding the UK) as the pool, and compare the ratio of post- to pre-treatment root mean squared prediction error.
A2. Trade difference-in-differences
The dependent variable is the log of UK trade with the EU minus the log of trade with the rest of the world, in chained volume terms, indexed to 2015 Q1 to 2016 Q2. It is regressed on dummies for 2016 Q3 to 2020 Q4 and for 2021 Q1 onwards, with and without a linear trend, with Newey-West standard errors (4 lags).
A3. Limitations
The synthetic control captures all differences in performance after 2016, not only Brexit; donor economies have their own shocks, such as the pharmaceutical boom in Denmark and the energy crisis in Germany. GDP is not adjusted for population, and Britain’s population grew faster than most donors’ after 2021, which means that per capita gaps would be larger. ONS trade data by partner are affected by changes in recording after 2021 and by the treatment of precious metals. The option calibration rests on stated judgments rather than estimated elasticities.
References
Abadie, A., A. Diamond and J. Hainmueller (2010), Synthetic control methods for comparative case studies, Journal of the American Statistical Association, 105(490).
Office for National Statistics (2026), UK trade and quarterly national accounts, 2026 Q2.
Eurostat (2026), Quarterly national accounts, accessed via FRED, November 2026.
Driss EFFINA, PhD
Independent Researcher, Global Strategy Files
The opening pages of our four country reports: United States, United Kingdom, Japan and China. A free PDF, sent to your inbox.
You will also receive occasional analysis from Global Strategy Files. Unsubscribe in one click, at any time.