The Vanishing Corporate Tax: Expensing, the AI Investment Boom and the Permanence of a Temporary Loss

Abstract
In fiscal year 2026, federal receipts from the corporate income tax fell by about 70 billion dollars, or 16 percent, to roughly 380 billion dollars, in a year when corporate profits reached a record. Over the first eleven months of the year the decline was 25 percent. The Congressional Budget Office attributes the drop to the business provisions of the 2025 budget law, known as the One Big Beautiful Bill Act, which restored full and permanent expensing of equipment and the immediate deduction of domestic research spending. Defenders of the law answer that expensing is a timing change: companies deduct their investment earlier and pay more tax later, so the loss is temporary. This study tests that claim with twenty years of data and an explicit model. We rebuild the series of corporate receipts, effective tax rates and depreciation regimes from 2006 to 2026 and show that the 2026 effective rate, about 9.7 percent of profits, is the lowest outside a recession or a statutory rate cut in the sample. We then decompose the 2026 shortfall into a transitory component, the one-time catch-up of research deductions that will reverse in 2027, and a persistent component tied to equipment expensing. Our central analytical result is simple but rarely stated: the revenue loss from expensing is temporary only if investment stops growing. When investment grows at rate g, the ratio of depreciation to expensing deductions converges to a constant below one, and the gap becomes permanent. At the 20 to 30 percent growth rates of artificial intelligence infrastructure, between 28 and 37 percent of each year's eligible five-year equipment investment is never recouped as long as growth continues. Applied to the data center build-out of the largest technology companies, whose capital spending is expected to exceed 720 billion dollars in 2026, the stylized gap reaches about 46 billion dollars in 2026 and could approach 130 billion dollars a year by 2035 if the boom continues. If it ends abruptly, the gap reverses and corporate receipts rise in the downturn. Full expensing has turned the corporate tax into a tax on the end of investment cycles.
Key findings
- Corporate receipts fell from 530 billion dollars in fiscal 2024 to 452 billion in 2025 and about 380 billion in 2026, from 10.8 percent of federal revenue to about 7.1 percent. In the 1950s the tax provided close to a third of federal revenue.
- Measured against corporate profits before tax, the federal corporate tax yields about 9.7 percent in 2026, against 12 to 15 percent in 2021 to 2025 and 19 to 22 percent in 2006 to 2008.
- The 2026 decline is unusual: in 2009 receipts fell with profits, and in 2018 they fell with the statutory rate. In 2026 they fell while profits grew by about 7 percent.
- About half of the 2026 shortfall relative to a no-change baseline reflects the one-time acceleration of research deductions from 2022 to 2024 and should reverse in fiscal 2027. The other half reflects equipment expensing and will persist as long as investment grows.
- With investment growing at 10 percent a year, 17 percent of each year's five-year equipment spending is never recouped by the Treasury; at 30 percent growth, 37 percent.
- In a stylized model of the AI build-out, the expensing gap rises from about 46 billion dollars in 2026 to about 128 billion in 2035 under continued growth, falls to zero by 2031 if spending plateaus in 2028, and turns into a revenue gain if spending collapses.
1. Introduction: a profit boom without tax receipts
Three numbers summarize the paradox of American corporate taxation in 2026. The four largest technology companies spent about 209 billion dollars on capital equipment and data centers in the third quarter alone, 84 percent more than a year earlier, and expect to spend 720 to 745 billion dollars in the calendar year. Corporate profits are at a record. And corporate income tax receipts collected by the federal government fell by about 70 billion dollars in the fiscal year that ended in September, while total federal receipts rose by 169 billion dollars to 5.4 trillion.
The proximate cause is not in dispute. The budget law signed on 4 July 2025 made permanent the 100 percent bonus depreciation for equipment acquired after 19 January 2025, replacing a schedule under which bonus depreciation would have fallen to 40 percent in 2025, 20 percent in 2026 and zero in 2027. It also restored the immediate deduction of domestic research and experimental expenditures, which since 2022 had to be amortized over five years, and allowed companies to deduct the unamortized balance of their 2022 to 2024 research costs over 2025 and 2026. In its monthly budget reviews, the Congressional Budget Office noted that these provisions allowed corporations to take larger deductions for certain investments, reducing payments and offsetting the increases in receipts that otherwise would have been expected, given the rise in corporate income.
What is in dispute is the meaning of the decline. Critics see a windfall to large corporations, especially technology firms whose tax expense has collapsed while their profits soared. Defenders, including the Tax Foundation and the Cato Institute, argue that expensing is a timing change rather than a subsidy: a company that deducts an investment immediately has no depreciation to deduct later, so its taxable income is higher in future years, and receipts recover. In their view, the 2026 dip is the transitional cost of a better tax system.
Both sides tend to argue in principle. This study argues with numbers. Section 2 rebuilds twenty years of corporate receipts and effective rates. Section 3 places 2026 in the history of depreciation regimes. Section 4 decomposes the 2026 shortfall into transitory and persistent parts. Section 5 develops the central model: the conditions under which the expensing loss is temporary or permanent. Section 6 applies it to the AI investment boom and simulates three scenarios to 2035. Section 7 discusses the implications for fiscal policy, for the stability of revenue and for tax design.
2. Twenty years of the corporate tax
2.1 Receipts, revenue share and GDP
Figure 1 shows federal corporate income tax receipts by fiscal year from 2006 to 2026, together with their share of total federal receipts. Three episodes stand out. The first is the financial crisis: receipts fell from 370 billion dollars in 2007 to 138 billion in 2009, when profits collapsed and losses were carried back. The second is the 2017 tax law, which cut the statutory rate from 35 to 21 percent and introduced 100 percent bonus depreciation: receipts fell from 297 billion dollars in 2017 to 205 billion in 2018. The third is the current episode. After a rebound to a record 530 billion dollars in 2024, helped by high profits, the expiry of full expensing and the requirement to amortize research costs, receipts fell to 452 billion in 2025 and to about 380 billion in 2026.

As a share of federal revenue, the corporate tax has been on a long decline. It provided close to a third of federal revenue in the 1950s, about 15 percent in 2006 and 2007, and about 7 percent in 2026, a level previously seen only in 2009 (6.6 percent), 2018 (6.2 percent) and 2020 (6.2 percent). As a share of GDP, receipts stand at about 1.2 percent in 2026, against 2.6 percent in 2006 and 1.8 percent in 2024.
Table 1. The federal corporate income tax, selected fiscal years
| Fiscal year | Receipts (billion dollars) | Share of federal receipts (%) | Share of GDP (%) | Receipts as share of profits before tax (%) |
|---|---|---|---|---|
| 2006 | 354 | 14.7 | 2.56 | 19.2 |
| 2009 | 138 | 6.6 | 0.96 | 9.5 |
| 2015 | 344 | 10.6 | 1.89 | 15.9 |
| 2018 | 205 | 6.2 | 1.00 | 8.8 |
| 2022 | 425 | 8.7 | 1.65 | 12.7 |
| 2024 | 530 | 10.8 | 1.82 | 15.1 |
| 2025 | 452 | 8.6 | 1.48 | 12.2 |
| 2026 | about 382 | 7.1 | 1.20 | 9.7 |
Source: Office of Management and Budget historical tables, Congressional Budget Office Monthly Budget Reviews, Bureau of Economic Analysis; profits before tax are rounded national accounts estimates and the 2026 values are Global Strategy Files estimates.
2.2 The effective rate on profits
The share of corporate profits that ends up in federal receipts is a rough but revealing indicator. It differs from the effective tax rate reported by companies, because receipts include payments related to earlier years, because national accounts profits differ from taxable income, and because pass-through businesses are excluded. But over twenty years, its movements track changes in tax law closely. Figure 2 shows it alongside the bonus depreciation rate in force.
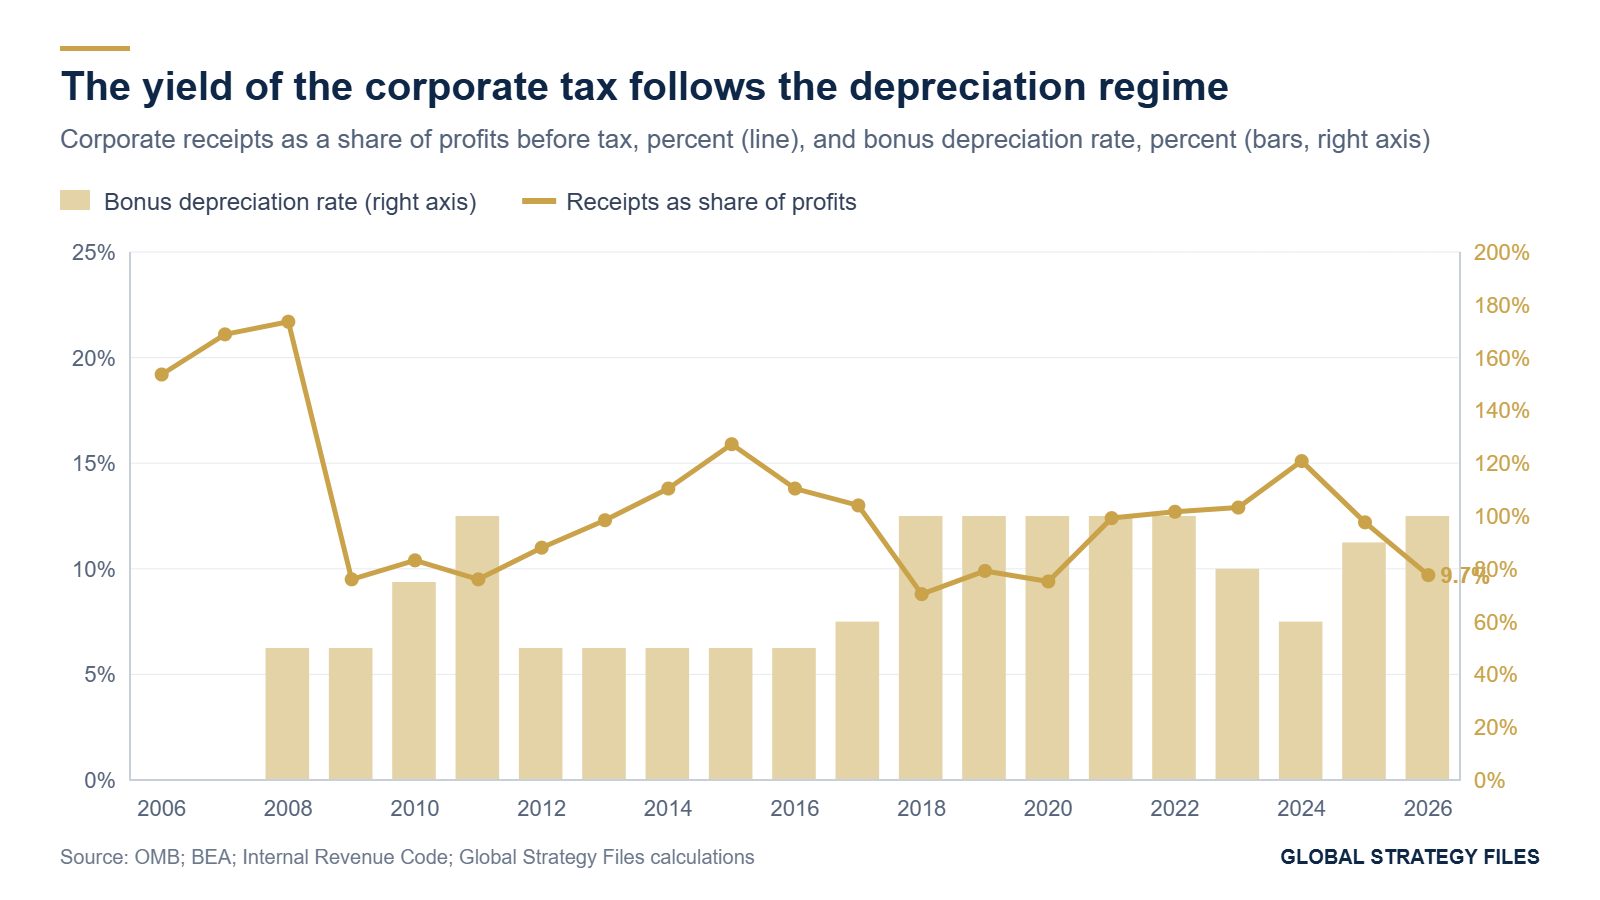
The ratio was about 19 to 22 percent in 2006 to 2008, when the statutory rate was 35 percent and bonus depreciation was zero or limited. It fell below 10 percent in the crisis years. It recovered to about 16 percent in 2015, fell to about 9 percent after the 2017 law, and rose again to about 15 percent in 2024, when bonus depreciation had been phased down to 60 percent and research costs were amortized. In 2026, with full expensing restored, it is back to about 9.7 percent.
The pattern is consistent with a simple regression of the ratio on the bonus depreciation rate over 2006 to 2025, which gives a significant coefficient of minus 0.085 (p value 0.018): each 10 points of bonus depreciation is associated with a ratio about 0.85 points lower. The regression should not be used for counterfactual estimates, because the bonus rate is correlated with other policy changes and with the business cycle, but it confirms that the depreciation regime, rather than the statutory rate, has been the main driver of the yield of the corporate tax since 2018.
2.3 What is different in 2026
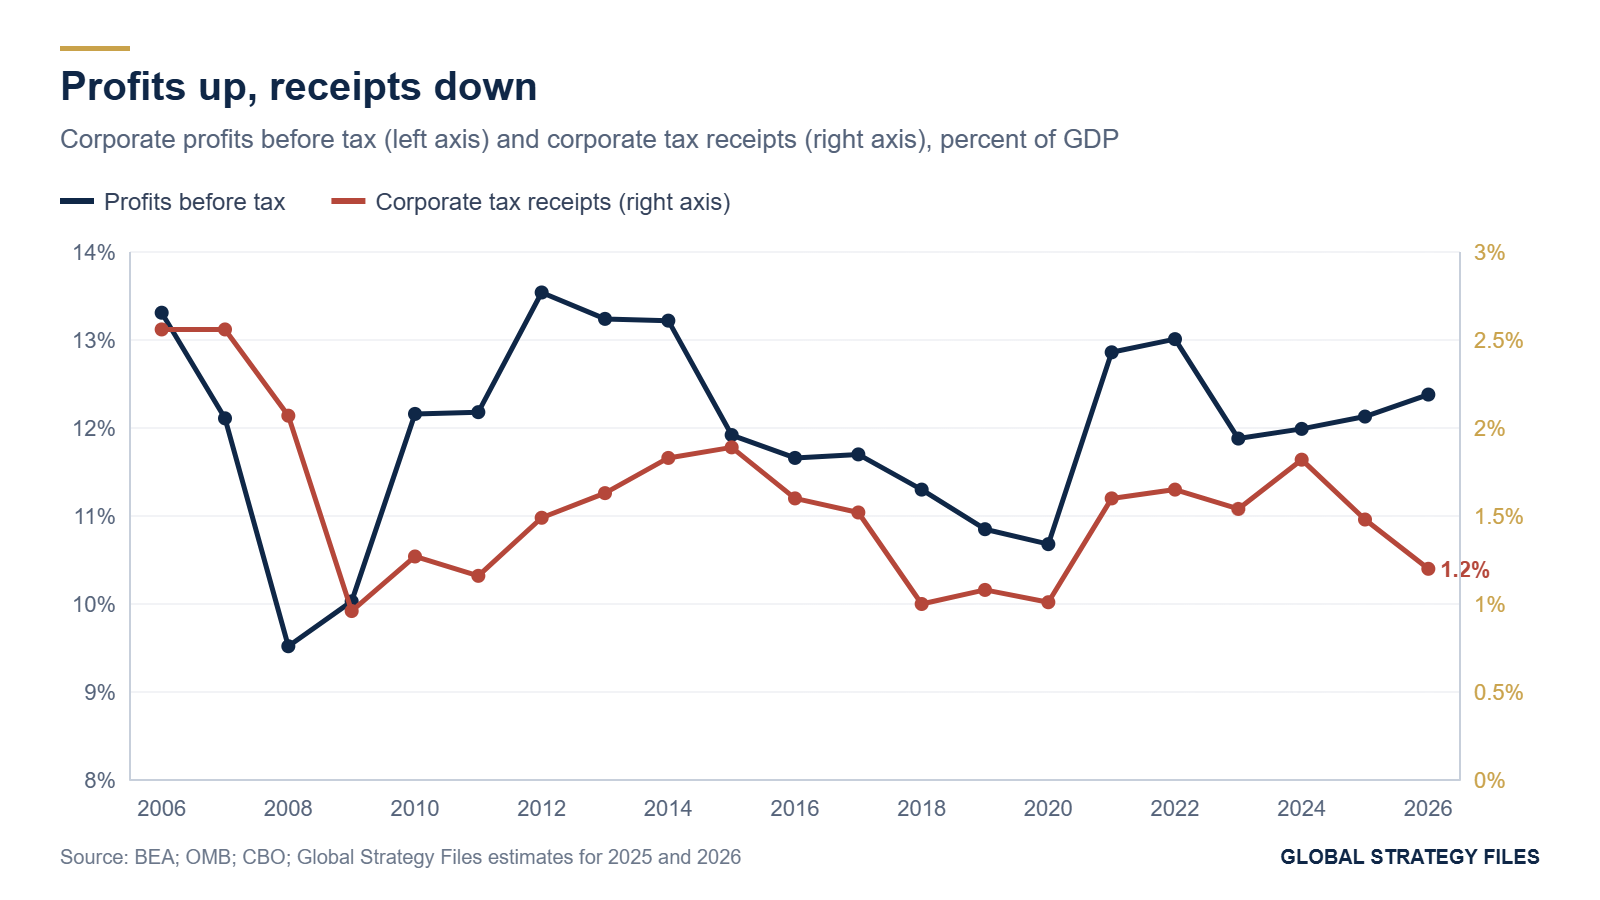
The decline of 2026 differs from earlier episodes in one crucial respect. In 2009, receipts fell because profits fell. In 2018, receipts fell because the statutory rate fell by 14 points. In 2026, profits rose by about 7 percent and the statutory rate did not change. Figure 3 shows the divergence: profits before tax as a share of GDP rose slightly, to about 12.4 percent, while receipts as a share of GDP fell to about 1.2 percent. The tax base, in the economic sense, is growing; the taxable base is shrinking. The gap between the two is investment.
3. Depreciation regimes, 2006 to 2026
The United States has changed the rules for deducting capital investment more often than any other major economy. Table 2 lists the regimes in force over the twenty-year period. Bonus depreciation, a provision that allows companies to deduct a percentage of the cost of eligible equipment in the year of purchase, with the remainder depreciated over the normal schedule, was introduced as a temporary stimulus in 2002, reintroduced at 50 percent in 2008, raised to 100 percent from September 2010 to the end of 2011, held at 50 percent until 2017, raised to 100 percent by the 2017 law, and scheduled to phase out from 2023. The 2025 law reversed the phase-out and made full expensing permanent.
Table 2. Depreciation and research deduction regimes, 2006 to 2026
| Period | Bonus depreciation on equipment | Research and experimental costs | Statutory rate |
|---|---|---|---|
| 2006 to 2007 | None | Immediate deduction | 35 percent |
| 2008 to mid-2010 | 50 percent | Immediate deduction | 35 percent |
| Late 2010 to 2011 | 100 percent | Immediate deduction | 35 percent |
| 2012 to 2017 | 50 percent | Immediate deduction | 35 percent |
| 2018 to 2022 | 100 percent | Immediate deduction until 2021; five-year amortization from 2022 | 21 percent |
| 2023 | 80 percent | Five-year amortization | 21 percent |
| 2024 | 60 percent | Five-year amortization | 21 percent |
| 2025 | 40 percent, then 100 percent after 19 January | Immediate deduction restored; 2022 to 2024 balances deductible over 2025 and 2026 | 21 percent |
| 2026 onward | 100 percent, permanent | Immediate deduction, permanent | 21 percent |
Source: Internal Revenue Code as amended in 2008, 2010, 2017 and 2025; Global Strategy Files summary.
The amortization of research costs between 2022 and 2024 deserves particular attention, because it explains part of the record receipts of 2024 and part of the collapse of 2026. Between 2022 and 2024, companies could deduct only 10 percent of a year's domestic research spending in the first year, 20 percent in each of the next four years and the last 10 percent in the sixth year. Large research-intensive companies, most of them in technology and pharmaceuticals, saw their taxable income rise sharply. When the 2025 law restored immediate deduction and allowed the remaining balance of the 2022 to 2024 spending to be deducted over 2025 and 2026, those companies received a double benefit in 2025 and 2026: the deduction of current research spending, plus the accelerated deduction of past spending.
4. Decomposing the 2026 shortfall
4.1 A no-change baseline
To measure the effect of the law, we need a baseline: what receipts would have been without it. A simple baseline holds the 2025 ratio of receipts to profits constant and applies it to 2026 profits. With profits about 7 percent higher, receipts would have risen by about 31 billion dollars, to about 483 billion. Actual receipts of about 382 billion dollars are therefore about 101 billion dollars below this baseline. This number is close to the decline of 96 billion dollars that the Congressional Budget Office reported for the first eleven months of the fiscal year, when profits were also rising.
4.2 The transitory component: research catch-up
The accelerated deduction of 2022 to 2024 research balances is, by construction, a one-time event. Domestic research spending eligible for the deduction was in the order of 500 to 560 billion dollars a year in 2022 to 2024. Under the amortization rules, companies had deducted about half of the 2022 spending, 30 percent of the 2023 spending and 10 percent of the 2024 spending by the end of 2024, which leaves an unamortized balance of roughly 1.1 trillion dollars. Deducted over 2025 and 2026, this balance generates extra deductions of about 550 billion dollars a year, partly offset by the amortization deductions that would have been taken in those years under the old rules (about 270 to 320 billion dollars). The net extra deduction, about 250 to 280 billion dollars a year, reduces receipts by roughly 50 to 60 billion dollars at the 21 percent rate in each of the two years. Because the catch-up ends in 2026, it will reverse in fiscal 2027: receipts should rise mechanically by about the same amount, other things equal.
4.3 The persistent component: equipment expensing
The rest of the shortfall, about 40 to 50 billion dollars in 2026, reflects equipment expensing, net of smaller effects from international provisions and the timing of estimated payments. Unlike the research catch-up, this component does not reverse on a fixed date. Whether it reverses at all depends on the path of investment, which is the subject of Section 5.
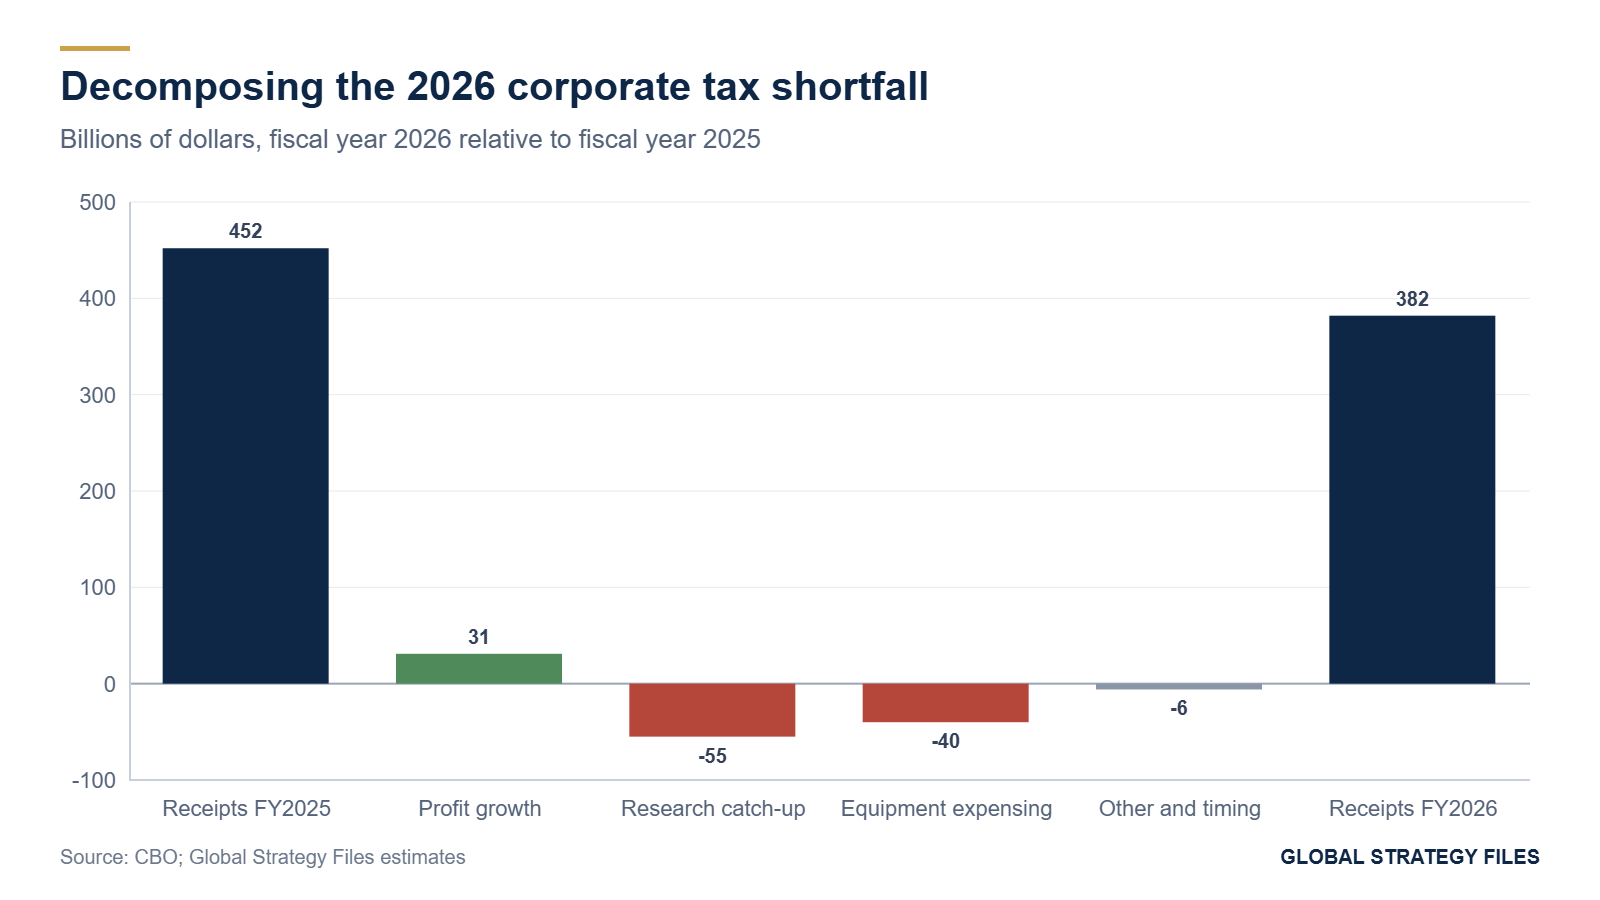
Table 3. Decomposition of the 2026 corporate tax shortfall, billions of dollars
| Component | Estimate | Range | Nature |
|---|---|---|---|
| Receipts in fiscal 2025 | 452 | ||
| Effect of profit growth at constant yield | +31 | +25 to +35 | Cyclical |
| No-change baseline for 2026 | 483 | ||
| Research catch-up (2022 to 2024 balances) | -55 | -50 to -60 | Transitory, reverses in 2027 |
| Equipment expensing | -40 | -30 to -50 | Persistent while investment grows |
| Other provisions and timing | -6 | -15 to +5 | Mixed |
| Receipts in fiscal 2026 | about 382 |
Source: Global Strategy Files estimates. The allocation between components is approximate and calibrated to the observed total.
The decomposition matters for the fiscal outlook. If half of the 2026 decline reverses in 2027, receipts will rebound by 50 billion dollars or more, and commentators will be tempted to declare that the expensing loss was temporary after all. That conclusion would be premature. The rebound will reflect the end of the research catch-up, not the payback of equipment expensing.
5. When is a timing change permanent?
5.1 The textbook argument
The argument that expensing is a timing change runs as follows. Consider a company that invests 100 dollars in equipment with a five-year life. Under straight-line depreciation it deducts 20 dollars a year for five years; under expensing it deducts 100 dollars in the first year and nothing afterwards. Over five years, total deductions are identical. Expensing lowers taxes in year one and raises them in years two to five. In present value the company gains, because a dollar of deduction today is worth more than a dollar later, but the Treasury recovers the nominal amount.
The argument is correct for a single investment. It is also correct for an economy in which investment is constant: if the company invests 100 dollars every year, then after five years it deducts 100 dollars a year under either regime, and receipts are identical. The transition cost is incurred once, and the steady state is revenue-neutral.
5.2 Growing investment
The argument fails when investment grows. Suppose investment grows at a constant rate g, and equipment is depreciated straight-line over N years. Under expensing, the deduction in year t equals investment in year t, I(t). Under depreciation, the deduction equals the average of the last N years of investment, which is smaller because past investment was lower. The ratio of depreciation deductions to expensing deductions converges to a constant:
R(g, N) = [sum of (1+g) raised to the powers 0, -1, -2 and so on down to -(N-1)] divided by N.
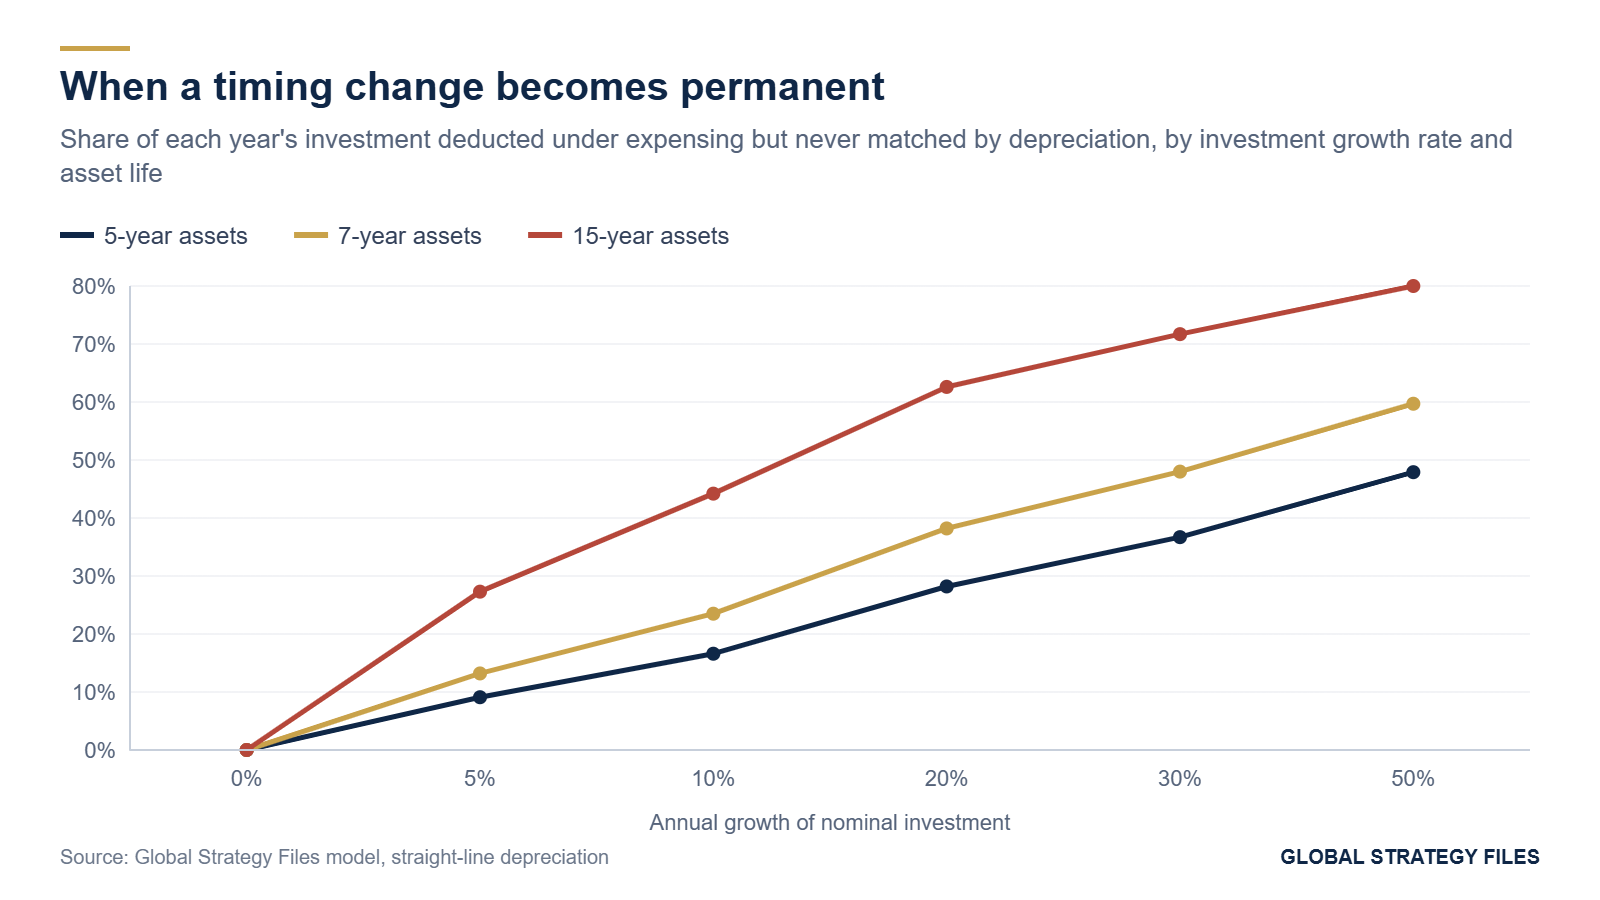
When g equals zero, R equals one and the regimes are equivalent. When g is positive, R is below one, and the difference, 1 minus R, is the share of each year's investment that is deducted under expensing but never deducted under depreciation in the same year. As long as growth continues, this gap does not close. It is not a transition cost; it is a permanent revenue loss, equal to the tax rate times (1 minus R) times investment, which grows with investment itself.
Table 4 gives values of 1 minus R for plausible combinations of growth rates and asset lives. For five-year equipment, the category that includes computers, servers and most data center hardware, the permanent loss is 9 percent of annual investment at 5 percent growth, 17 percent at 10 percent growth, 28 percent at 20 percent growth and 37 percent at 30 percent growth. For longer-lived assets, such as 15-year electrical and power equipment, the gaps are much larger: 44 percent at 10 percent growth.
Table 4. Share of annual investment permanently deducted earlier under expensing (1 minus R)
| Investment growth | 5-year assets | 7-year assets | 15-year assets |
|---|---|---|---|
| 0 percent | 0.0 | 0.0 | 0.0 |
| 5 percent | 9.1 | 13.2 | 27.3 |
| 10 percent | 16.6 | 23.5 | 44.2 |
| 20 percent | 28.2 | 38.2 | 62.6 |
| 30 percent | 36.7 | 48.0 | 71.7 |
| 50 percent | 47.9 | 59.7 | 80.0 |
Source: Global Strategy Files calculations; straight-line depreciation, constant growth.
5.3 What this means for the national economy
Nominal private investment in the United States has grown at roughly 4 to 6 percent a year over the long run, which implies a permanent gap of about 7 to 13 percent of eligible equipment investment for typical asset lives. The Tax Foundation and other defenders of expensing are therefore right that most of the transition cost fades, and wrong if they imply that it disappears. In a growing economy, expensing is a permanent reduction in the corporate tax base, smaller than the first-year cost but not zero. Expressed differently, the claim that expensing is merely a timing change is a claim that nominal investment will stop growing.
The result also reveals why the AI boom matters so much for corporate receipts. When a sector's investment grows at 50, 70 or 80 percent a year, as data center spending has in 2025 and 2026, the permanent gap for that sector is close to half of its investment. The tax system does not merely defer the tax of the technology giants; for as long as their build-out accelerates, it removes a large share of their taxable income every year.
6. The AI build-out and the future of the corporate tax
6.1 The scale of the investment
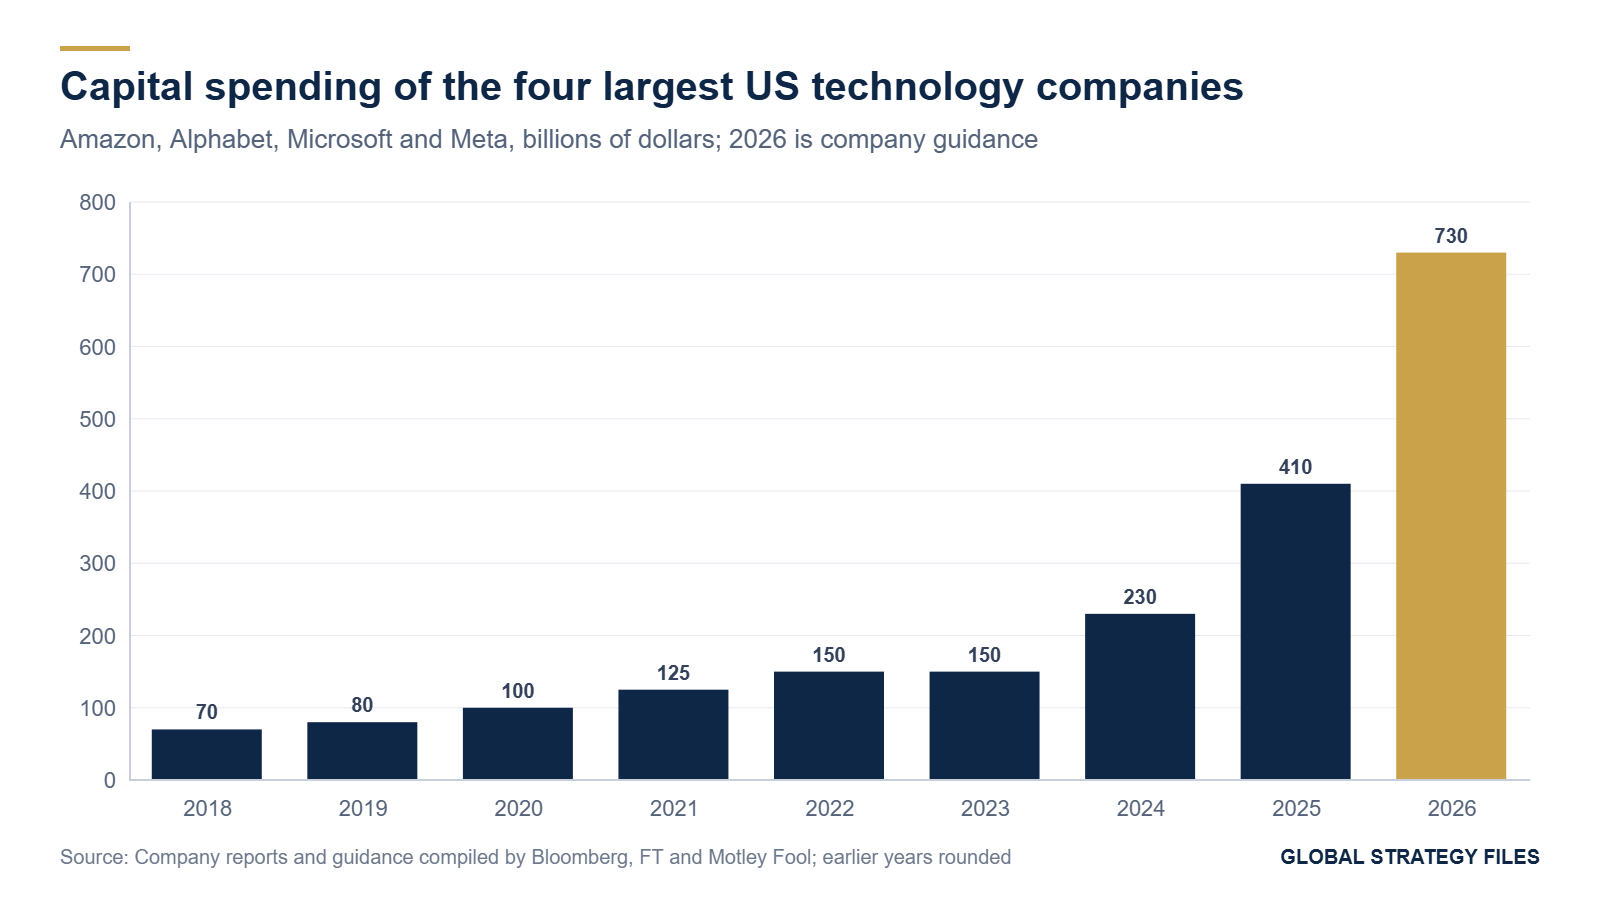
The capital spending of the four largest American technology companies rose from about 150 billion dollars in 2022 and 2023 to about 230 billion in 2024, a record 410 billion in 2025 and an expected 720 to 745 billion in 2026, according to the guidance they gave in July and October. Figure 6 shows the trajectory. In the third quarter of 2026 alone, their combined spending reached 208.7 billion dollars, 84 percent more than a year earlier. Amazon expects about 220 billion dollars in cash capital spending for the year, Alphabet 195 to 205 billion, Microsoft about 170 billion for the calendar year and Meta 130 to 145 billion. All four have signaled further increases in 2027.
The effect on their tax bills has been visible in company reports. Press analyses of company filings have reported, for example, that Microsoft's current federal tax expense fell from 14.1 billion dollars to 2.5 billion and that Meta recorded a one-time tax benefit of about 8 billion dollars in the first quarter of 2026. These figures combine expensing, the research catch-up and other provisions, and they should not be attributed to any single rule, but they illustrate the mechanism at the level of the largest taxpayers.
6.2 A stylized model of the AI tax gap
We model the tax gap generated by this investment as follows. We take the capital spending of the four largest companies from 2018 to 2026, assume that 55 percent of it consists of eligible equipment located in the United States (servers, networking, storage and electrical equipment, excluding buildings and foreign facilities), and compare the deductions under full expensing with those under straight-line depreciation over five years. The gap in each year equals 21 percent times the difference. We then project spending to 2035 under three scenarios: continued boom (growth of 25 percent in 2027 and 20 percent a year afterwards), plateau (25 percent growth in 2027 and stable spending from 2028) and bust (25 percent growth in 2027, a 35 percent fall in 2028 and 5 percent growth afterwards).
Figure 7 shows the results. In 2026, the stylized gap is about 46 billion dollars, close to our estimate of the persistent component of the 2026 shortfall for the whole economy, which suggests that the AI build-out accounts for most of it. In the continued boom scenario, the gap stabilizes near 50 billion dollars in 2027 to 2029 and then rises with spending, to about 74 billion dollars in 2031 and 128 billion in 2035. In the plateau scenario, the gap peaks at about 49 billion dollars in 2027, falls to about 16 billion in 2029 and disappears by 2031, as depreciation of the earlier vintages catches up with current spending. In the bust scenario, the gap collapses to 2 billion dollars in 2028 and turns negative in 2029 and 2030: the companies pay more tax than they would have under depreciation, because their current deductions fall below the depreciation they would have claimed on the large vintages of 2026 and 2027.
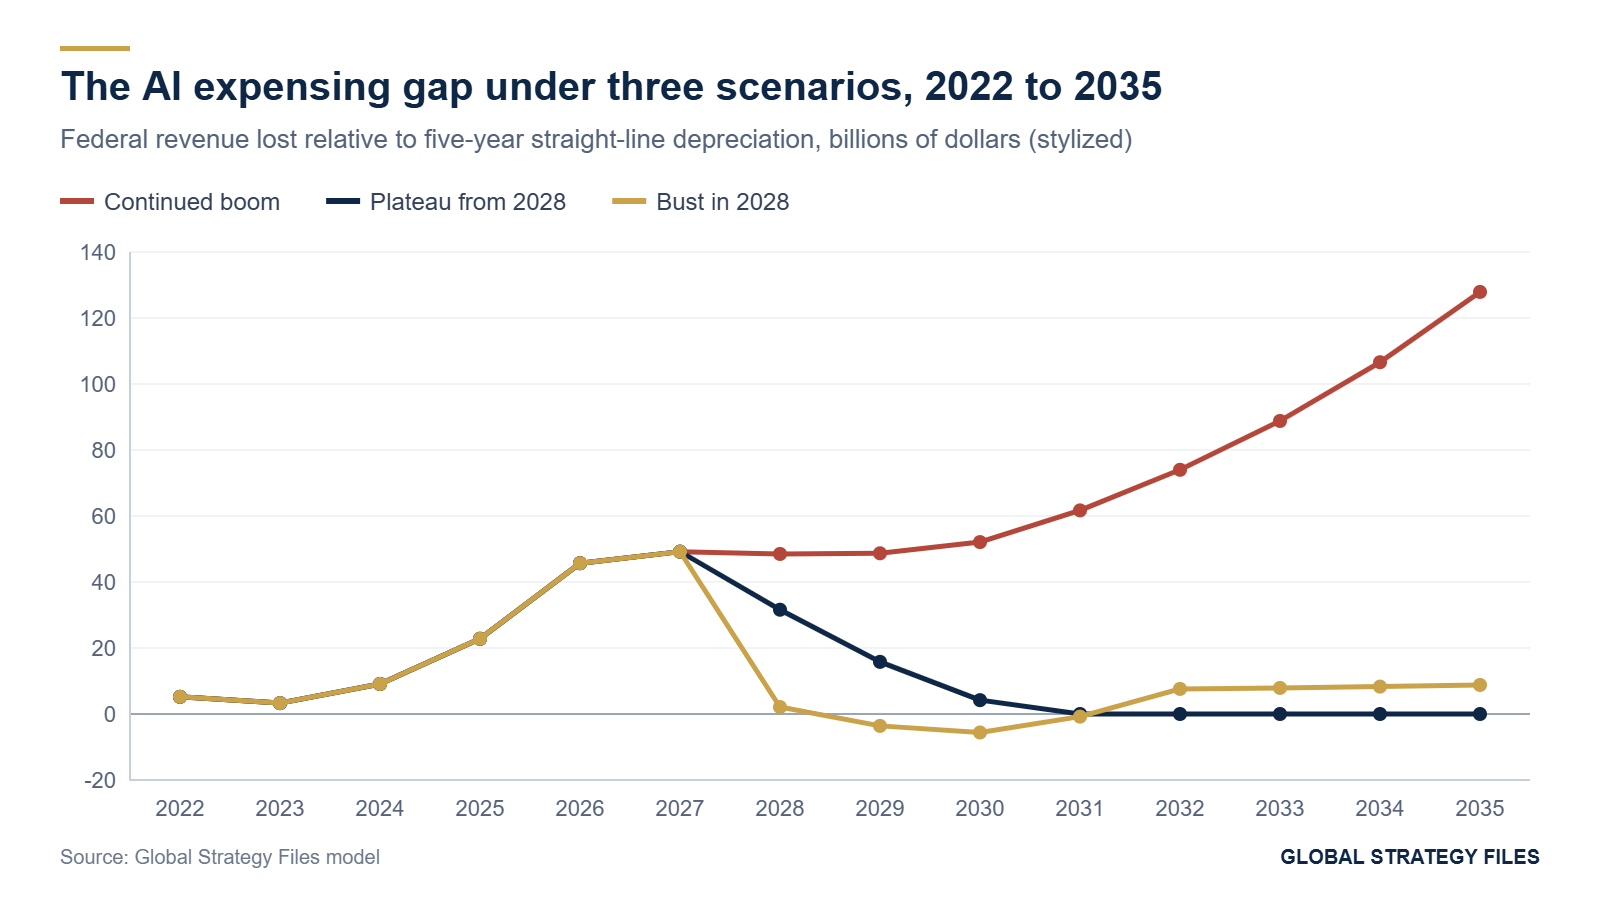
Table 5. The stylized AI expensing gap under three scenarios, billions of dollars of federal revenue
| Year | Continued boom | Plateau from 2028 | Bust in 2028 |
|---|---|---|---|
| 2025 | 23 | 23 | 23 |
| 2026 | 46 | 46 | 46 |
| 2027 | 49 | 49 | 49 |
| 2028 | 49 | 32 | 2 |
| 2029 | 49 | 16 | -4 |
| 2030 | 52 | 4 | -6 |
| 2031 | 62 | 0 | -1 |
| 2033 | 89 | 0 | 8 |
| 2035 | 128 | 0 | 9 |
Source: Global Strategy Files model. Positive values are revenue losses relative to five-year straight-line depreciation.
6.3 A tax on the end of investment cycles
The bust scenario reveals the most important and least discussed consequence of full expensing. Under depreciation, a company that stops investing continues to deduct the depreciation of its past investment for several years, which cushions its tax bill in a downturn. Under expensing, the deductions stop as soon as investment stops. Corporate receipts therefore become pro-cyclical with respect to investment: they fall when investment booms and rise when it collapses. If the AI build-out were to end abruptly, as the telecom build-out did in 2001 and 2002, the companies concerned would see their taxable income jump at precisely the moment their revenues and valuations fell. The Treasury would collect more tax in the bust than in the boom.
This is a new form of fiscal fragility. For forecasters, it means that corporate receipts can no longer be projected from profits alone; they must be projected from the investment cycle of a handful of firms. For the companies, it means that the tax system adds to the cost of retrenchment. For policymakers, it means that the revenue cost of expensing will be largest exactly when the economy is strongest, which is the opposite of what a stabilizing tax system should do.
7. Implications
For the budget. The 2026 decline in corporate receipts is roughly half transitory and half persistent. Budget forecasts should not treat the 2027 rebound, which the end of the research catch-up will produce, as evidence that expensing pays for itself. Over the next decade, the persistent component depends almost entirely on the growth of investment, and above all on the AI build-out. A continued boom would cost tens of billions of dollars a year more than official scoring that assumes moderate investment growth.
For the debate on expensing. The case for expensing rests on sound economic arguments: it removes the tax penalty on investment, encourages capital formation and simplifies tax accounting. Our results do not refute those arguments. They refute a narrower claim, that expensing is revenue-neutral in the long run. It is revenue-neutral only in an economy without investment growth. Policymakers who want the benefits of expensing should accept and finance a permanent revenue cost, which our model allows them to estimate as a function of investment growth.
For the structure of the tax. The concentration of the gap in a few very large companies suggests targeted options that would preserve the incentive to invest while limiting the revenue loss: a minimum tax on book income that does not allow expensing to reduce liability below a floor (the corporate alternative minimum tax created in 2022 already does this partially for the largest companies, but it exempts depreciation differences), a cap on expensing above a threshold of annual investment, or a neutral cost recovery system that indexes depreciation deductions for inflation and interest, giving the same present value as expensing without the front-loading.
For the stability of revenue. Full expensing increases the volatility of corporate receipts and links them to the investment cycle of a few firms. The Treasury and the Congressional Budget Office should publish sensitivity analyses of corporate receipts to the AI capital spending path, as they do for interest rates.
For the political economy. The corporate tax now provides about 7 percent of federal revenue, and the largest corporations pay a fraction of their profits. Whatever the economic merits of expensing, this configuration is politically fragile. A future Congress facing large deficits will find it difficult to justify a corporate tax that collects less in a profit boom than in a recession.
8. What is new in this study
This study provides, to our knowledge, the first decomposition of the 2026 corporate tax shortfall into a transitory research catch-up component, which we estimate at about 50 to 60 billion dollars and expect to reverse in 2027, and a persistent equipment component of about 30 to 50 billion dollars. It states and quantifies the condition under which the expensing loss becomes permanent, with a closed-form ratio that depends only on investment growth and asset life, and it provides a table of permanent loss shares for policy use. It applies the ratio to the AI build-out and simulates the corporate tax gap to 2035 under three scenarios, showing that full expensing turns corporate receipts pro-cyclical with respect to investment. The finding that expensing has a large first-year cost confirms official estimates; the findings on permanence and pro-cyclicality, and their quantification for the AI boom, are new.
Methodological annex
Data. Corporate income tax receipts by fiscal year are from the Office of Management and Budget historical tables for 2006 to 2024 and from the Congressional Budget Office for 2025 (452 billion dollars) and 2026 (a decline of about 70 billion dollars, or 16 percent, reported in the summary of fiscal year 2026). Total receipts for 2026 are 5.4 trillion dollars. Corporate profits before tax are rounded national accounts values from the Bureau of Economic Analysis, with Global Strategy Files estimates for 2025 and 2026; they are used only to compute an indicative yield ratio. Technology capital spending is from company guidance and reports compiled by the press (Bloomberg, Financial Times, Motley Fool).
Regression. The yield ratio (receipts divided by profits) was regressed on a constant, the statutory rate, the bonus depreciation rate, a dummy for research amortization (2022 to 2024) and a crisis dummy (2009 to 2011), on annual data for 2006 to 2025. Only the bonus coefficient is significant (minus 0.085, p value 0.018; R squared 0.64). The statutory rate and the bonus rate are collinear after 2018, which is why we do not use the regression for counterfactuals.
Permanent gap. R(g, N) = (1/N) times the sum for k from 0 to N minus 1 of (1+g) to the power minus k. The permanent loss share is 1 minus R.
AI scenarios. Capital spending of the four companies: 70, 80, 100, 125, 150, 150, 230, 410 and 730 billion dollars for 2018 to 2026. Eligible United States equipment share: 55 percent. Tax rate: 21 percent. Straight-line depreciation over five years as the comparison regime. The model is stylized: it ignores half-year conventions, accelerated depreciation schedules (MACRS) and the actual bonus rates of 2023 and 2024, and it compares expensing with straight-line rather than with the law that would otherwise have applied.
Limitations. National accounts profits differ from taxable income. The decomposition of the 2026 shortfall is calibrated to the observed total and depends on assumptions about research spending and the uptake of the catch-up election. The AI model covers four companies and ignores other investors, such as Oracle, specialized data center developers and utilities.
References
Congressional Budget Office (2026). Monthly Budget Review: Summary for Fiscal Year 2026. Washington, DC, 9 November 2026.
Congressional Budget Office (2026). Monthly Budget Review: August 2026. Washington, DC, 9 September 2026.
Congressional Budget Office (2026). The Budget and Economic Outlook: 2026 to 2036. Washington, DC, February 2026.
American Action Forum (2026). CBO: FY 2026 budget deficit totaled 2 trillion dollars. October 2026.
Tax Foundation (2026). Why corporate tax revenues fall before they mostly recover. Washington, DC.
Tax Foundation (2026). Three facts straightening out the debate over bonus depreciation. Washington, DC.
Cato Institute (2026). The windfall narrative around OBBBA expensing misses the point. Washington, DC.
Fox, J. (2026). How to make US corporate income taxes work again. Bloomberg Opinion, 27 July 2026.
Bloomberg News (2026). Trump's tax cut delivers at least 65 billion dollars windfall to corporations. 31 March 2026.
Office of Management and Budget (2026). Historical Tables, Table 2.1: Receipts by Source. Washington, DC.
Motley Fool Research (2026). AI companies spending on data centers, third quarter 2026.
Driss EFFINA, PhD
Independent Researcher, Global Strategy Files
The opening pages of our four country reports: United States, United Kingdom, Japan and China. A free PDF, sent to your inbox.
You will also receive occasional analysis from Global Strategy Files. Unsubscribe in one click, at any time.