The Swing Supplier Dilemma: Record Energy Exports, the Hormuz Premium and the American Household

Abstract
Since the war with Iran began at the end of February 2026 and the Strait of Hormuz was closed to tanker traffic, the United States has become the swing supplier of the world energy system. Exports of crude oil and refined products reached a record 12.9 million barrels a day in April, and liquefied natural gas exports are on course to average about 17 billion cubic feet a day for the year, a quarter of world supply. Yet American households have paid more, not less, for fuel: the retail price of gasoline is expected to average 3.91 dollars a gallon in 2026, against 3.10 dollars in 2025, and diesel 5.19 dollars, against 3.66. This study asks a simple question with twenty years of data: how much of the increase in American fuel prices is explained by the world price of crude oil, and how much by the export pull that now links domestic refineries and pipelines to foreign demand? Using annual data from 2006 to 2026, we estimate the historical pass-through of crude prices to retail fuel and find that crude alone predicts a 2026 gasoline price of 3.39 dollars and a diesel price of 3.85 dollars. The unexplained premiums, 52 cents for gasoline and 1.34 dollars for diesel, are 2.3 and 3.2 times the standard error of the model, the largest in the sample. We show that the volume of refined product exports has a statistically significant effect on retail prices after controlling for crude: each additional million barrels a day of product exports has been associated with about 9 cents a gallon on gasoline and 18 cents on diesel. We then build an accounting of who gains and who pays in 2026. Households pay about 202 billion dollars more for gasoline and diesel than in 2025, or about 1,540 dollars per household. Domestic crude producers gain about 135 billion dollars, LNG exporters capture an arbitrage rent of about 65 billion dollars, and the nation as a whole gains about 30 billion dollars from improved terms of trade. The United States is richer because of the war; American drivers are poorer. The dilemma of the swing supplier is that the policy that would protect consumers, export restraint, would cost more in export revenue than it would save at the pump, and would hand the market share back to the very suppliers whose disruption created the crisis.
Key findings
- The United States moved from net petroleum imports of 12.4 million barrels a day in 2006 to net exports of about 3 million barrels a day in 2026, a swing of more than 15 million barrels a day in twenty years.
- Crude oil prices explain 83 percent of the annual variation of retail gasoline prices and 67 percent for diesel over 2006 to 2025. In 2026, gasoline is 52 cents above the level predicted by crude, and diesel 1.34 dollars above.
- Refined product exports add explanatory power: adding them to the model raises the explained share to 93 percent for gasoline and 87 percent for diesel. Each additional million barrels a day of product exports is associated with 9 cents a gallon on gasoline and 18 cents on diesel.
- Henry Hub gas prices show no statistical relationship with the share of production exported as LNG (p value 0.91). The domestic gas market has stayed insulated; the gap between world and domestic gas prices accrues to exporters as a rent of about 65 billion dollars in 2026.
- Households pay about 202 billion dollars more for road fuel in 2026 than in 2025. Crude producers gain about 135 billion dollars and the nation gains about 30 billion dollars in terms of trade.
- A cap that cut product exports by one million barrels a day would save households at most about 23 billion dollars a year, against a loss of about 47 billion dollars of export revenue.
1. Introduction: the paradox of the richest energy producer
The United States produces more crude oil than any country in history: a record 13.6 million barrels a day in 2025, about 40 percent more than Russia or Saudi Arabia. It is the largest exporter of liquefied natural gas. Its Gulf Coast refineries are among the most complex and efficient in the world. When the war with Iran closed the Strait of Hormuz at the end of February 2026 and removed roughly 82 million tonnes of oil, fuel and LNG exports from the Middle East in its first two months, American exporters filled a large part of the gap, adding about 25 million tonnes over the same period. In the language of energy markets, the United States became the swing supplier.
For American consumers, the result has been disappointing. Brent crude rose from about 70 dollars a barrel in late February to about 115 dollars in early May. Gasoline rose about 30 percent above its level of a year earlier and diesel about 54 percent. The consumer price index for gasoline was 37.4 percent higher in September 2026 than in September 2025. Residential natural gas prices rose about 14 percent. The cost of fuel became a central theme of the midterm elections of November 2026, and the record volume of exports came under political scrutiny: if the country produces more energy than it uses, why should Americans pay world prices at home?
The question is legitimate, and the usual answer, that oil is a world market and domestic prices follow world prices, is correct but incomplete. It is correct because crude oil trades freely and refiners pay the international price whether their crude comes from Texas or from Iraq. It is incomplete because refined products and natural gas are not perfectly integrated across borders. Refining capacity, pipeline routes, shipping rules and LNG liquefaction capacity create frictions that can either insulate the domestic market or tie it more closely to foreign demand. Whether exports raise domestic prices beyond what world crude prices imply is an empirical question.
This study answers it with twenty years of data. Section 2 traces the transformation of the United States from the largest importer to a large net exporter. Section 3 estimates the pass-through of crude prices to retail gasoline and diesel and measures the premium of 2026. Section 4 tests whether export volumes explain that premium. Section 5 examines natural gas, where the story is different. Section 6 builds a full accounting of the gains and losses of 2026. Section 7 evaluates the policy options, including export restraint, and Section 8 draws the implications.
2. From importer to swing supplier, 2006 to 2026
2.1 The great reversal
In 2006, the United States imported, net of exports, 12.4 million barrels a day of crude oil and petroleum products, close to 60 percent of its consumption. Energy dependence was a central theme of national security and a structural drag on the current account. Twenty years later, the country is a net exporter of about 3 million barrels a day. Figure 1 shows the trajectory. Net imports fell steadily from 2006 to 2019 as shale production surged and domestic demand plateaued; the balance crossed zero in 2020, and net exports have grown every year since.
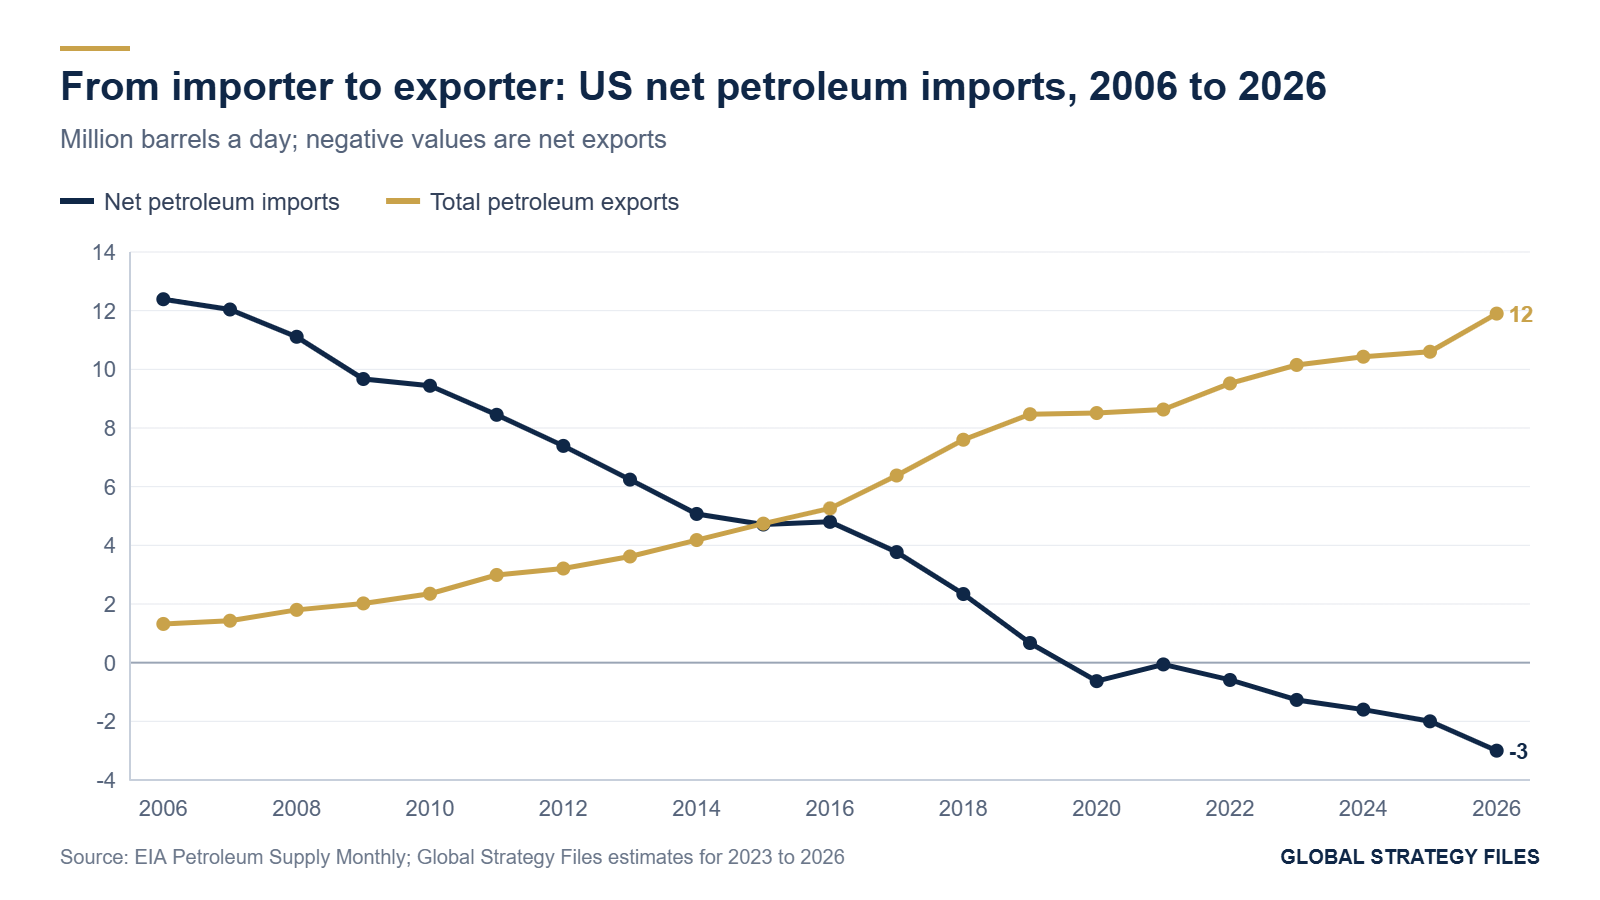
The reversal rests on three developments. The first is the shale revolution, which more than doubled crude production between 2010 and 2019. The second is the lifting of the ban on crude oil exports in December 2015, which allowed light shale crude to be sold abroad rather than discounted at home. Crude exports rose from about 50,000 barrels a day in 2011 to 4.0 million in 2025, 85 times as much. The third, less noticed, is the transformation of the Gulf Coast refining system into an export platform. Exports of refined products rose from about 1.3 million barrels a day in 2006 to about 6.6 million in 2025 and about 7 million in 2026. The Gulf Coast is today the only net petroleum-exporting region of the country, but its net exports are large enough to outweigh the net imports of all the others.
Table 1. The American energy trade in five snapshots
| Indicator | 2006 | 2015 | 2019 | 2025 | 2026 (est.) |
|---|---|---|---|---|---|
| Crude oil production (million b/d) | 5.1 | 9.4 | 12.3 | 13.6 | 13.7 |
| Crude oil exports (million b/d) | 0.03 | 0.47 | 2.98 | 4.00 | 4.9 |
| Refined product exports (million b/d) | 1.3 | 4.3 | 5.5 | 6.6 | 7.0 |
| Net petroleum imports (million b/d) | 12.4 | 4.7 | 0.7 | -2.0 | -3.0 |
| LNG exports (billion cubic feet a day) | 0.05 | 0.08 | 5.0 | 15.1 | 17.2 |
| Share of dry gas production exported as LNG (%) | 0.1 | 0.1 | 5.4 | 14.1 | 15.9 |
Source: Energy Information Administration; Global Strategy Files estimates for 2026 based on monthly data and the Short-Term Energy Outlook.
2.2 The 2026 export surge
The war accelerated the trend. Between January and April 2026, exports of gasoline rose 27 percent from the same months of 2025, diesel 23 percent, LNG 26 percent and ethane 30 percent. Crude shipments to Asia were projected to reach about 3.3 million barrels a day in May, almost three times the pre-war level of 1.1 million in January. In mid-April, total exports of crude and products reached a record 12.9 million barrels a day, against an average of 10.5 to 11.4 million in 2025. LNG exports reached a record 11.7 million tonnes in March, and about 73 million tonnes in the first seven months of the year, 23 percent more than a year earlier.
2.3 Liquefied natural gas: a market built in ten years
The LNG story is even more striking than the oil story. In 2015, the United States exported almost no LNG. The first cargo from Sabine Pass left in February 2016. By 2023 and 2024 the country was the largest LNG exporter in the world, and in 2025 its exports rose 26 percent to 15.1 billion cubic feet a day, 26 percent of world trade. Figure 2 shows the rise of LNG exports alongside the price of gas at Henry Hub. The striking feature is the absence of a visible relationship: domestic gas prices have fluctuated between 2 and 9 dollars per million British thermal units over twenty years, with peaks in 2008 and 2022 and troughs in 2012, 2016, 2020 and 2024, while LNG exports grew in a straight line. Section 5 returns to this point.

3. How much of the pump price is crude?
3.1 The historical pass-through
The retail price of a gallon of fuel has four components: the cost of crude oil, the refining margin, distribution and marketing costs, and taxes. Taxes are almost constant in nominal terms (the federal excise tax has been 18.4 cents a gallon for gasoline since 1993), and distribution costs move slowly. Most of the variation in pump prices therefore comes from crude and from refining margins.
We estimate, over the twenty years from 2006 to 2025, a simple linear relationship between the annual average retail price of regular gasoline (and of on-highway diesel) and the annual average price of Brent crude expressed in dollars per gallon (one barrel equals 42 gallons). The results, reported in Table 2, show a pass-through coefficient close to one for gasoline (0.94) and slightly above one for diesel (1.11): a one-dollar increase in the cost of a gallon of crude raises the pump price by about one dollar. Crude explains 83 percent of the variation of gasoline prices and 67 percent for diesel. The intercepts, 1.24 dollars for gasoline and 1.30 for diesel, capture the average cost of refining, distribution and taxes.
Table 2. Pass-through of crude oil prices to retail fuel prices, annual data 2006 to 2025
| Specification | Gasoline | Diesel |
|---|---|---|
| Model A: constant | 1.24 | 1.30 |
| Model A: crude price per gallon | 0.94 | 1.11 |
| Model A: R squared | 0.83 | 0.67 |
| Model A: standard error of the regression (dollars) | 0.22 | 0.41 |
| Model B: constant | 0.72 | 0.29 |
| Model B: crude price per gallon | 1.01 | 1.25 |
| Model B: product exports (million b/d) | 0.094 | 0.183 |
| Model B: R squared | 0.93 | 0.87 |
| 2026 price predicted by Model A | 3.39 | 3.85 |
| 2026 actual or expected price | 3.91 | 5.19 |
| 2026 premium over Model A | 0.52 | 1.34 |
Source: Global Strategy Files estimates from EIA data. All coefficients significant at the 1 percent level except the Model B constant for diesel.
3.2 The premium of 2026
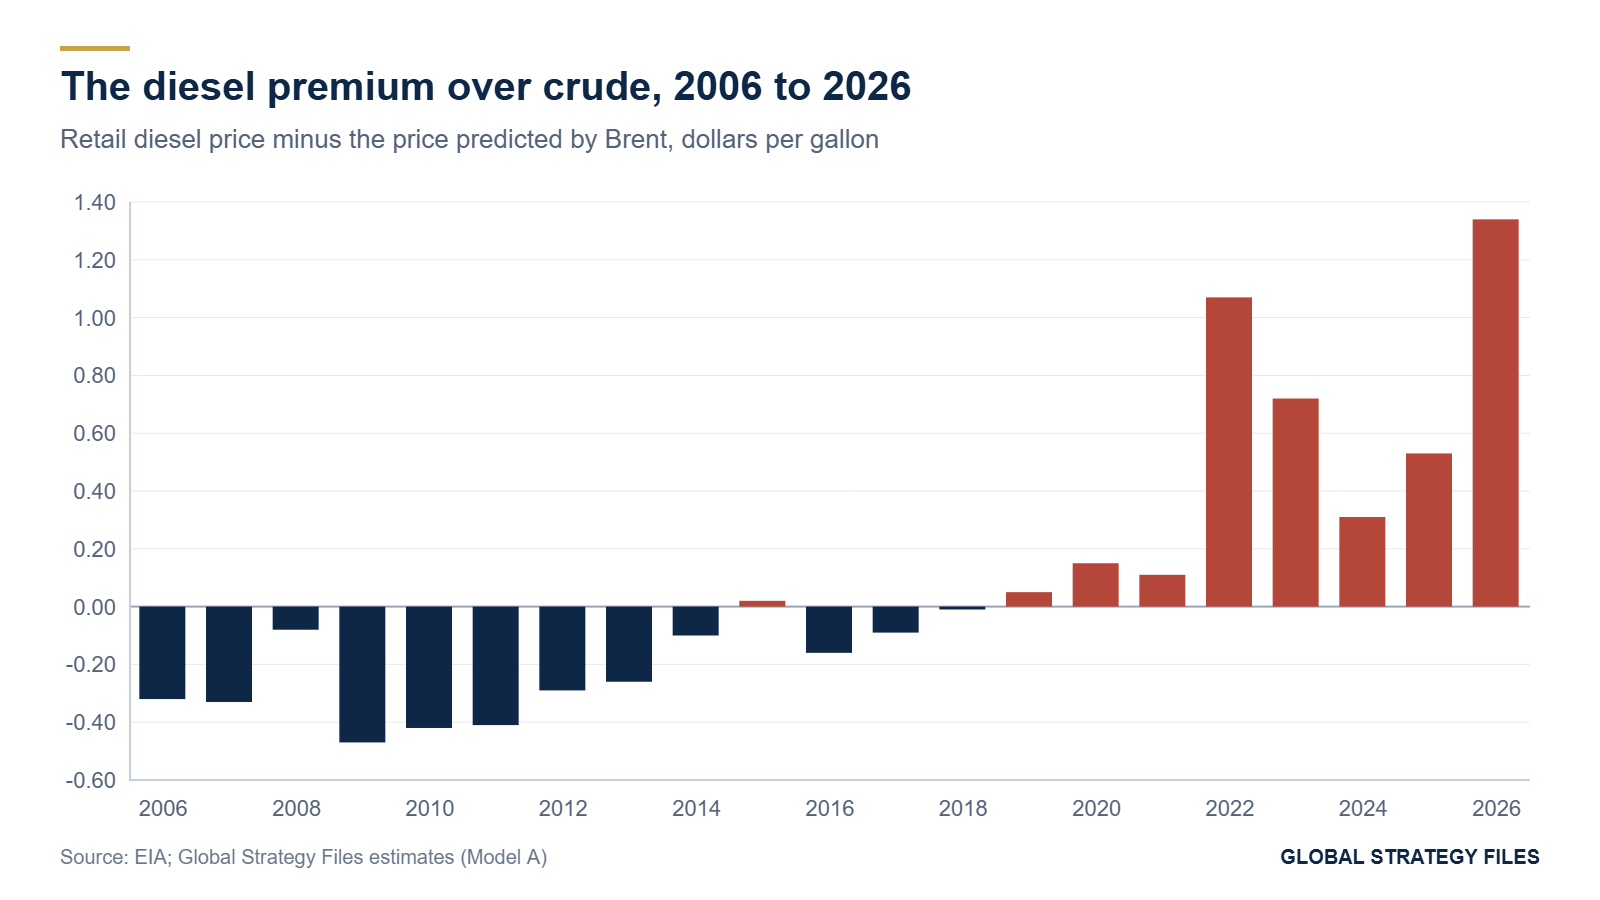
Applied to the expected 2026 average Brent price of about 96 dollars a barrel, Model A predicts a gasoline price of 3.39 dollars and a diesel price of 3.85 dollars. The Energy Information Administration expects actual averages of 3.91 and 5.19 dollars. The gap, which we call the premium over crude, is 52 cents for gasoline and 1.34 dollars for diesel. Figure 3 shows actual and predicted gasoline prices over the full period, and Figure 4 shows the diesel premium year by year.

Two observations stand out. First, the 2026 premiums are the largest of the sample, at 2.3 standard errors for gasoline and 3.2 standard errors for diesel. Only 2022, the year of the invasion of Ukraine, comes close for diesel (1.07 dollars). Second, the diesel premium did not disappear after 2022. It stayed positive in every year from 2015 onward and has averaged about 60 cents since 2022, against minus 30 cents in 2006 to 2013. Something structural changed in the relationship between American crude and American diesel in the middle of the 2010s, and the war has amplified it.
3.3 Refining margins and the closure of capacity
Part of the explanation lies in refining margins. The gap between the retail price and the cost of crude per gallon, a rough measure of the combined refining, distribution and tax wedge, averaged about 95 cents for gasoline in 2008 to 2014. It rose above 1.30 dollars after 2021 and is about 1.62 dollars in 2026. For diesel, it rose from about 1.15 dollars before 2015 to about 2.90 dollars in 2026. Refining capacity has been closing on the West Coast and in parts of the East Coast, while demand from abroad for American products has grown. Higher margins are the price signal that rations scarce refining capacity between domestic and foreign buyers.
4. Do exports raise domestic prices?
4.1 The statistical test
If American refineries sell into a world market, foreign demand for their products should affect domestic prices only through the world price of products, which is closely tied to crude. If, however, refining capacity is constrained and exports compete with domestic customers for the output of specific refineries, the volume of exports should have an additional effect on domestic prices, over and above the price of crude.
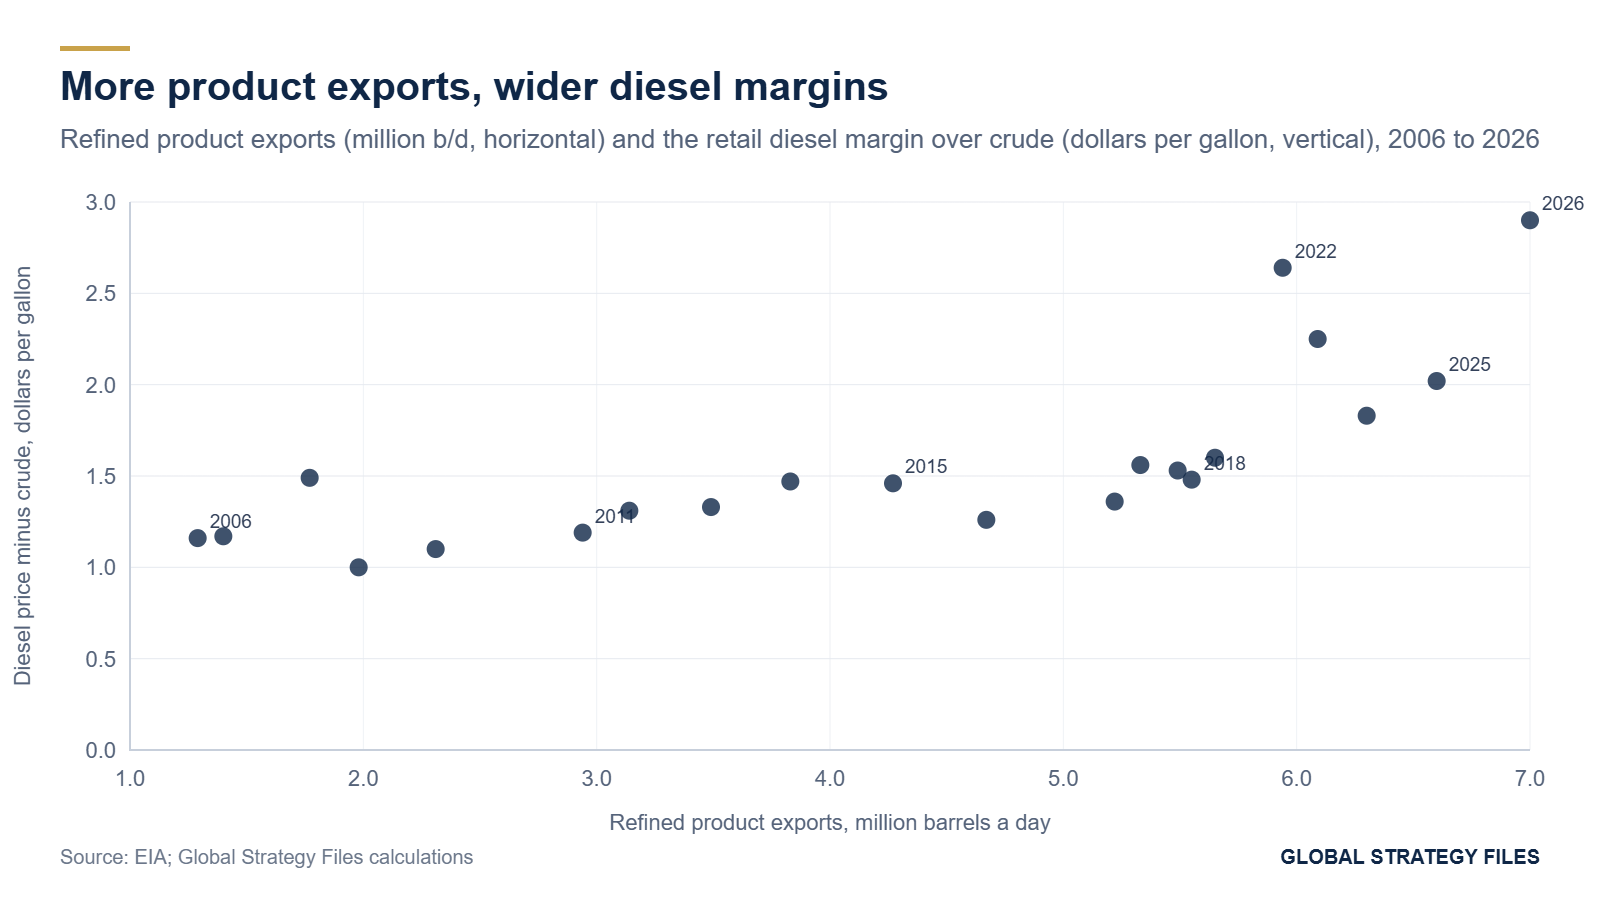
Model B in Table 2 tests this hypothesis by adding the volume of refined product exports to the regression. The coefficient is positive and significant for both fuels: 9.4 cents a gallon per million barrels a day of exports for gasoline and 18.3 cents for diesel. Adding exports raises the explained share of variation from 83 to 93 percent for gasoline and from 67 to 87 percent for diesel. Figure 5 shows the relationship between product exports and the diesel margin, year by year.
4.2 Interpretation and caution
The result must be interpreted with care. Product exports have grown almost every year since 2006, so the variable partly captures a time trend, and other trending factors, such as refinery closures, environmental regulations and the rising cost of renewable fuel credits, could be responsible for part of the effect. The annual frequency also limits the number of observations. We therefore treat the coefficient as an upper bound on the causal effect of exports rather than a precise estimate.
Even as an upper bound, the result is informative. It suggests that export demand has raised the domestic diesel price by roughly 1.2 dollars a gallon in total relative to a world in which the Gulf Coast exported nothing (6.6 million barrels a day times 18 cents), and that the additional 0.4 million barrels a day of product exports in 2026 accounts for about 7 cents of the 1.34 dollar diesel premium. The remainder reflects the world price of diesel, which rose far more than crude because the Middle East is a major exporter of middle distillates and because attacks on Russian refineries further tightened supply. In other words, most of the 2026 premium is imported through the world product market, not created by American exports. The swing supplier transmits the shortage; it does not cause it.
5. Natural gas: the market that stayed home
5.1 An insulated price
Natural gas tells a different story. Unlike oil, gas cannot be shipped abroad without liquefaction, and liquefaction capacity is fixed in the short run. When world gas prices rise, American exporters cannot increase shipments beyond the capacity of their terminals, so domestic producers cannot sell more abroad, and the domestic price is shielded from the world price.
The data confirm the insulation. We regressed the Henry Hub price on the share of domestic dry gas production exported as LNG over 2010 to 2026. The coefficient is essentially zero (0.006 dollars per percentage point) and not significant (p value 0.91). Despite LNG exports rising from nothing to about 16 percent of production, the domestic price is no higher than in the years before exports began. The Energy Information Administration expects Henry Hub to average about 3.47 dollars per million British thermal units in 2026, less than in 2008, 2014 or 2022, while LNG in Asia has averaged just under 17 dollars since the start of the year.
5.2 Where the gas rent goes
When the domestic price is insulated and the world price soars, the difference goes to whoever controls the bottleneck: the owners of liquefaction capacity and the traders who hold export contracts. We estimate this arbitrage rent as the gap between the Asian LNG price and the Henry Hub price, minus about 3.5 dollars of liquefaction, shipping and regasification costs, times the volume of exports. For 2026, the calculation gives (17.0 minus 3.47 minus 3.5) dollars times 17.2 billion cubic feet a day, or about 65 billion dollars for the year. Much of it is shared with foreign buyers under long-term contracts indexed to Henry Hub, so the portion captured by American companies is smaller, but the order of magnitude shows how valuable export capacity became when Qatar lost access to world markets.
This does not mean that American households were spared. Residential gas prices were about 14 percent higher than a year earlier in the spring of 2026, close to three-year highs, because local distribution costs and regional pipeline constraints matter more for retail bills than the Henry Hub benchmark. In areas where LNG terminals compete with local users for pipeline capacity, notably along the Gulf Coast, the competition has raised regional prices. But the national evidence is clear: LNG exports have not exported the world gas crisis into American kitchens the way refined product exports have exported part of the diesel crisis into American trucks.
6. Who gains and who pays: an accounting of 2026
6.1 The method
To measure the distributional consequences of the 2026 price shock, we compare expected 2026 averages with 2025 averages and multiply price changes by volumes. The calculation is static: it ignores demand responses, which are small in the short run for fuel, and it does not attempt to track every intermediate margin. Its purpose is to establish orders of magnitude.
6.2 The results
Table 3 and Figure 6 summarize the accounting. On the losing side, households and businesses that buy road fuel pay about 111 billion dollars more for gasoline (8.9 million barrels a day times an 81 cent increase per gallon) and about 91 billion dollars more for diesel (3.9 million barrels a day times a 1.53 dollar increase). Airlines and their passengers pay about 19 billion dollars more for jet fuel. On the winning side, domestic crude producers receive about 135 billion dollars more for their output (13.7 million barrels a day times a 27 dollar increase per barrel), refiners capture higher margins, and LNG exporters and their foreign partners share an arbitrage rent of about 65 billion dollars.
Table 3. The accounting of the 2026 energy price shock, billions of dollars, 2026 versus 2025
| Group | Change | Basis of calculation |
|---|---|---|
| Gasoline buyers | -111 | 8.9 million b/d, plus 0.81 dollars per gallon |
| Diesel buyers | -91 | 3.9 million b/d, plus 1.53 dollars per gallon |
| Jet fuel buyers | -19 | 1.75 million b/d, crude-equivalent increase |
| Crude oil producers | +135 | 13.7 million b/d, plus 27 dollars per barrel |
| LNG export chain (shared with buyers) | +65 | 17.2 Bcf/d, world minus domestic price minus costs |
| Nation (terms of trade on net exports) | +30 | 3.0 million b/d net exports, plus 27 dollars per barrel |
| Road fuel cost per household | about -1,540 dollars | 202 billion dollars over 131 million households |
Source: Global Strategy Files calculations from EIA prices and volumes.
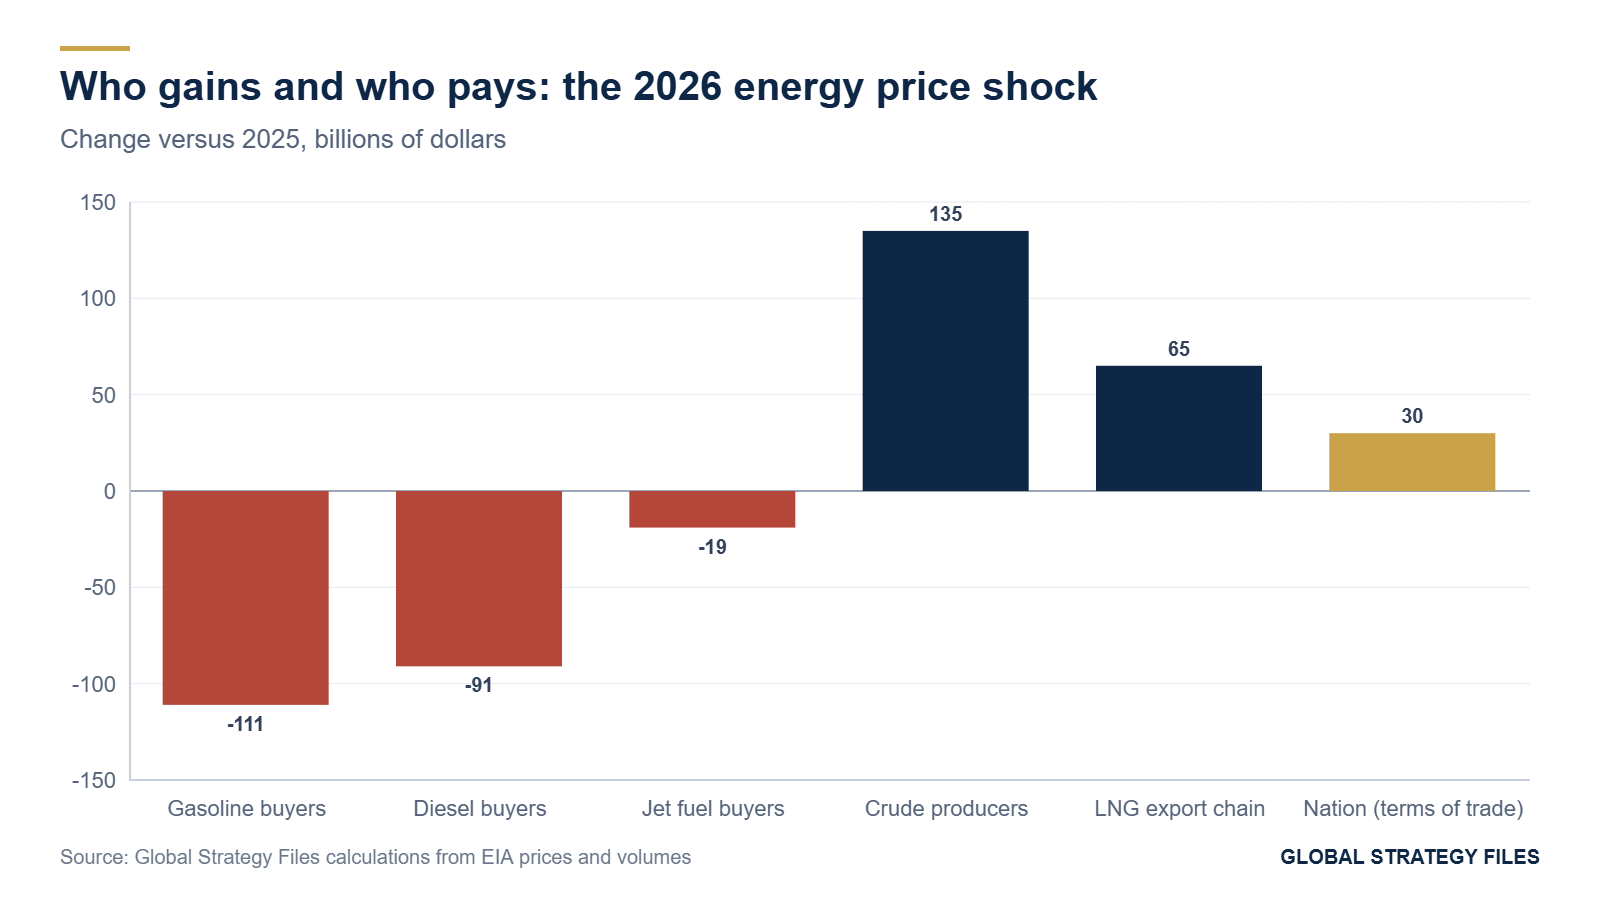
The national balance is positive. Because the United States exports more petroleum than it imports, a higher world price is, for the country as a whole, a terms-of-trade gain, worth about 30 billion dollars on net exports of 3 million barrels a day. Twenty years ago, the same price shock would have cost the nation about 120 billion dollars (12.4 million barrels a day of net imports times 27 dollars). The war has made the United States richer as a nation, in contrast with Europe and Asia, which pay the full cost of the shock.
The distribution, however, is anything but balanced. The gains accrue to a concentrated group of producers, royalty owners, refiners and shareholders, located mostly in Texas, New Mexico, North Dakota, Louisiana and Oklahoma. The losses are spread across 131 million households, about 1,540 dollars each on average, and fall most heavily on rural households who drive longer distances, on lower-income households for whom fuel represents a larger share of spending, and on trucking, agriculture and other diesel-intensive sectors that pass the cost on to consumers through food and goods prices.
6.3 The regional geography of the rent
The geography of gains and losses maps closely onto the electoral map of the midterms. Producer states, where the rent is concentrated, account for less than 15 percent of the population. Consumer states with long commutes and high diesel use, notably in the Midwest and the Southeast, saw the largest increases in household fuel costs relative to income. The political economy of the swing supplier is therefore unusual: the policy that makes the nation richer, maximum export, makes most voters poorer, and the policy that would protect most voters, export restraint, would reduce national income. Section 7 quantifies the trade-off.
6.4 Twenty years of the household fuel bill
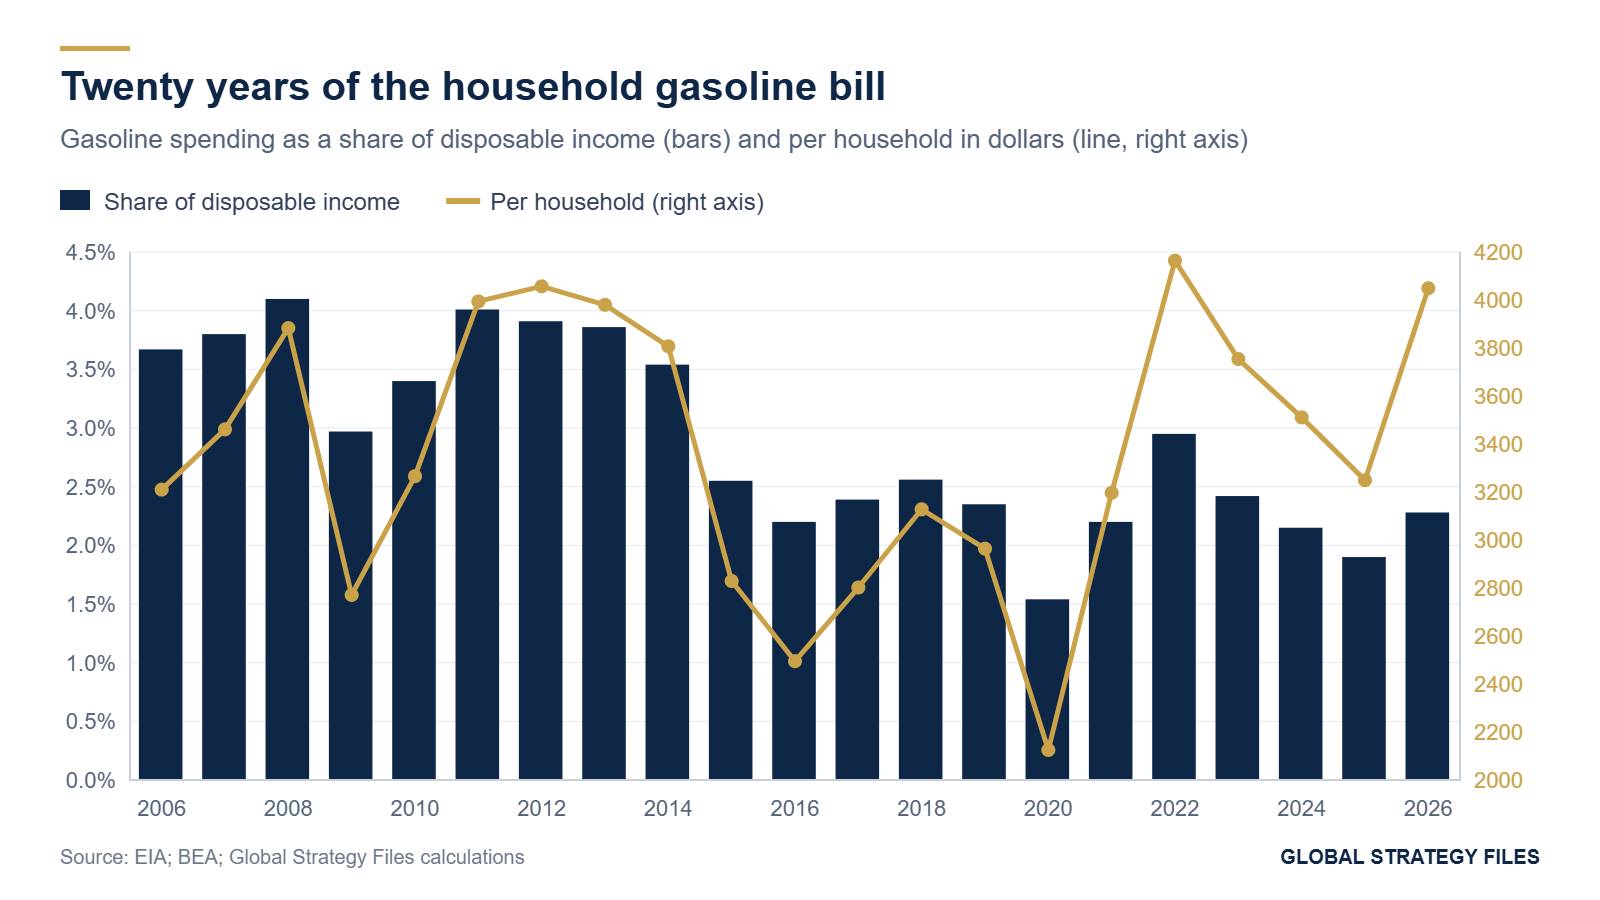
How large is the 2026 shock compared with earlier episodes? We reconstructed the annual gasoline bill of American consumers from 2006 to 2026 by multiplying motor gasoline consumption by the average retail price, and expressed it per household and as a share of disposable personal income. Figure 8 shows the result. In nominal terms, the 2026 bill, about 530 billion dollars or about 4,050 dollars per household, matches the record of 2022 (532 billion dollars) and exceeds the levels of 2011 to 2013. As a share of disposable income, however, it is about 2.3 percent, below the 2.95 percent of 2022 and far below the peaks of 4.1 percent in 2008 and about 4 percent in 2011 and 2012.
This comparison matters for the interpretation of the political reaction. The 2026 shock is severe in its speed (the bill rose by about 107 billion dollars in a single year, the second largest increase in the sample after 2022) and in its concentration on diesel, which is not included in the household gasoline bill but feeds into food and goods prices. It is less severe in its level relative to income, because nominal incomes have grown by roughly 130 percent since 2006 while gasoline consumption has stagnated as vehicles became more efficient. The pain of 2026 comes from the change, not the level, and from its coincidence with three years of cumulative price increases in food, rents and insurance that had already exhausted the patience of households.
7. The policy options
7.1 Export restraint
The most direct response to high domestic prices would be to restrict exports of refined products, as several members of Congress proposed in the spring of 2026. Our Model B coefficients give an upper bound on the domestic benefit. A cap that reduced product exports by one million barrels a day would lower the gasoline price by at most about 9 cents and the diesel price by at most about 18 cents. Applied to domestic consumption, the saving to buyers would be at most about 23 billion dollars a year (12 billion on gasoline and 11 billion on diesel). The cost would be the loss of about one million barrels a day of exports worth roughly 130 dollars a barrel, or about 47 billion dollars of gross export revenue, of which a large part is value added by American refiners and their workers.
Figure 7 compares the two magnitudes. Even on generous assumptions, the cost to the national economy is about twice the benefit to consumers. And the calculation ignores three effects that would worsen the balance. First, refiners would reduce runs rather than sell surplus products at a loss in a saturated Gulf Coast market, so the domestic supply increase would be smaller than the export cut. Second, the Jones Act, which requires domestic waterborne shipments to use American-built ships, makes it expensive to move Gulf Coast products to the East and West Coasts, so the price relief would be concentrated in the Gulf region, where prices are already lowest, while coastal markets that import products would see little benefit or even higher prices. Third, foreign buyers who lost American supply would bid for the same cargoes from other sources, raising the world price that domestic refiners pay for crude.

7.2 Alternatives
Table 4 compares export restraint with four alternatives. A temporary suspension of the federal gasoline and diesel excise taxes would lower pump prices by up to 18.4 and 24.4 cents, at a fiscal cost of about 3 billion dollars a month, but experience suggests that part of the reduction would be absorbed by retail margins. A targeted rebate financed by a temporary windfall levy on crude producers would redistribute part of the 135 billion dollar gain to households without reducing supply, but it would raise legal and investment concerns. A waiver of the Jones Act for fuel shipments would lower East Coast prices modestly by allowing cheaper foreign-flagged tankers to carry Gulf Coast products. Finally, the release of strategic stocks, already used in 2026 with exchanges of 40 million barrels from the Strategic Petroleum Reserve, can smooth price spikes but cannot offset a shortage of the scale of the Hormuz closure.
Table 4. Policy options against the 2026 fuel price shock
| Option | Effect on pump prices | Cost or risk | Assessment |
|---|---|---|---|
| Cap on product exports (1 million b/d) | Up to minus 9 cents gasoline, minus 18 cents diesel | About 47 billion dollars of export revenue; market share lost to rivals | Costly and regressive geographically |
| Federal excise tax holiday | Up to minus 18 to 24 cents | About 3 billion dollars a month | Fast, partly absorbed by margins |
| Windfall levy and household rebate | No price effect; income transfer | Legal risk; investment deterrent | Efficient in principle, hard in practice |
| Jones Act waiver for fuel | Minus a few cents on the East and West Coasts | Opposition from domestic shipping | Low cost, modest effect |
| Strategic Petroleum Reserve releases | Temporary relief | Depletes emergency stocks | Useful for spikes, not for a long war |
Source: Global Strategy Files assessment.
7.3 Scenarios for 2027
The Energy Information Administration now expects Brent to average about 86 dollars in 2027, gasoline 3.73 dollars and diesel 5.03 dollars. Applying our Model A to 86 dollars gives predicted prices of 3.17 dollars for gasoline and 3.58 dollars for diesel, which means that the official forecast assumes the premiums over crude persist at about 56 cents and 1.45 dollars. In other words, the market expects that the structural tightness of refined products will outlast the crude shock. If the premiums instead return to their 2023 to 2025 average (about 20 cents for gasoline and 50 cents for diesel), pump prices in 2027 would be about 3.37 and 4.08 dollars. The difference, roughly 36 cents for gasoline and 95 cents for diesel, is worth about 85 billion dollars a year to American fuel buyers and is the most important uncertainty in the energy outlook for households.
8. Implications
The national interest and the household interest have diverged. For most of its history, the United States experienced oil shocks as a national loss. Since 2020, it has experienced them as a national gain and a household loss. This divergence is permanent as long as the country remains a large net exporter, and it calls for policy tools, such as automatic rebates financed from resource revenue, that many producer countries already use.
Diesel is the weak point. The premium of diesel over crude is the largest and most persistent anomaly in our data, and diesel moves the costs of food, construction and goods. Any strategy to protect households from energy shocks should start with diesel supply: refinery resilience, distillate stocks in the Northeast, and shipping flexibility.
LNG exports are not the culprit. The evidence does not support the view that LNG exports have raised domestic gas prices. Policymakers worried about winter heating bills should focus on regional pipeline and distribution constraints rather than on export permits.
The swing supplier role is a strategic asset with a domestic cost. American exports have cushioned the world from the Hormuz closure, kept Europe supplied and strengthened alliances. The cost of that role is borne by American drivers. Making that cost explicit, and compensating it, is a condition for sustaining the role politically.
9. What is new in this study
To our knowledge, this study offers the first estimate of the 2026 premium of American retail fuel prices over the level predicted by crude, measured against a twenty-year pass-through model (52 cents for gasoline and 1.34 dollars for diesel). It provides a test of the effect of refined product export volumes on domestic prices, with an upper-bound coefficient of 9 and 18 cents per million barrels a day. It documents the absence of a statistical relationship between LNG export intensity and Henry Hub prices over 2010 to 2026. It builds a complete accounting of the 2026 shock by group, and it quantifies the cost-benefit ratio of export restraint at about two to one against restraint. The finding that the United States gains about 30 billion dollars in terms of trade from a shock that would have cost it about 120 billion twenty years earlier confirms, and quantifies for 2026, a widely shared intuition.
Methodological annex
Data. Annual average Brent spot prices, retail regular gasoline prices and on-highway diesel prices are from the Energy Information Administration; 2026 values are the expectations of the October and November 2026 Short-Term Energy Outlooks (Brent 96 dollars, gasoline 3.91 dollars, diesel 5.19 dollars). Export and production volumes are from the Petroleum Supply Monthly and Natural Gas Monthly; 2026 values are estimates based on data through the third quarter. Henry Hub for 2026 is derived from the Short-Term Energy Outlook statement that 2027 prices will be 9 percent lower than in 2026.
Models. Model A: P = a + b times (Brent divided by 42), estimated by ordinary least squares on 2006 to 2025. Model B adds refined product exports, defined as total petroleum exports minus crude exports, in million barrels a day. The premium for 2026 is actual or expected price minus the Model A prediction.
Accounting. Volume assumptions: gasoline consumption 8.9 million b/d, diesel 3.9 million b/d, jet fuel 1.75 million b/d, crude production 13.7 million b/d, net petroleum exports 3.0 million b/d. LNG rent assumes an Asian price of 17 dollars per million British thermal units and transport and processing costs of 3.5 dollars.
Limitations. Annual data limit the number of observations, and trending variables may produce spurious correlation; the export coefficient should be read as an upper bound. The accounting is static and ignores demand responses and the distribution of refining margins between domestic and foreign owners. Regional differences in prices are not modeled.
References
Energy Information Administration (2026). Short-Term Energy Outlook, October 2026 and November 2026. Washington, DC.
Energy Information Administration (2026). Annual U.S. crude oil exports decrease for first time since 2021. Today in Energy, 10 March 2026.
Energy Information Administration (2026). U.S. exports of major transportation fuels in 2025 were about the same as in 2024. Today in Energy, 9 March 2026.
Energy Information Administration (2026). The United States is a major energy exporter and importer, especially for petroleum. Today in Energy, 27 May 2026.
Bureau of Labor Statistics (2026). Consumer Price Index, September and October 2026. Washington, DC.
Maguire, G. (2026). Booming U.S. energy exports draw scrutiny as domestic fuel prices bite. Reuters column, May 2026.
Reuters (2026). US exporters are plugging a Qatar-sized LNG supply hole, for now. April 2026.
Bloomberg News (2026). U.S. raises forecasts for 2027 gasoline and diesel prices. 10 November 2026.
International Group of Liquefied Natural Gas Importers (2026). Annual Report: The LNG Industry in 2025.
Kpler (2026). LNG and crude export tracking data, January to July 2026.
Driss EFFINA, PhD
Independent Researcher, Global Strategy Files
The opening pages of our four country reports: United States, United Kingdom, Japan and China. A free PDF, sent to your inbox.
You will also receive occasional analysis from Global Strategy Files. Unsubscribe in one click, at any time.